
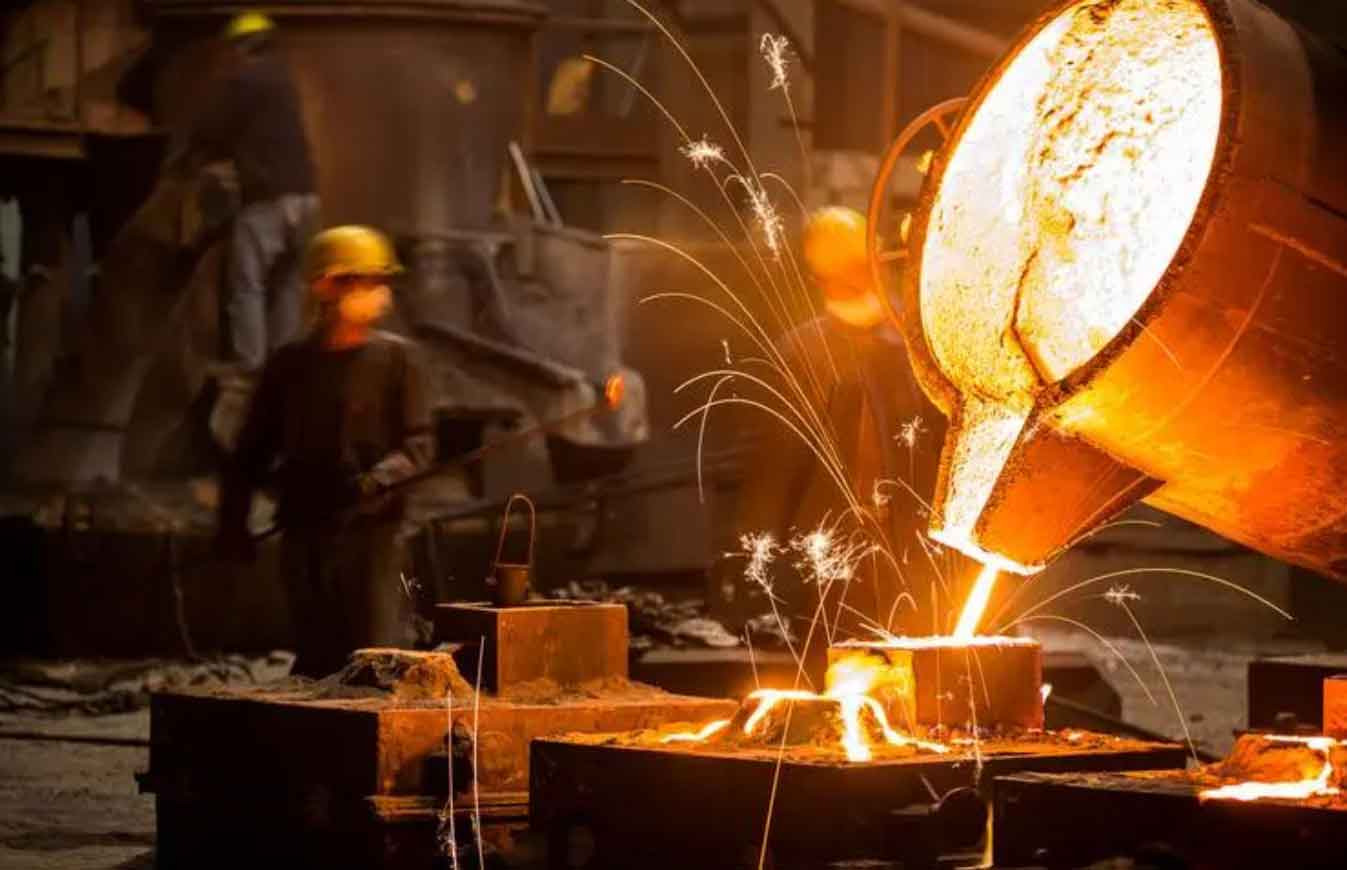
In recent years, the traditional manufacturing sector has faced increasing pressure to reduce carbon emissions and improve resource efficiency. Among the various manufacturing processes, the sand casting foundry industry remains one of the most energy-intensive and environmentally impactful sectors. Although modern foundries have adopted various measures to improve efficiency, the extensive use of fossil fuels, binders, and metal materials still leads to significant greenhouse gas emissions. As a researcher working closely with the sand casting foundry industry, I have recognized the urgent need to systematically compare different mold forming technologies from a low-carbon perspective. New technologies such as sand 3D printing and CNC sand milling have emerged, yet their environmental benefits have not been fully quantified for different casting complexities. Therefore, my research aims to develop a decision-making framework that can identify the most low-carbon molding process for a given casting, based on a quantitative measure of casting complexity and production batch.
1. Background and Research Motivation
The global manufacturing industry consumes roughly 24% of total final energy, with casting processes contributing a substantial share. Traditional sand casting foundries often operate with energy utilization rates as low as 15%–25%, and the emission of pollutants per ton of qualified casting is more than ten times higher than that of developed countries. The Chinese government has set ambitious targets for carbon peaking and carbon neutrality, which forces foundries to explore cleaner production routes. In a typical sand casting foundry, the molding phase is responsible for a large fraction of total energy consumption, especially when mold making relies on manual or semi-automatic processes. With the introduction of additive manufacturing, the mold production paradigm is shifting. Sand 3D printing can directly fabricate complex molds without pattern equipment, reducing lead time and material waste. However, its energy consumption per unit of sand is relatively high, so its environmental performance depends strongly on the casting geometry and production volume.
2. Literature Review
Many studies have addressed the sustainability of casting operations. Some researchers developed multi-objective scheduling models to minimize both carbon emissions and noise in hybrid flow shops. Others focused on process design parameters to reduce emission sources in sand casting. For example, Zheng et al. proposed a low-carbon process design method based on design parameters, achieving a significant reduction in carbon emissions during the molding and pouring stages. Salonitis and colleagues introduced the CRIMSON process to reduce energy consumption in sand casting. More recently, the use of 3D sand printing has been extensively evaluated. Snelling et al. reported that the mechanical properties and hardness of castings produced with 3D-printed molds are comparable to those from conventional molds. Hodder et al. found that using traditional foundry sand in 3D printing can lead to lower flowability and thus lower casting quality. Hawaldar and Zhang compared sand casting via additive manufacturing and conventional methods, concluding that 3D printing saves about 67% of sand and 26% of metal for a pump housing, but the higher printing cost makes it less competitive for large batches. Sama et al. exploited the design freedom of 3D sand printing to develop unconventional gating systems, improving casting quality. Wang et al. proposed a design framework integrating 3D sand printing and topology optimization, reducing casting weight by 50% while increasing safety factor by 30%. Sivarupan et al. pointed out that 3D sand printing significantly reduces energy and metal consumption, thus lowering carbon emissions. Almaghariz et al. established economic feasibility criteria, showing that 3D sand printing is more advantageous for low-volume and complex castings. On the other hand, CNC sand milling has been studied for its high speed, good surface finish, and low cost. Some scholars examined the effect of process parameters on surface quality and tool wear. Composite molding approaches, which combine 3D printing, CNC milling, and traditional molding, have been proposed by Chen Ankai and later extended by Yao Jinkang for large complex castings, reducing carbon emissions by up to 13.27%.
Despite these contributions, most studies evaluate a single technology or a specific casting. There is a lack of a comprehensive method that can select the optimal molding process for different casting complexities. Moreover, the influence of casting structural features on carbon emissions has not been systematically modeled. The concept of complexity has been widely used in manufacturing cost estimation, but rarely connected to carbon emissions. Therefore, I propose a cast complexity model that integrates both structural parameters and production batch, and then establish a carbon emission prediction model for three typical molding processes in a sand casting foundry. Based on these models, I present a low-carbon molding process selection method that can guide foundries toward more sustainable production.
3. Process Description and Casting Complexity
3.1 Three Typical Molding Processes
In a sand casting foundry, the production cycle can be divided into three stages: molding (producing the sand mold and cores), pouring (melting, pouring, and solidification), and post-processing (shakeout, sand reclamation, fettling, and cleaning). The differences among molding processes are mainly concentrated in the molding stage. I analyze three typical processes:
- Traditional molding (TM): involves pattern making, sand filling, compaction, curing, pattern withdrawal, coating, core setting, and mold assembly. This process requires a physical pattern, and the mold geometry is limited by draft angles and core assembly requirements.
- Sand 3D printing molding (AM): uses a binder jetting technique. A layer of sand mixed with catalyst is spread, and a printhead selectively deposits binder, which reacts to bond the sand. The process is repeated layer by layer until the mold is complete. No pattern is required, and very complex internal channels can be formed.
- Composite molding (CM): combines traditional and 3D printing processes. In my implementation, the gating system is produced by traditional molding because it requires lower precision and is often standardized, while the mold parts that contact the casting surface are produced by 3D printing to achieve high dimensional accuracy.
In the pouring and post-processing stages, the three processes share similar equipment and material flows. However, the amount of sand used, the type and quantity of binder, and the energy consumed in mold production differ significantly.
3.2 Casting Complexity
I define casting complexity based on two dimensions: casting structural complexity and production batch. The structural complexity is represented by seven measurable factors: casting volume ($V_p$), core volume ($V_c$), casting surface area ($A_p$), minimum thickness ($T_{min}$), maximum thickness ($T_{max}$), draw depth ($D_d$), and number of cores ($N_c$). These factors influence the mold-making effort, sand consumption, core production, and pouring conditions. For example, a casting with a large surface area requires more sand and coating, while a thin minimum wall thickness may require careful pouring and higher quality molds. The number of cores directly affects core-making energy and material consumption. Production batch ($N$) is also critical because mold manufacturing is a batch process; the fixed cost of pattern production is amortized over the number of castings, and 3D printing does not require a pattern but has high per-unit energy consumption. Thus, the total carbon emission per casting is a function of both structure and batch.
4. Carbon Emission and Cost Modeling
4.1 Carbon Emission Sources
I classify carbon emissions in a sand casting foundry into three categories: material-related emissions, energy-related emissions, and undesired product-related emissions. Material emissions originate from the production and transportation of raw materials such as iron, steel, sand, binders, and coatings. Energy emissions come from the electricity, coke, and natural gas consumed during molding, melting, and post-processing. Undesired emissions are associated with waste sand, slag, and defective castings that require treatment or disposal. The total carbon emission over a production period can be expressed as:
$$ CE = CE_{material} + CE_{energy} + CE_{undesired} $$
For each stage, the emissions are computed by summing over materials, energy carriers, and wastes. Let $m_a$ be the mass of non-recyclable material $a$ with emission factor $f_a$; $m_b$ be the mass of recyclable material $b$ with recycling rate $\lambda_b$ and emission factor $f_b$; $E_c$ be the energy consumption of carrier $c$ with emission factor $f_c$; and $m_d$ be the mass of waste $d$ requiring energy $E_d^S$ per unit for treatment with emission factor $f_d$. Then:
$$ CE = \sum_a m_a f_a + \sum_b \lambda_b m_b f_b + \sum_c E_c f_c + \sum_d E_d^S m_d f_d $$
I apply this general model to the three molding processes. The molding stage emissions ($CE_M$) include pattern or binder jetting energy, sand preparation, core making, and mold assembly. The pouring stage ($CE_P$) includes melting, pouring, and cooling. The post-processing stage ($CE_{PP}$) includes shakeout, sand reclamation, shot blasting, and machining. Therefore, for each process $X$ (where $X \in \{TM, AM, CM\}$):
$$ CE^X = CE_M^X + CE_P^X + CE_{PP}^X $$
4.2 Cost Model
In addition to carbon emissions, I model the production cost per casting because economic sustainability is essential for foundries. The total cost $C$ is decomposed into material cost $C_{material}$, labor cost $C_{labor}$, energy cost $C_{energy}$, and overhead cost $C_{overheads}$:
$$ C = C_{material} + C_{labor} + C_{energy} + C_{overheads} $$
The overhead includes pattern manufacturing, equipment depreciation, and management. For 3D printing, the overhead is lower because no pattern is needed, but the material cost of the sand/binder system is higher. For traditional molding, the pattern cost is significant for small batches but becomes negligible for large batches.
5. Case Study Data and Carbon Calculation
To investigate the relationship between casting complexity and carbon emissions, I selected 40 case castings with a wide range of volumes, surface areas, core configurations, and thicknesses. Table 5.1 lists the structural features of these castings. I standardized the production batch at 50 pieces for the initial analysis. The equipment power ratings used in the calculations are provided in Table 5.2. I calculated the carbon emissions for each casting under the three molding processes using the formulas above. The results show that for small castings, the molding stage dominates, while for large castings, the pouring stage dominates. The cost results indicate that traditional molding is more expensive at low volumes, but its relative advantage improves with increasing volume.
| Casting ID | Volume (×10² cm³) | Core vol. (×10² cm³) | Surface area (×10² cm²) | Min thick. (cm) | Max thick. (cm) | Draw depth (cm) | No. cores |
|---|---|---|---|---|---|---|---|
| 1 | 10.00 | 0.00 | 6.00 | 10.00 | 10.00 | 5.00 | 0 |
| 2 | 14.57 | 0.00 | 43.33 | 9.10 | 53.80 | 15.25 | 0 |
| 3 | 53.16 | 0.00 | 24.11 | 3.60 | 25.00 | 16.80 | 0 |
| 4 | 7.23 | 0.00 | 7.10 | 0.50 | 26.00 | 3.15 | 0 |
| 5 | 88.80 | 0.00 | 40.88 | 6.00 | 40.00 | 10.00 | 0 |
| 6 | 78.28 | 6.21 | 30.82 | 3.20 | 24.00 | 12.00 | 1 |
| 7 | 8.04 | 2.02 | 7.18 | 2.50 | 10.00 | 5.00 | 1 |
| 8 | 4.84 | 0.61 | 6.53 | 1.20 | 13.50 | 4.50 | 1 |
| 9 | 52.27 | 8.95 | 29.62 | 3.20 | 19.20 | 12.00 | 1 |
| 10 | 7.47 | 0.65 | 8.12 | 1.40 | 10.70 | 8.50 | 1 |
| 11 | 144.33 | 10.32 | 69.58 | 3.45 | 59.00 | 10.00 | 1 |
| 12 | 105.51 | 11.83 | 48.14 | 3.20 | 42.00 | 13.50 | 1 |
| 13 | 84.30 | 2.45 | 57.30 | 1.30 | 42.00 | 5.00 | 1 |
| 14 | 66.51 | 3.31 | 40.97 | 4.00 | 33.20 | 20.00 | 1 |
| 15 | 221.12 | 11.48 | 91.06 | 2.00 | 15.20 | 8.60 | 2 |
| 16 | 14.00 | 7.12 | 14.80 | 1.60 | 32.80 | 4.40 | 1 |
| 17 | 6.08 | 1.91 | 9.82 | 1.20 | 14.00 | 6.00 | 1 |
| 18 | 28.15 | 11.79 | 21.07 | 1.60 | 16.80 | 9.50 | 2 |
| 19 | 102.49 | 18.16 | 88.89 | 2.00 | 64.10 | 10.10 | 1 |
| 20 | 24.41 | 8.58 | 18.40 | 3.10 | 29.00 | 5.60 | 2 |
| 21 | 145.50 | 73.04 | 96.71 | 1.50 | 48.10 | 12.70 | 1 |
| 22 | 54.85 | 41.24 | 43.78 | 2.00 | 50.80 | 9.20 | 1 |
| 23 | 5.77 | 3.77 | 9.34 | 0.70 | 10.00 | 6.40 | 1 |
| 24 | 69.95 | 76.43 | 57.15 | 1.50 | 30.00 | 14.60 | 1 |
| 25 | 10.90 | 5.82 | 11.14 | 3.00 | 12.00 | 5.00 | 2 |
| 26 | 6.30 | 5.45 | 13.16 | 1.10 | 29.60 | 5.60 | 1 |
| 27 | 1.49 | 1.26 | 3.51 | 0.40 | 2.40 | 5.60 | 1 |
| 28 | 4.12 | 3.90 | 9.79 | 2.60 | 24.70 | 5.50 | 1 |
| 29 | 21.92 | 7.27 | 18.18 | 1.20 | 29.00 | 13.00 | 3 |
| 30 | 59.56 | 65.55 | 64.41 | 2.50 | 14.50 | 14.50 | 1 |
| 31 | 4.30 | 3.65 | 7.29 | 1.00 | 11.60 | 5.35 | 1 |
| 32 | 2.16 | 1.62 | 3.51 | 1.00 | 11.20 | 3.75 | 2 |
| 33 | 63.61 | 100.40 | 71.97 | 2.20 | 27.00 | 13.50 | 1 |
| 34 | 10.62 | 8.13 | 20.63 | 0.80 | 10.70 | 11.25 | 2 |
| 35 | 9.55 | 25.30 | 26.45 | 0.50 | 5.00 | 5.63 | 1 |
| 36 | 4.06 | 4.45 | 11.38 | 0.70 | 13.10 | 2.15 | 1 |
| 37 | 6.99 | 10.37 | 19.84 | 0.30 | 17.80 | 6.00 | 1 |
| 38 | 2.99 | 3.09 | 10.68 | 0.30 | 13.50 | 5.50 | 3 |
| 39 | 14.32 | 39.70 | 36.34 | 1.00 | 21.50 | 9.75 | 2 |
| 40 | 26.56 | 19.12 | 44.78 | 0.80 | 28.40 | 7.75 | 6 |
| Equipment | Rated power (kW) |
|---|---|
| Sand mixer | 25 |
| Roller conveyor | 1.5 |
| Vibrating table | 3 |
| Rollover draw machine | 2.2 |
| Coating machine | 1.85 |
| Sand reclamation line | 152.05 |
| Core shooting machine | 8 |
| Drying furnace | 104.2 |
| 3D sand printer | 5 (maximum) |
| Medium frequency induction furnace | 2500 |
| Shot blasting machine | 38 |
From the preliminary calculations, I observed that the total carbon emissions of the 40 castings under the traditional process range from 12.39 to 737.90 kg CO₂. Because this range is very wide, I applied the k-means clustering algorithm to divide the castings into two groups: Group A (27 castings) with a cluster center of 64.17 kg CO₂, and Group B (13 castings) with a cluster center of 383.70 kg CO₂. Group A consists mainly of small and medium castings, while Group B contains larger castings with higher pouring emissions. For the 3D printing process and the composite process, the same grouping is used to maintain consistency.
6. Regression Models for Carbon Emission Prediction
6.1 Traditional Molding Process
I used multiple linear regression to correlate the carbon emissions of the traditional molding process with the structural factors. First, I tested all seven factors and found multicollinearity: surface area correlated with core volume, and draw depth correlated with volume. After removing these two insignificant factors, the final regression results for Group A and Group B at a batch of 50 are presented below. In Group A, the significant variables are volume, surface area, number of cores, and minimum thickness. The regression equation is:
$$ CE^{TM}_{A,50} = 5.701 + 3.689V_p + 0.157A_p + 0.631N_c – 0.011T_{min} $$
Here, $V_p$ is in ×10² cm³, $A_p$ in ×10² cm², and $T_{min}$ in cm. The coefficients are all statistically significant (p < 0.05). The VIF values are below 10, confirming no serious multicollinearity. The standardized coefficients show that volume has the greatest influence (beta = 0.977), followed by surface area (0.031), cores (0.013), and minimum thickness (0.000). Thus, casting volume is the dominant driver of carbon emissions in a sand casting foundry.
For Group B, only volume shows a significant effect:
$$ CE^{TM}_{B,50} = 74.190 + 3.042V_p $$
This indicates that for large castings, the pouring stage dominates and structural features other than volume have less impact.
6.2 Sand 3D Printing Process
For the sand 3D printing process, the regression results at a batch of 50 show that volume and surface area are the only significant factors in both groups. The equations are:
$$ CE^{AM}_{A,50} = -0.001 + 3.639V_p + 0.157A_p $$
$$ CE^{AM}_{B,50} = -0.068 + 3.639V_p + 0.158A_p $$
Since 3D printing does not require a pattern or cores, the number of cores and thickness have negligible effects on the molding stage. The energy consumption per unit volume of sand is nearly constant, so the emission is almost linearly related to the amount of sand used, which is proportional to the casting volume and surface area.
6.3 Composite Molding Process and the Specific Gravity Parameter
For the composite process, I define a specific gravity parameter $P$ as the mass fraction of sand in the non-gating mold part that is produced by 3D printing:
$$ P = \frac{m_{sand-AM}}{m_{sand-AM} + m_{sand-TM}} $$
where $m_{sand-AM}$ and $m_{sand-TM}$ are the masses of sand used in the 3D-printed and traditionally molded portions, respectively. When $P = 0\%$, the non-gating part is fully traditional; when $P = 100\%$, it is fully 3D-printed. In the composite approach, the gating system is always traditional, so even at $P = 100\%$, some sand is still produced conventionally.
I performed regression analysis for the composite process at $P$ values of 20%, 40%, 60%, 80%, and 100%, for batches of 50, 500, and 1000. The coefficients for volume and the constant term change with $P$. For Group A, the constant decreases linearly with $P$, while the volume coefficient increases slightly because more 3D printing adds energy. The general form for Group A at batch 50 is:
$$ CE^{CM}_{A,50}(P) = \alpha_A(P) + \beta_A(P) V_p + 0.157 A_p $$
where the fitted coefficients are:
$$ \alpha_A(P) = 4.832 – 0.0238 P $$
$$ \beta_A(P) = 3.823 + 0.0026 P $$
For Group B, only volume is significant, and the equations are:
$$ CE^{CM}_{B,50}(P) = \alpha_B(P) + \beta_B(P) V_p $$
with:
$$ \alpha_B(P) = 73.279 – 0.0189 P $$
$$ \beta_B(P) = 3.158 + 0.0031 P $$
These polynomial expressions allow a foundry to estimate the carbon emission for any intermediate $P$ value without recomputing the entire regression.
7. Influence of Production Batch
Production batch significantly affects the economics and emissions of traditional molding because the pattern cost and pattern-related energy are spread over a larger number of castings. For 3D printing, the per-casting emission is almost independent of batch since no pattern is required. I extended the regression analysis to batches of 500 and 1000 for traditional and composite processes. The results for the traditional process are summarized in Table 7.1.
| Batch | Group | Regression equation |
|---|---|---|
| 500 | A | $CE^{TM}_{A,500} = 5.575 + 3.341V_p + 0.157A_p + 0.621N_c – 0.011T_{min}$ |
| 500 | B | $CE^{TM}_{B,500} = 49.024 + 2.932V_p$ |
| 1000 | A | $CE^{TM}_{A,1000} = 5.568 + 3.146V_p + 0.157A_p + 0.620N_c$ |
| 1000 | B | $CE^{TM}_{B,1000} = 31.898 + 2.897V_p$ |
As batch increases, the intercept decreases and the volume coefficient decreases slightly, indicating that the fixed portion of emissions (pattern making, mold setup) is amortized. For Group A, the minimum thickness becomes insignificant at batch 1000, likely because the molding-stage emission share drops relative to the pouring stage.
For the composite process, I also built equations for batches 500 and 1000. The coefficients follow similar trends. For example, in Group A at batch 500:
$$ CE^{CM}_{A,500}(P) = (4.192 – 0.0222P) + (3.473 + 0.0026P)V_p + 0.157A_p $$
At batch 1000:
$$ CE^{CM}_{A,1000}(P) = (4.138 – 0.0249P) + (3.277 + 0.0026P)V_p + 0.157A_p $$
These equations enable a direct comparison of different molding processes under the same casting complexity and production batch.
8. Low-Carbon Molding Process Selection Method
Based on the regression models, I can compare the predicted carbon emissions of the three processes for a given casting structure and batch. The process with the lowest predicted emission is recommended. In addition, the cost model provides the corresponding production cost, allowing the foundry to make a balanced decision. The selection procedure is as follows:
- Determine casting structural parameters ($V_p$, $A_p$, $N_c$, $T_{min}$, $T_{max}$, etc.).
- Set the production batch $N$.
- Compute the predicted emissions using the appropriate regression equations for TM, AM, and CM (with the chosen $P$ value).
- Solve the inequalities $CE^{TM} \lessgtr CE^{AM}$ to identify the boundary between traditional and 3D printing processes.
- If composite molding is considered, optimize the $P$ value to minimize $CE^{CM}$.
- Also calculate the costs using the cost model.
- Choose the process that achieves the lowest combined carbon and cost objective, or adopt a weighted decision depending on the foundry’s priorities.
For a batch of 50, the comparison between traditional and 3D printing yields the following boundary conditions. In Group A (small/medium castings), the 3D printing process is always lower in carbon than traditional, because the coefficient for $V_p$ is similar but the intercept of AM is much smaller. In Group B, the critical volume is found by equating $CE^{TM}_{B,50}$ and $CE^{AM}_{B,50}$:
$$ 74.190 + 3.042V_p = -0.068 + 3.639V_p + 0.158A_p $$
After rearranging, 3D printing is preferred when:
$$ V_p < (124.385 – 0.265A_p) \times 10^2 \text{ cm}^3 $$
Thus, for large castings with very large volume or surface area, traditional molding becomes more carbon-efficient.
For a batch of 500, the boundary for Group A is:
$$ CE^{TM}_{A,500} = 5.575 + 3.341V_p + 0.157A_p + 0.621N_c – 0.011T_{min} $$
$$ CE^{AM}_{A,500} = -0.001 + 3.639V_p + 0.157A_p $$
Ignoring the small $T_{min}$ effect, the condition $CE^{TM} > CE^{AM}$ becomes:
$$ V_p < (2.084N_c + 18.711) \times 10^2 \text{ cm}^3 $$
For Group B at batch 500:
$$ 49.024 + 2.932V_p = -0.068 + 3.639V_p + 0.158A_p $$
Solving for a typical surface area, we find that traditional molding is almost always preferred for Group B castings at batch 500. In other words, for large castings in medium-volume production, the high per-unit energy of 3D printing makes it less competitive.
For a batch of 1000, the boundary shifts further toward traditional molding. The calculated threshold is:
$$ V_p < (1.258N_c + 11.296) \times 10^2 \text{ cm}^3 $$
This demonstrates that as production volume increases, the traditional molding process becomes increasingly favorable in terms of carbon emissions. The same trends apply to the cost model, where the pattern cost is amortized over a larger batch.
9. Case Study: Furnace Cover Casting
To validate the proposed method, I selected a furnace cover casting made of gray cast iron HT250. The casting has a volume of 843.02 cm³ (i.e., $8.4302 \times 10^2$ cm³), a maximum dimension of 142.5 mm × 142.5 mm × 60.5 mm, a maximum wall thickness of 35 mm, and an average wall thickness of 11.42 mm. The production batch is 500 pieces. The casting has no cores, so $N_c = 0$. The surface area is not explicitly given; I estimated it from the geometry as approximately 714 cm² (i.e., $7.14 \times 10^2$ cm²).
Using the regression models for batch 500, I predict the carbon emissions of the three processes as follows.
| Process | Predicted CE (kg CO₂) | Actual CE (kg CO₂) | Predicted cost (CNY) | Actual cost (CNY) |
|---|---|---|---|---|
| Traditional (TM) | 39.80 | 39.81 | 119.20 | 119.18 |
| 3D printing (AM) | 34.45 | 34.45 | 86.35 | 86.35 |
| Composite (CM, P=100%) | 36.52 | 36.54 | 88.17 | 88.17 |
For the composite process, I optimized the specific gravity $P$ using the fitted polynomial for Group A at batch 500. The emission equation is:
$$ CE^{CM}_{A,500}(P) = (4.192 – 0.0222P) + (3.473 + 0.0026P)V_p + 0.157A_p $$
Differentiating with respect to $P$ and setting to zero gives $P = 80.20\%$. At this optimal $P$, the predicted emission is 36.35 kg CO₂ and the cost is 87.13 CNY. However, this is still higher than the fully 3D-printed process (34.45 kg CO₂). Therefore, the recommended process for this casting is sand 3D printing.
I also simulated the pouring process using ProCAST to verify that the castings produced with the compared molding processes are free of significant defects. The simulations showed that any shrinkage porosity is confined to the riser, while the casting itself remains sound. This confirms that the furnace cover can be successfully produced with all three molding processes, so the carbon and cost comparison is valid.
10. Discussion
The case study demonstrates that the proposed carbon emission models are accurate enough for engineering decision-making. The predicted values match the actual computed values within less than 0.1% deviation. For the furnace cover, the 3D printing process achieves a 15.56% carbon reduction compared to traditional molding (5.36 kg CO₂) and a 6.04% reduction compared to composite molding. The cost reduction is even more substantial: 38.02% compared to traditional molding and 2.11% compared to composite molding. This result is consistent with the general principle that 3D printing is advantageous for small-batch, small-to-medium, complex castings.
However, the superiority of 3D printing is not universal. For large castings with volumes above roughly $1.2 \times 10^4$ cm³, traditional molding tends to have lower carbon emissions due to the high energy consumption of the 3D printing process. For very large batches, traditional molding also becomes more cost-effective. The developed selection method provides clear thresholds based on volume, surface area, number of cores, and batch size. By using these thresholds, a sand casting foundry can quickly identify the best molding process without conducting a full life-cycle assessment for every new casting.
The composite molding process offers flexibility by allowing a fraction of the mold to be produced by 3D printing and the rest by traditional methods. The optimal $P$ value depends on the casting structure and batch. In the furnace cover example, the optimum was about 80%, but the fully 3D-printed mold was even better because the casting is relatively small and the batch is moderate. For larger castings, a lower $P$ value might be optimal, allowing the foundry to reduce energy consumption while still benefiting from the geometric freedom of 3D printing in complex regions.
One limitation of my study is that the regression models were built using data from 40 case castings, which may not fully represent all possible casting geometries. In addition, the cost model relies on local labor rates and electricity prices, so the absolute cost values may vary across different regions. Nevertheless, the methodology is general and can be recalibrated with local data. Another limitation is that the emissions from the pattern material (e.g., wood or metal) are not explicitly included in the regression because they are part of the overhead; for very small batches, the pattern production emissions could be significant. In practice, foundries should include these fixed emissions when comparing processes for small batches.
11. Conclusion
In this research, I have developed a systematic framework for selecting low-carbon molding processes in a sand casting foundry based on casting complexity. The main contributions are as follows:
- I analyzed the process characteristics of traditional molding, sand 3D printing, and composite molding, and proposed a casting complexity model consisting of structural parameters and production batch.
- I constructed stage-specific carbon emission models for the three molding processes, covering molding, pouring, and post-processing stages, with material, energy, and undesired emissions.
- Using 40 case castings and multiple linear regression, I established quantitative relationships between casting complexity and carbon emissions for each molding process. The models show that casting volume is the most influential factor.
- I introduced the specific gravity parameter $P$ to quantify the fraction of 3D printing in composite molding, and derived polynomial equations to predict emissions for any $P$ value.
- I proposed a low-carbon molding selection method based on the regression models and cost model, and validated it with a furnace cover casting. The predicted emissions and costs matched the detailed calculations well.
- The results confirm that 3D printing is the most low-carbon and cost-effective option for small-to-medium castings at low-to-moderate batches, while traditional molding becomes more favorable for large castings and larger batches.
Future work should extend the dataset to include larger castings and more complex core assemblies, incorporate other sustainability indicators such as water consumption and waste toxicity, and develop a user-friendly software tool for foundry engineers to apply this method in real time. Additionally, the effect of gating system design on emissions could be explored, since 3D printing allows optimized gating that may further reduce metal waste and defects.
Ultimately, this study provides a practical and scientific basis for a sand casting foundry to reduce its carbon footprint while maintaining economic competitiveness. By considering casting complexity from the early design stage, foundries can make informed decisions that align with global low-carbon manufacturing targets.