
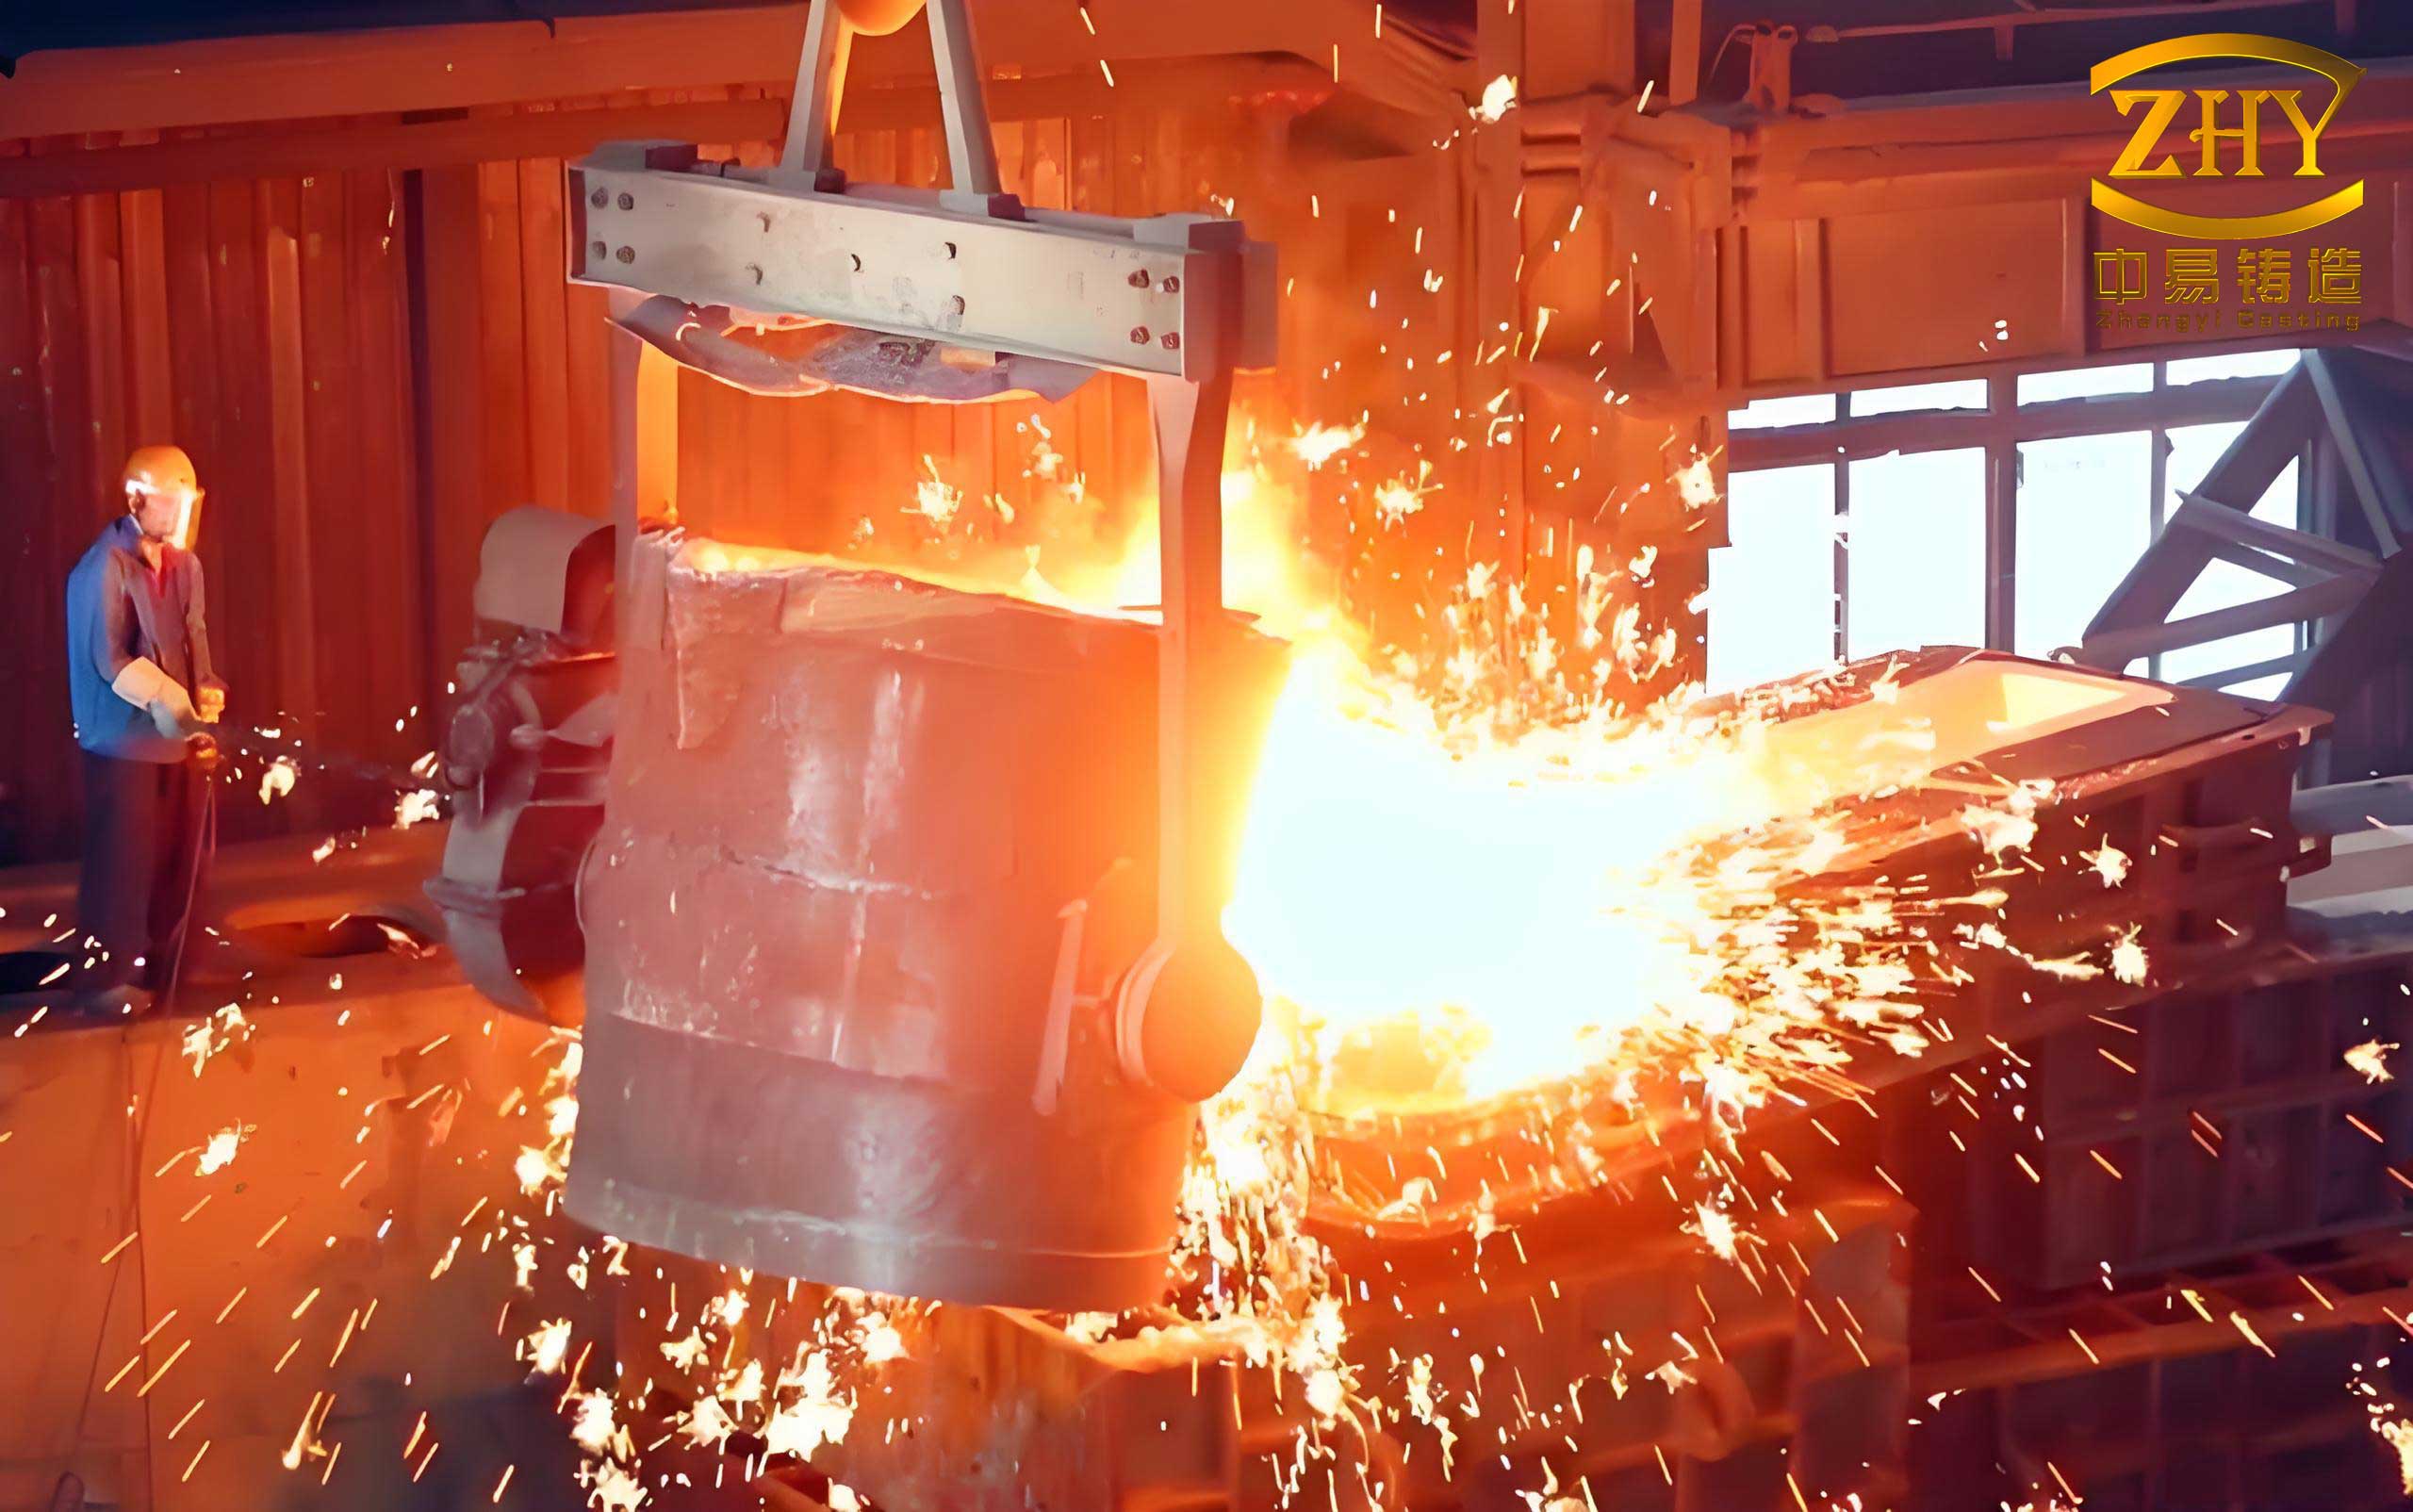
The surface quality of a casting part is a critical determinant of its performance, longevity, and reliability in service. Among various quality metrics, surface roughness stands out as a paramount characteristic, directly influencing functional attributes such as wear resistance, fatigue strength, corrosion behavior, and the efficiency of subsequent finishing operations. In the domain of sand casting, typical surface roughness values range from approximately Ra 3.2 μm to Ra 50 μm. Accurate and consistent measurement of this parameter is therefore essential for quality control and process optimization in foundries.
Traditional methods for assessing the roughness of casting part surfaces present significant practical challenges. The widely used tactile method, involving stylus profilometers, offers high precision but is inherently a contact technique. Its measurement range is often limited compared to the roughness scales of sand castings, and its physical probe can be damaged by or potentially damage the rough surface. More critically, its use is often impractical on large, complex, or curved geometries common in casting part production. The alternative, visual comparison against physical standard roughness comparator plates, is highly subjective, relying on the inspector’s experience and perception, leading to inconsistent and non-reproducible results. This subjectivity hinders standardized quality documentation and automated process feedback.
This gap in measurement technology creates a pressing need for a rapid, accurate, objective, and non-contact system capable of evaluating the surface roughness of casting part directly on the production floor. Machine vision, powered by advanced image processing and deep learning, emerges as a compelling solution. The core premise is that the visual texture of a surface, captured in a digital image, contains rich information that correlates strongly with its topographic roughness. By extracting and learning these intricate features, a computational model can be trained to predict surface roughness from a simple image, transforming subjective visual inspection into an objective quantitative measurement.
This article details the research and development of a complete machine vision-based system for the non-contact roughness assessment of sand-cast components. The methodology integrates a tailored image acquisition module, a robust image preprocessing pipeline, a sophisticated deep convolutional neural network (CNN) architecture, and dedicated software into a cohesive workflow. The system is trained and validated using standard roughness specimens and ultimately deployed to measure real-world casting part with high accuracy and speed.
1. Methodology and System Framework
The overarching goal is to establish a mapping function \( F \) between a two-dimensional image \( I \) of a casting part surface and its corresponding surface roughness value \( R_a \). This can be formally expressed as:
$$ R_a = F(I; \theta) $$
where \( \theta \) represents the parameters of the mapping model learned during training. The technical roadmap to achieve this is structured into four consecutive phases, as illustrated in the workflow below.
- Dataset Creation: Acquisition and preparation of a high-quality image dataset from standardized roughness specimens.
- Model Development: Design, training, and optimization of a deep learning model to perform the classification or regression task.
- System Integration: Development of application software that orchestrates image capture, preprocessing, and model inference.
- Validation & Testing: Quantitative evaluation of the system’s performance on both standard specimens and real casting part.
2. Dataset Preparation: Foundation for Learning
2.1 Image Acquisition System Design
The first step towards a reliable vision system is the consistent capture of surface images. Variability in lighting, focus, and perspective can introduce noise that confounds the learning algorithm. To mitigate this, a dedicated image acquisition module was engineered. The core component is a CMOS-based macro camera module (DYVCAM-W20246 V22) with a resolution of 640×480 pixels, chosen for its ability to capture fine surface details at close range.
A critical aspect for highlighting the texture of a casting part surface is illumination. A single-sided, low-angle lighting setup was employed. This grazing light accentuates peaks and valleys by casting distinct shadows, thereby dramatically enhancing the contrast of surface texture features critical for roughness discrimination. To ensure environmental consistency, a custom 3D-printed enclosure was fabricated from black resin. This housing securely positions the camera and integrated LED light source, shielding the imaging area from ambient light fluctuations and providing a stable, reproducible imaging environment. The module connects via USB for seamless data transfer. The specifications of the acquisition setup are summarized below.
| Component | Specification / Description |
|---|---|
| Image Sensor | CMOS, Global Shutter |
| Output Resolution | 640 x 480 pixels |
| Lens Type | Fixed-focus Macro Lens |
| Lighting | Integrated White LED, Single-side Low-angle |
| Housing | Custom 3D-printed Black Enclosure |
| Interface | USB 2.0 |
2.2 Specimens and Data Collection
To train a supervised model, ground truth data is essential. Standardized casting surface roughness comparator plates, conforming to international standards (e.g., GB6060.1), provide this reference. These plates have precise, known Ra values. For this study, images were captured from two distinct types of standard plates to improve model generality: “Iron-Sand Cast” type and “Aluminum-Zinc-Magnesium Permanent Mold” type. Five roughness grades common in sand casting were targeted: Ra 3.2, 6.3, 12.5, 25, and 50 μm. Multiple images were taken from different locations on each specimen grade to capture natural variability, resulting in an initial collection of several thousand images.
2.3 Image Preprocessing Pipeline
Raw captured images require conditioning to improve their suitability for neural network training. The preprocessing pipeline consists of sequential operations designed to normalize the input data and accentuate texture-related features while suppressing irrelevant information.
1. Cropping: Due to the macro lens characteristics, the image edges can be slightly blurred. A central region of 480×480 pixels is cropped to ensure uniform sharpness across the input.
2. Grayscale Conversion: For surface texture analysis, color information is largely redundant. Converting the RGB image to a single-channel grayscale image reduces computational complexity and focuses the model on luminance patterns. The standard luminance formula is applied:
$$ I_{\text{gray}}(i,j) = 0.299 \cdot R(i,j) + 0.587 \cdot G(i,j) + 0.114 \cdot B(i,j) $$
where \( (i, j) \) denotes pixel coordinates.
3. Contrast Enhancement via CLAHE: The low-angle lighting can create non-uniform brightness across the image. Standard Histogram Equalization (HE) would amplify this artifact. Instead, Contrast Limited Adaptive Histogram Equalization (CLAHE) is used. CLAHE operates on small, contextual regions (tiles) within the image, enhancing local contrast while limiting the amplification of noise. This effectively normalizes brightness and brings out subtle texture details across the entire casting part surface image. The key parameters include a clip limit (e.g., 2.0) and tile grid size (e.g., 8×8).
4. Noise Reduction via Median Filtering: To suppress potential salt-and-pepper noise from the sensor or environment, a non-linear median filter is applied. A 7×7 kernel size effectively removes noise specks while preserving the sharp edges of texture features, which is crucial for accurate roughness characterization.
The transformative effect of this pipeline is significant. The processed images exhibit uniform contrast, enhanced texture clarity, and minimal noise, providing an optimal input for feature learning.
2.4 Data Augmentation and Dataset Splitting
To increase the diversity of the training data and improve model robustness, data augmentation techniques are applied. A simple yet effective horizontal flipping strategy is used, effectively doubling the dataset size. The final dataset is meticulously partitioned to ensure rigorous evaluation:
- Training Set: Used to iteratively update the model’s weights.
- Validation Set: Used during training to monitor performance and prevent overfitting (guides hyperparameter tuning like early stopping).
- Test Set: Used only once, after final model selection, to provide an unbiased estimate of generalization performance.
The dataset composition is detailed in the following table, showing a balanced distribution across roughness classes and specimen types.
| Roughness Grade (Ra, μm) | Iron-Sand Train/Val/Test | Al-Zn-Mg Train/Val/Test | Total Images (per grade) |
|---|---|---|---|
| 3.2 | 484 / 104 / 100 | 484 / 104 / 100 | 1,276 |
| 6.3 | 492 / 104 / 100 | 516 / 104 / 100 | 1,316 |
| 12.5 | 484 / 104 / 100 | 484 / 104 / 100 | 1,276 |
| 25 | 492 / 104 / 100 | 484 / 104 / 100 | 1,280 |
| 50 | 504 / 104 / 100 | 492 / 104 / 100 | 1,300 |
| Total | 2,456 / 520 / 500 | 2,460 / 520 / 500 | 6,956 |
3. Neural Network Architecture: SE-ResNet-50
Convolutional Neural Networks (CNNs) are the state-of-the-art for image recognition tasks due to their ability to automatically learn hierarchical spatial features. For this application, a deep network capable of discerning subtle textural differences between roughness grades is required. The ResNet-50 architecture is chosen as a robust backbone.
3.1 Core Concept: Residual Learning
Training very deep networks is notoriously difficult due to issues like vanishing gradients. ResNet introduces a “skip connection” or “identity shortcut” that allows the network to learn residual functions with reference to the layer inputs, instead of learning unreferenced functions. This is formulated for a building block as:
$$ \mathbf{y} = \mathcal{F}(\mathbf{x}, \{W_i\}) + \mathbf{x} $$
where \( \mathbf{x} \) and \( \mathbf{y} \) are the input and output vectors of the block, and \( \mathcal{F}(\mathbf{x}, \{W_i\}) \) represents the residual mapping to be learned (e.g., a stack of convolution, batch norm, and ReLU layers). This simple reformulation significantly eases the training of networks with tens or hundreds of layers.
3.2 Integration of Attention Mechanism (SE Block)
Not all feature channels extracted by the CNN are equally important for the final decision. The Squeeze-and-Excitation (SE) block is a lightweight attention mechanism that dynamically recalibrates channel-wise feature responses. It is inserted into the residual block to form an SE-ResNet module. The SE block operates in two steps:
- Squeeze: Global spatial information is squeezed into a channel descriptor using Global Average Pooling (GAP). For a feature map \( \mathbf{U} \) with channels \( C \), it produces a vector \( \mathbf{z} \in \mathbb{R}^C \) where the \( c \)-th element is:
$$ z_c = \frac{1}{H \times W} \sum_{i=1}^{H} \sum_{j=1}^{W} u_c(i, j) $$ - Excitation: A simple gating mechanism with a sigmoid activation is used to capture channel-wise dependencies and produce a modulation vector \( \mathbf{s} \):
$$ \mathbf{s} = \sigma(\mathbf{W}_2 \delta(\mathbf{W}_1 \mathbf{z})) $$
where \( \mathbf{W}_1 \in \mathbb{R}^{\frac{C}{r} \times C} \) and \( \mathbf{W}_2 \in \mathbb{R}^{C \times \frac{C}{r}} \) are learnable weights, \( \delta \) is the ReLU function, \( \sigma \) is the sigmoid function, and \( r \) is a reduction ratio (e.g., 16) for computational efficiency. The final output of the block is obtained by rescaling the original features: \( \tilde{\mathbf{x}}_c = s_c \cdot \mathbf{u}_c \).
This mechanism allows the network to selectively emphasize informative features relevant to casting part roughness and suppress less useful ones, leading to more powerful representations with minimal computational overhead.
3.3 Network Training Configuration
The SE-ResNet-50 model is trained as a 5-class classifier. The training configuration is critical for convergence and performance.
| Hyperparameter / Component | Setting / Choice |
|---|---|
| Optimizer | Adam (Adaptive Moment Estimation) |
| Loss Function | Cross-Entropy Loss |
| Initial Learning Rate | 0.1 |
| Learning Rate Schedule | Reduce on Plateau (patience=20) |
| Batch Size | 64 |
| Maximum Epochs | 2000 |
| Early Stopping Patience | 200 epochs on validation accuracy |
| Hardware | GPU (NVIDIA RTX 3060) |
The training process was monitored using the validation accuracy for both specimen types. The model converged stably, and training was halted using early stopping to prevent overfitting. The final model was selected at the epoch where validation accuracy peaked.
4. Experimental Results and Analysis
4.1 Performance on Standard Specimens
The trained SE-ResNet-50 model was evaluated on the held-out test sets from both standard specimen types. Performance is summarized using confusion matrices and overall accuracy.
The model achieved exceptional classification accuracy on the standard specimens, demonstrating its strong capability to learn discriminative texture features associated with each roughness grade. The slight variation in performance between the two specimen types is expected due to intrinsic textural differences between sand-cast and permanent mold surfaces, yet the model handles both very effectively. This high accuracy on standardized data validates the core concept and provides a strong foundation for testing on real casting part.
| Test Set (Specimen Type) | Overall Classification Accuracy | Key Observation |
|---|---|---|
| Iron-Sand Cast Type | 99.00% | Near-perfect discrimination between all five Ra classes. |
| Al-Zn-Mg Permanent Mold Type | 99.60% | Marginally higher accuracy, indicating robust feature learning. |
4.2 Development of Detection Software
To transition from a research model to a usable tool, a dedicated desktop application was developed. The software integrates all system components:
- Live Camera Feed: Interfaces with the USB imaging module for real-time preview.
- Preprocessing Pipeline: Applies the identical crop, grayscale, CLAHE, and filtering operations in real-time.
- Model Inference Engine: Loads the trained SE-ResNet-50 model and performs forward propagation on the preprocessed image.
- Result Display: Presents the predicted roughness grade (Ra value) clearly to the user.
This integrated software provides a seamless “point-and-measure” interface for quality inspectors, requiring no expertise in machine learning or image processing.
4.3 Validation on Real Casting Parts
The ultimate test of the system’s utility is its performance on actual production casting part. Two distinct castings were selected: a stainless steel pump housing (generally smoother) and an aluminum alloy volute (generally rougher). On each casting part, 16 distinct locations were marked for measurement.
Each location was assessed by two methods:
1. Traditional Method: Visual and tactile comparison by an experienced inspector using standard comparator plates (considered the baseline).
2. Proposed Vision System: The developed software and camera module were used to capture an image and instantly output a prediction.
The results from 32 total measurement points are summarized below. The system’s prediction matched the inspector’s assessment in 28 out of 32 cases, yielding an overall accuracy of 87.5% on real, variable casting part surfaces. The average inference time per measurement, including image capture and processing, was approximately 0.086 seconds, highlighting the system’s speed.
| Casting Part | Typical Roughness Range | Measurement Points | Agreement with Inspector | Accuracy per Part |
|---|---|---|---|---|
| Stainless Steel Pump Housing | Ra 3.2 – 12.5 μm | 16 | 14 / 16 | 87.5% |
| Aluminum Alloy Volute | Ra 12.5 – 50 μm | 16 | 14 / 16 | 87.5% |
| Combined Total | Ra 3.2 – 50 μm | 32 | 28 / 32 | 87.5% |
Error Analysis: The four discrepant cases provide valuable insight. Most occurred at the boundary between two roughness classes (e.g., a point judged as Ra 6.3 by touch but predicted as Ra 12.5 by vision, or vice-versa). This can be attributed to several factors inherent to real casting part surfaces that differ from ideal standards:
1. Localized Texture Variation: A small image patch might not be perfectly representative of the average roughness over the standard evaluation length.
2. Complex Geometry: Curved surfaces can affect lighting and shadow formation slightly differently than the flat standards.
3. Inherent Subjectivity of the Baseline: The tactile/visual method itself has an associated human error, especially near class boundaries.
Despite these minor discrepancies, the 87.5% agreement is highly promising for an initial industrial deployment. The system provides a fast, objective, and digital record of surface condition, which is a substantial advancement over purely subjective methods.
5. Conclusion and Outlook
This research successfully demonstrates a complete, machine vision-based system for the non-contact assessment of surface roughness on sand-cast components. The core innovation lies in the integration of a tailored image acquisition setup, a robust preprocessing pipeline, and a powerful SE-ResNet-50 deep learning model into a practical software application.
The system addresses the critical limitations of traditional measurement methods for casting part inspection. It eliminates subjectivity, enables rapid measurement (sub-0.1 seconds), operates without physical contact, and is adaptable to complex part geometries. Validation on real castings confirmed its practical viability, achieving 87.5% alignment with expert inspection while providing digital consistency and traceability.
Future work will focus on enhancing the system’s robustness and scope:
1. Expanded Dataset: Incorporating images from a wider variety of casting part materials, surface conditions (e.g., as-cast, shot-blasted), and geometries to improve generalizability.
2. Regression Model: Developing a model that predicts a continuous Ra value rather than a discrete class, providing finer granularity.
3. Multi-Parameter Assessment: Extending the framework to simultaneously evaluate other surface defects like porosity, inclusions, or cold shuts from the same image.
4. Embedded System Deployment: Porting the optimized model to an industrial embedded vision system or smart camera for direct integration into production or finishing lines.
In conclusion, this machine vision approach presents a significant step towards automated, intelligent quality control in foundries. By providing a fast, objective, and quantitative measure of casting part surface roughness, it has the potential to improve process control, reduce scrap, and ensure higher consistency in final product quality.