
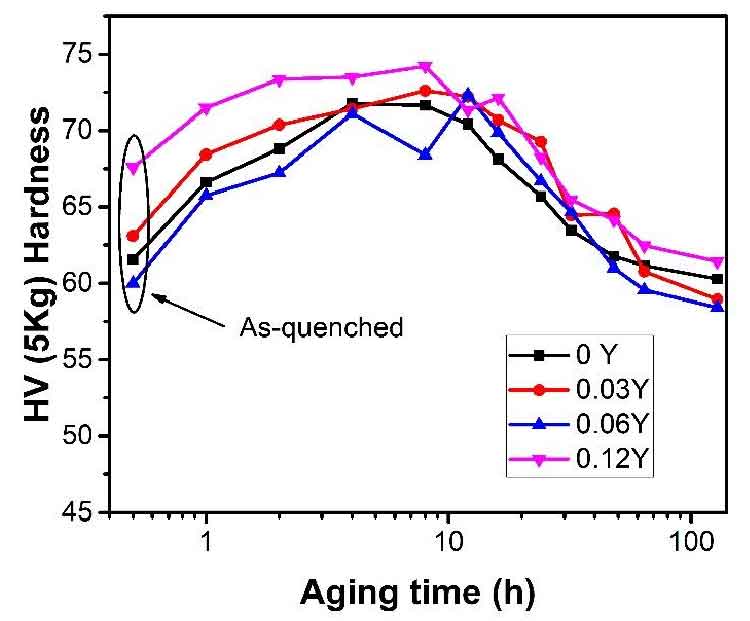
Figure 1 shows the aging hardening curve of Mg – 0.43nd – XY – 0.08zn – 0.11zr alloy at 200 ℃. With the increase of Y content from 0 to 0.12%, the peak hardness increases slowly from 71 hv to 74 HV. The addition of Y prolongs the time for the alloy to reach the peak hardness: About 6h for mg-0.43nd-0.08zn-0.11zr alloy and 8h or 12h for Y-containing alloy. However, the decreasing trend of hardness of Y-containing and non-y-containing alloys is the same after over aging.

Figure 2 shows the microstructure of T6 mg – 0.43nd – XY – 0.08zn – 0.11zr alloy. With the increase of Y content from 0 to 0.12%, the grain size decreases from 71 μ m to 57 μ M. In the mg-0.43nd-0.08zn-0.11zr alloy structure, some black precipitates can be seen, and most of the Zr containing particles are located in the interior of α – Mg grains (compared with FIG. 6-9A and Fig. 6-4a). With the increase of Y content, the amount of black precipitates increases. In mg – 0.43nd – 0.12y – 0.08zn – 0.11zr alloy, it can be observed that some Zr containing particles are located in the interior of α – Mg grains, some in the grain boundary, and the number of black precipitates increases significantly (compared with FIG. 2D and Fig. 2D).

(a) SEM image; (b) TEM image.
SEM images (Fig. 3a, white long rod) and TEM images (Fig. 3b, black long rod) show that these black precipitates are rod-shaped precipitates with width of several microns and length of about 200 nm, and they are distributed in a network. In addition, these rod like precipitates are zn2zr3 phase with tetragonal lattice structure (a = 0.768 nm, C = 0.699 nm, space group p42 / MNM). There is no zn2zr3 phase in the as cast alloy, and the amount of this phase increases after T6 treatment, which indicates that the formation of zn2zr3 phase is partly due to the reaction between Zr particles and Zn atoms during solution treatment, and partly due to the reaction between undissolved Zr particles and biased Zn atoms during aging.

Figure 4 shows the HRTEM diagram of solute segregation in T6 mg – 0.43nd – 0.12y – 0.08zn – 0.11zr alloy. The segregation of solute atoms observed in HRTEM was also observed by apt in related reports. These segregation atoms react to form nd rich and Zn rich phases. In addition, the sharp increase of zn2zr3 in the alloy further indicates that there is atomic segregation in the alloy. The aging precipitation sequence of mg-3nd-0.2zn alloy is supersaturated solid solution (SSSS) → atomic segregation → g. P. (I, II, III) → β′ → β 2 → β 1 / γ → β. The precipitation sequence of the alloy before the peak aging is as follows: solute atom segregation → β″ → β′ → β 1 / γ. It is well known that the alloy is prone to atomic segregation during aging. After adding y element, the more serious the segregation phenomenon is, the more obvious the aging strengthening effect is. Therefore, the properties of mg-nd-y-zn alloys are higher than those of Mg nd Zn alloys. In addition, the γ – rich Zn phase precipitates only in the alloy with Zn content higher than 0.5 wt.%, and the precipitation of γ – phase will inhibit the precipitation of β – series phase which plays a major role in strengthening. The results show that the content of Zn in the studied alloy is about 0.2 wt.%, there is no γ Series in T6 state alloy which can inhibit the non basal slip dislocation, and the β series precipitated on the cylindrical surface is the main strengthening phase of the alloy. Therefore, the hardness improvement of the alloy (T4 alloy hardness increased by 6 HV, T6 alloy hardness increased by 3 HV) is less than that of the alloy (T4 alloy hardness increased by 15 HV, T6 alloy hardness increased by 7 HV), but the mechanical properties of Mg – 0.43nd – 0.12y – 0.08zn – 0.11zr alloy (Fig. 5) are higher than those previously reported Mg – 0.49nd – 0.06y – 0.24zn – 0.11zr (at.%) alloy.
