
In sand casting foundry production, process parameters significantly influence casting quality, while the three-dimensional geometry of the product also plays a critical role in final forming quality. However, due to limited digitization in foundries, the analysis of defect causation often lacks the consideration of three-dimensional morphology. Moreover, unstructured data such as 3D CAD models of castings are difficult to quantify and incorporate into data-driven quality analysis. Consequently, current data-driven approaches in sand casting foundry rarely include morphological analysis, making it challenging to understand why defects occur at complex geometrical features. Fully exploring morphological features could help establish the relationship between casting shape and forming quality, ultimately improving product quality.
In this work, we focus on typical complex castings from a sand casting foundry, including steering axles, rotary frames, and axle housings. These components exhibit intricate geometries and vary significantly across different models. We aim to predict casting defects such as cold shuts, gas porosity, sand inclusions, and shrinkage cavities, which are common in sand casting foundry operations. To address the difficulty of characterizing complex 3D structures and the unknown relationship between morphology and casting quality, we propose a multi-source heterogeneous data-driven framework. We first collect structured process parameters from sand mixing, molding, melting, and pouring stages, together with the product’s three-dimensional models. Then, we develop a deep convolutional autoencoder to extract latent features from the voxelized 3D geometries. Finally, we construct a hybrid quality prediction model that integrates both process parameters and 3D shape features to accurately forecast casting defects.
1. Sand Casting Process Analysis and Data Collection
1.1 Sand Casting Process in a Typical Foundry
Sand casting remains a dominant manufacturing process in global industry, accounting for about 70% of all castings. It offers flexibility, low cost, and can produce parts ranging from small components to over 300 tons. In the sand casting foundry we studied, the production line employs a KW static pressure molding machine. The key process steps are as follows:
- Sand mixing: Green sand is prepared by mixing coal dust, bentonite, fine powder, new sand, and reclaimed used sand. Batch properties such as moisture content, compactibility, permeability, and green compressive strength are tested.
- Molding: The prepared sand is fed into the molding machine, where it is compacted by airflow pre-compaction and hydraulic pressing to form complex mold cavities.
- Core making: Sand cores are produced according to the internal cavity design of each casting.
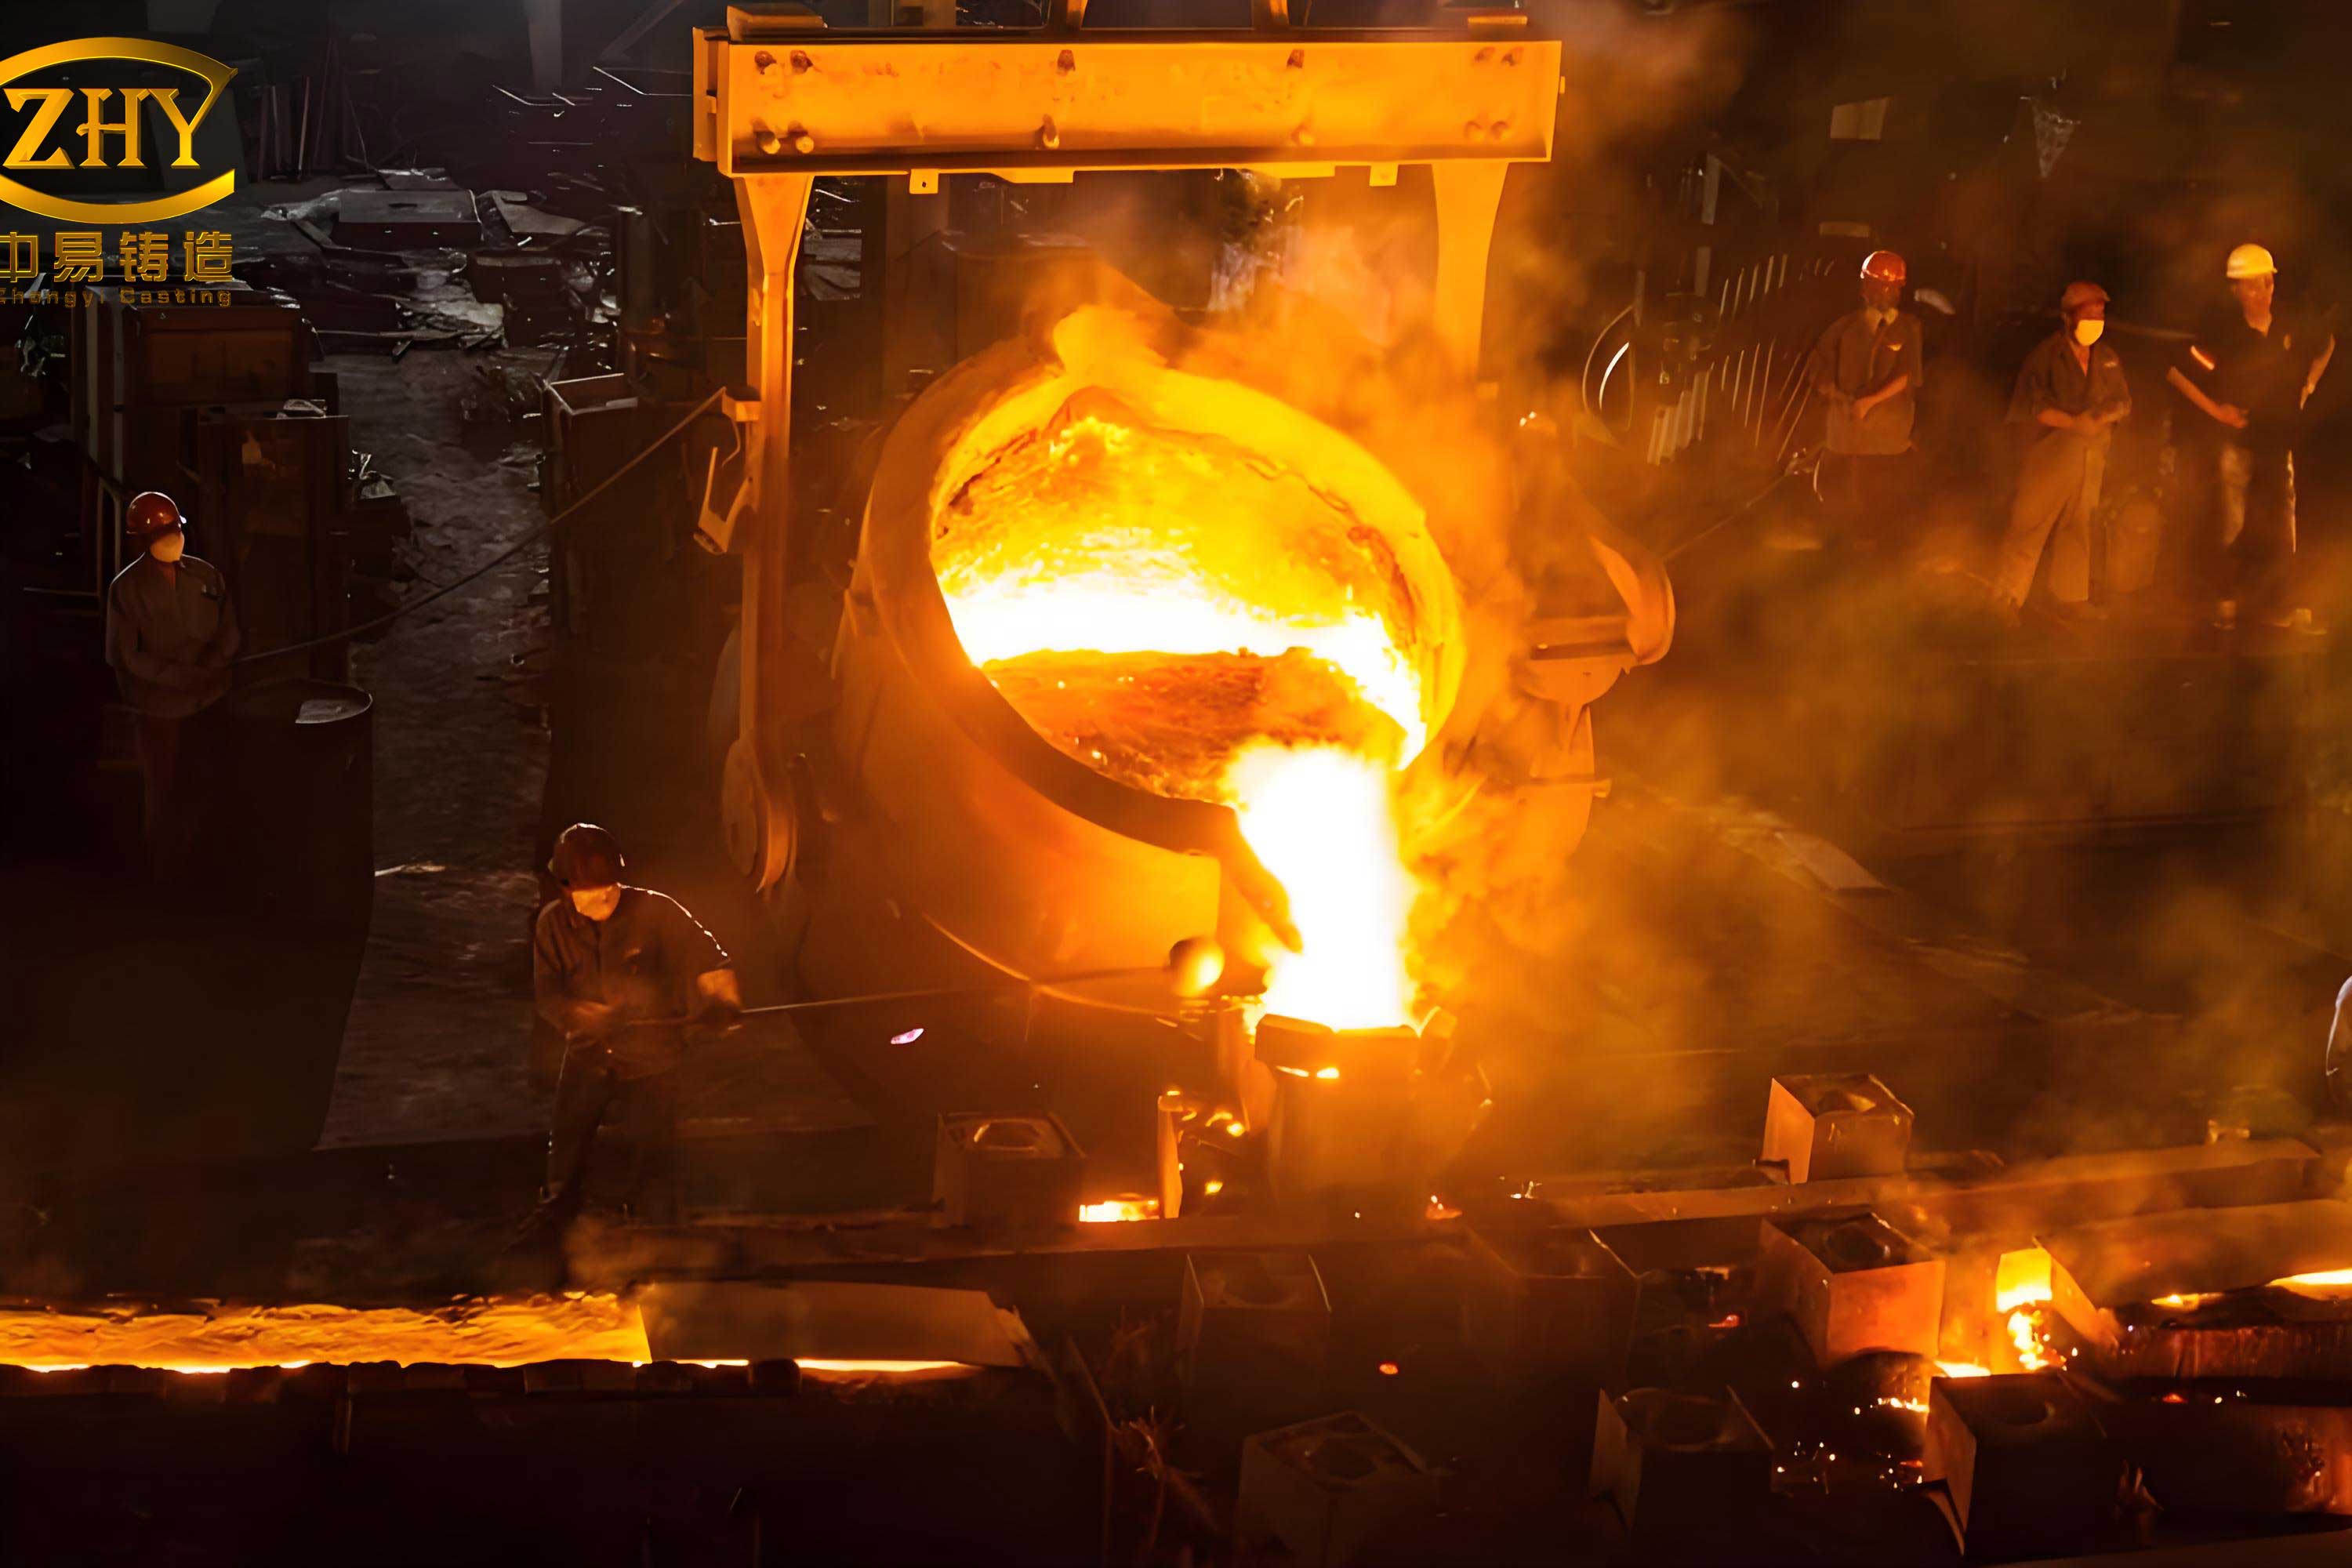
- Melting: Metal is melted in cupolas or induction furnaces; the charge composition significantly affects final properties.
- Pouring: Sensors record pouring temperature, pouring time, and inoculant addition for each ladle, ensuring quality control.
Table 1 summarizes the general characteristics of sand casting foundry processes.
| Characteristic | Description |
|---|---|
| Wide applicability | Unrestricted by size, thickness, or shape; upper mass limit above 300 t |
| Material variety | All meltable alloys, primarily cast iron, cast steel, and aluminum alloys |
| Dimensional accuracy | Moderate compared to forging or welding |
| Economic efficiency | Low cost per part, especially for large volumes |
1.2 Casting Defect Analysis
During the production of steering axles, rotary frames, and axle housings in our sand casting foundry, four common defects appear: cold shuts, gas porosity, sand inclusions, and shrinkage cavities. Although process parameters are maintained within specified ranges, the coupling of multiple factors often leads to quality issues. Traditional quality management fails to identify root causes because the influence of three-dimensional geometry is ignored.
1.3 Individualized Process Data Collection
We designed a single-part traceability solution to collect process data for each casting. For example, for steering axles, we integrated data from the MES system modules: core setting records, spectrometry records, spheroidization treatment records, internal scrap records, and external scrap records. By linking the core setting module (with production date, core setting time, casting number, heat number, serial number) to the spectrometry module (with test time, casting number, sample number), we achieve traceability for each individual casting’s melting parameters. Similarly, we correlated the spheroidization and scrap records to obtain a complete single-part dataset, including chemical composition, pouring temperature, inoculation amounts, and defect types.
2. Complex 3D Structure Feature Extraction
2.1 Autoencoder Principle for Dimensionality Reduction
Autoencoders (AE) are unsupervised neural networks trained to reconstruct their input. They consist of an encoder that maps the input to a latent representation h, and a decoder that reconstructs the input from h. The training minimizes the reconstruction loss. For a given input x, the encoder and decoder are functions f and g:
$$ \mathbf{h} = f(\mathbf{x}) = \sigma(W_e \mathbf{x} + b_e) $$
$$ \hat{\mathbf{x}} = g(\mathbf{h}) = \sigma(W_d \mathbf{h} + b_d) $$
The reconstruction loss is typically the mean squared error (MSE) for continuous data or cross-entropy for binary data. For voxelized 3D models, we use binary cross-entropy:
$$ L(\mathbf{x}, \hat{\mathbf{x}}) = -\frac{1}{N} \sum_{i=1}^{N} \left[ x_i \log(\hat{x}_i) + (1 – x_i) \log(1 – \hat{x}_i) \right] $$
Compared to linear methods like PCA, autoencoders can capture nonlinear relationships, making them suitable for complex geometry representation. The latent vector h serves as a compact shape descriptor.
2.2 Deep Convolutional Autoencoder (3D-DCAE) for Castings
To process 3D voxel grids of castings, we developed a 3D deep convolutional autoencoder (3D-DCAE). The input is a binary voxel grid of size D × H × W (depth, height, width) with a single channel. The encoder consists of three 3D convolutional layers with ReLU activation and max-pooling, progressively reducing the spatial dimensions while increasing feature channels. The decoder uses transposed convolutions (deconvolutions) to upsample back to the original size. The latent representation h is obtained from the bottleneck layer after flattening. Table 2 shows the reconstruction accuracy and examples for typical castings.
| Casting Type / Model | Original Point Cloud | Reconstructed Point Cloud | Reconstruction Accuracy |
|---|---|---|---|
| Rotary Frame 2041540 | Complex shape with holes | High fidelity, holes well preserved | 99.76% |
| Steering Axle A7V94-32001 | Curved plate structure | Excellent reconstruction of curves | 99.76% |
Our 3D-DCAE achieved a reconstruction accuracy of 99.76%. As shown in the table, the reconstructed point clouds closely match the original geometry, including fine features such as holes in the rotary frame and curved plates in the steering axle. This high accuracy indicates that the latent vector effectively captures the critical shape information.
2.3 Comparison with 2D Convolutional Autoencoder
We compared our 3D-DCAE with a 2D-DCAE baseline that treats the 3D volume as a stack of 2D images (channels). In the 2D version, the depth dimension is converted into channels, losing spatial correlations along the depth axis. The network structures differ as illustrated conceptually (not included here due to no figure references). Under identical training settings (same number of epochs, learning rate, and convolutional layers), the 3D-DCAE consistently outperforms the 2D-DCAE. The final reconstruction loss curves show that 3D-DCAE converges to a lower loss, confirming its superior ability to capture three-dimensional shape features.
3. Heterogeneous Data-Driven Defect Prediction Model
3.1 Model Architecture
We constructed a hybrid neural network that fuses structured process parameters with the 3D shape features extracted by the autoencoder. The overall framework is illustrated as a five-layer network combining 1D convolutional layers and fully connected layers. The steps are as follows:
- Data preprocessing: Process parameters are normalized to [0,1] using min-max scaling. Categorical defect labels are one-hot encoded.
- Input layer: The concatenated feature vector (process parameters + 3D shape latent code) is fed into the network.
- First and second layers: 1D convolutional layers with kernel size 3 and ReLU activation extract local patterns and increase channel depth.
- Third layer: Max-pooling reduces the dimensionality while preserving the most salient features.
- Fourth layer: Flatten converts the feature maps into a 1D vector.
- Fifth layer (output): A fully connected layer with softmax produces probabilities for five defect categories (cold shut, gas porosity, sand inclusion, shrinkage cavity, and no defect).
The model is trained with mini-batch gradient descent (batch size 64) to balance convergence speed and stability. We use cross-entropy loss with a cost-sensitive regularization term to handle class imbalance. The total loss function is:
$$ J = -\frac{1}{N} \sum_{i=1}^{N} \sum_{c=1}^{C} y_{i,c} \log(p_{i,c}) + \lambda \sum_{j} w_j^2 $$
where y is the one-hot true label, p is the predicted probability, C=5, and λ is the regularization coefficient. Table 3 summarizes the model parameters.
| Parameter | Value |
|---|---|
| Training set ratio | 0.8 |
| Test set ratio | 0.2 |
| Initial learning rate | 0.01 |
| Number of epochs | 80 |
| Loss function | Cross-entropy + cost-sensitive regularization |
| Optimizer | Mini-batch gradient descent (batch size = 64) |
3.2 Performance Comparison
We compared our proposed model (referred to as FR-CS-CNN) against two baselines: a traditional multi-layer perceptron (MLP) with fully connected layers, and a conventional 1D convolutional neural network (CNN) without 3D shape features. The accuracy results on both training and test sets are shown in Table 4.
| Model | Training Accuracy | Test Accuracy |
|---|---|---|
| Traditional MLP (only process parameters) | 92.6% | 86.1% |
| Traditional 1D CNN (only process parameters) | 93.9% | 90.7% |
| Our FR-CS-CNN (process + 3D shape) | 96.5% | 93.7% |
The results demonstrate that incorporating the 3D shape features extracted by the autoencoder significantly improves prediction accuracy. Our model achieves 96.5% on the training set and 93.7% on the test set, outperforming both baselines. This confirms the effectiveness of integrating morphological information from the casting geometry into the quality prediction framework for sand casting foundry.
4. Conclusion
In this study, we addressed the challenge of predicting defects in complex sand castings by developing a multi-source heterogeneous data-driven approach. The key contributions are:
- We analyzed the sand casting foundry process and implemented a single-part traceability system to collect structured process parameters (sand properties, melting data, pouring conditions) and three-dimensional models of the castings.
- We constructed a 3D deep convolutional autoencoder (3D-DCAE) to extract compact latent features from voxelized casting geometries. The model achieved 99.76% reconstruction accuracy and outperformed a 2D counterpart, demonstrating its ability to characterize complex shapes.
- We designed a hybrid neural network that fuses process parameters with 3D shape features to predict five common casting defects. The model attained 96.5% training accuracy and 93.7% test accuracy, significantly exceeding traditional methods that rely only on process data.
Our work provides a practical tool for sand casting foundry quality control, enabling early detection of defects and helping to optimize both process parameters and product design. Future work will extend the framework to more foundries and incorporate real-time sensor data for online prediction.
Acknowledgment
This research was supported by the National Key R&D Program of China (Grant No. 2020YFB1710100).