
I study the solidification behavior of ductile iron casting because its final quality is strongly controlled by the competition between liquid shrinkage, austenite contraction, graphite expansion, and inter-zone feeding. In my work, I treat ductile iron casting not as a simple layer-by-layer solidification system but as a mushy solidification system in which graphite nodules and austenite shells grow together, local pressure fields evolve, and isolated feeding zones may remain connected through narrow孔隙 channels. The central aim of my numerical model is to predict the location, amount, and spatial dispersion of shrinkage porosity and shrinkage cavities in ductile iron casting with greater physical consistency than conventional criteria-based methods.
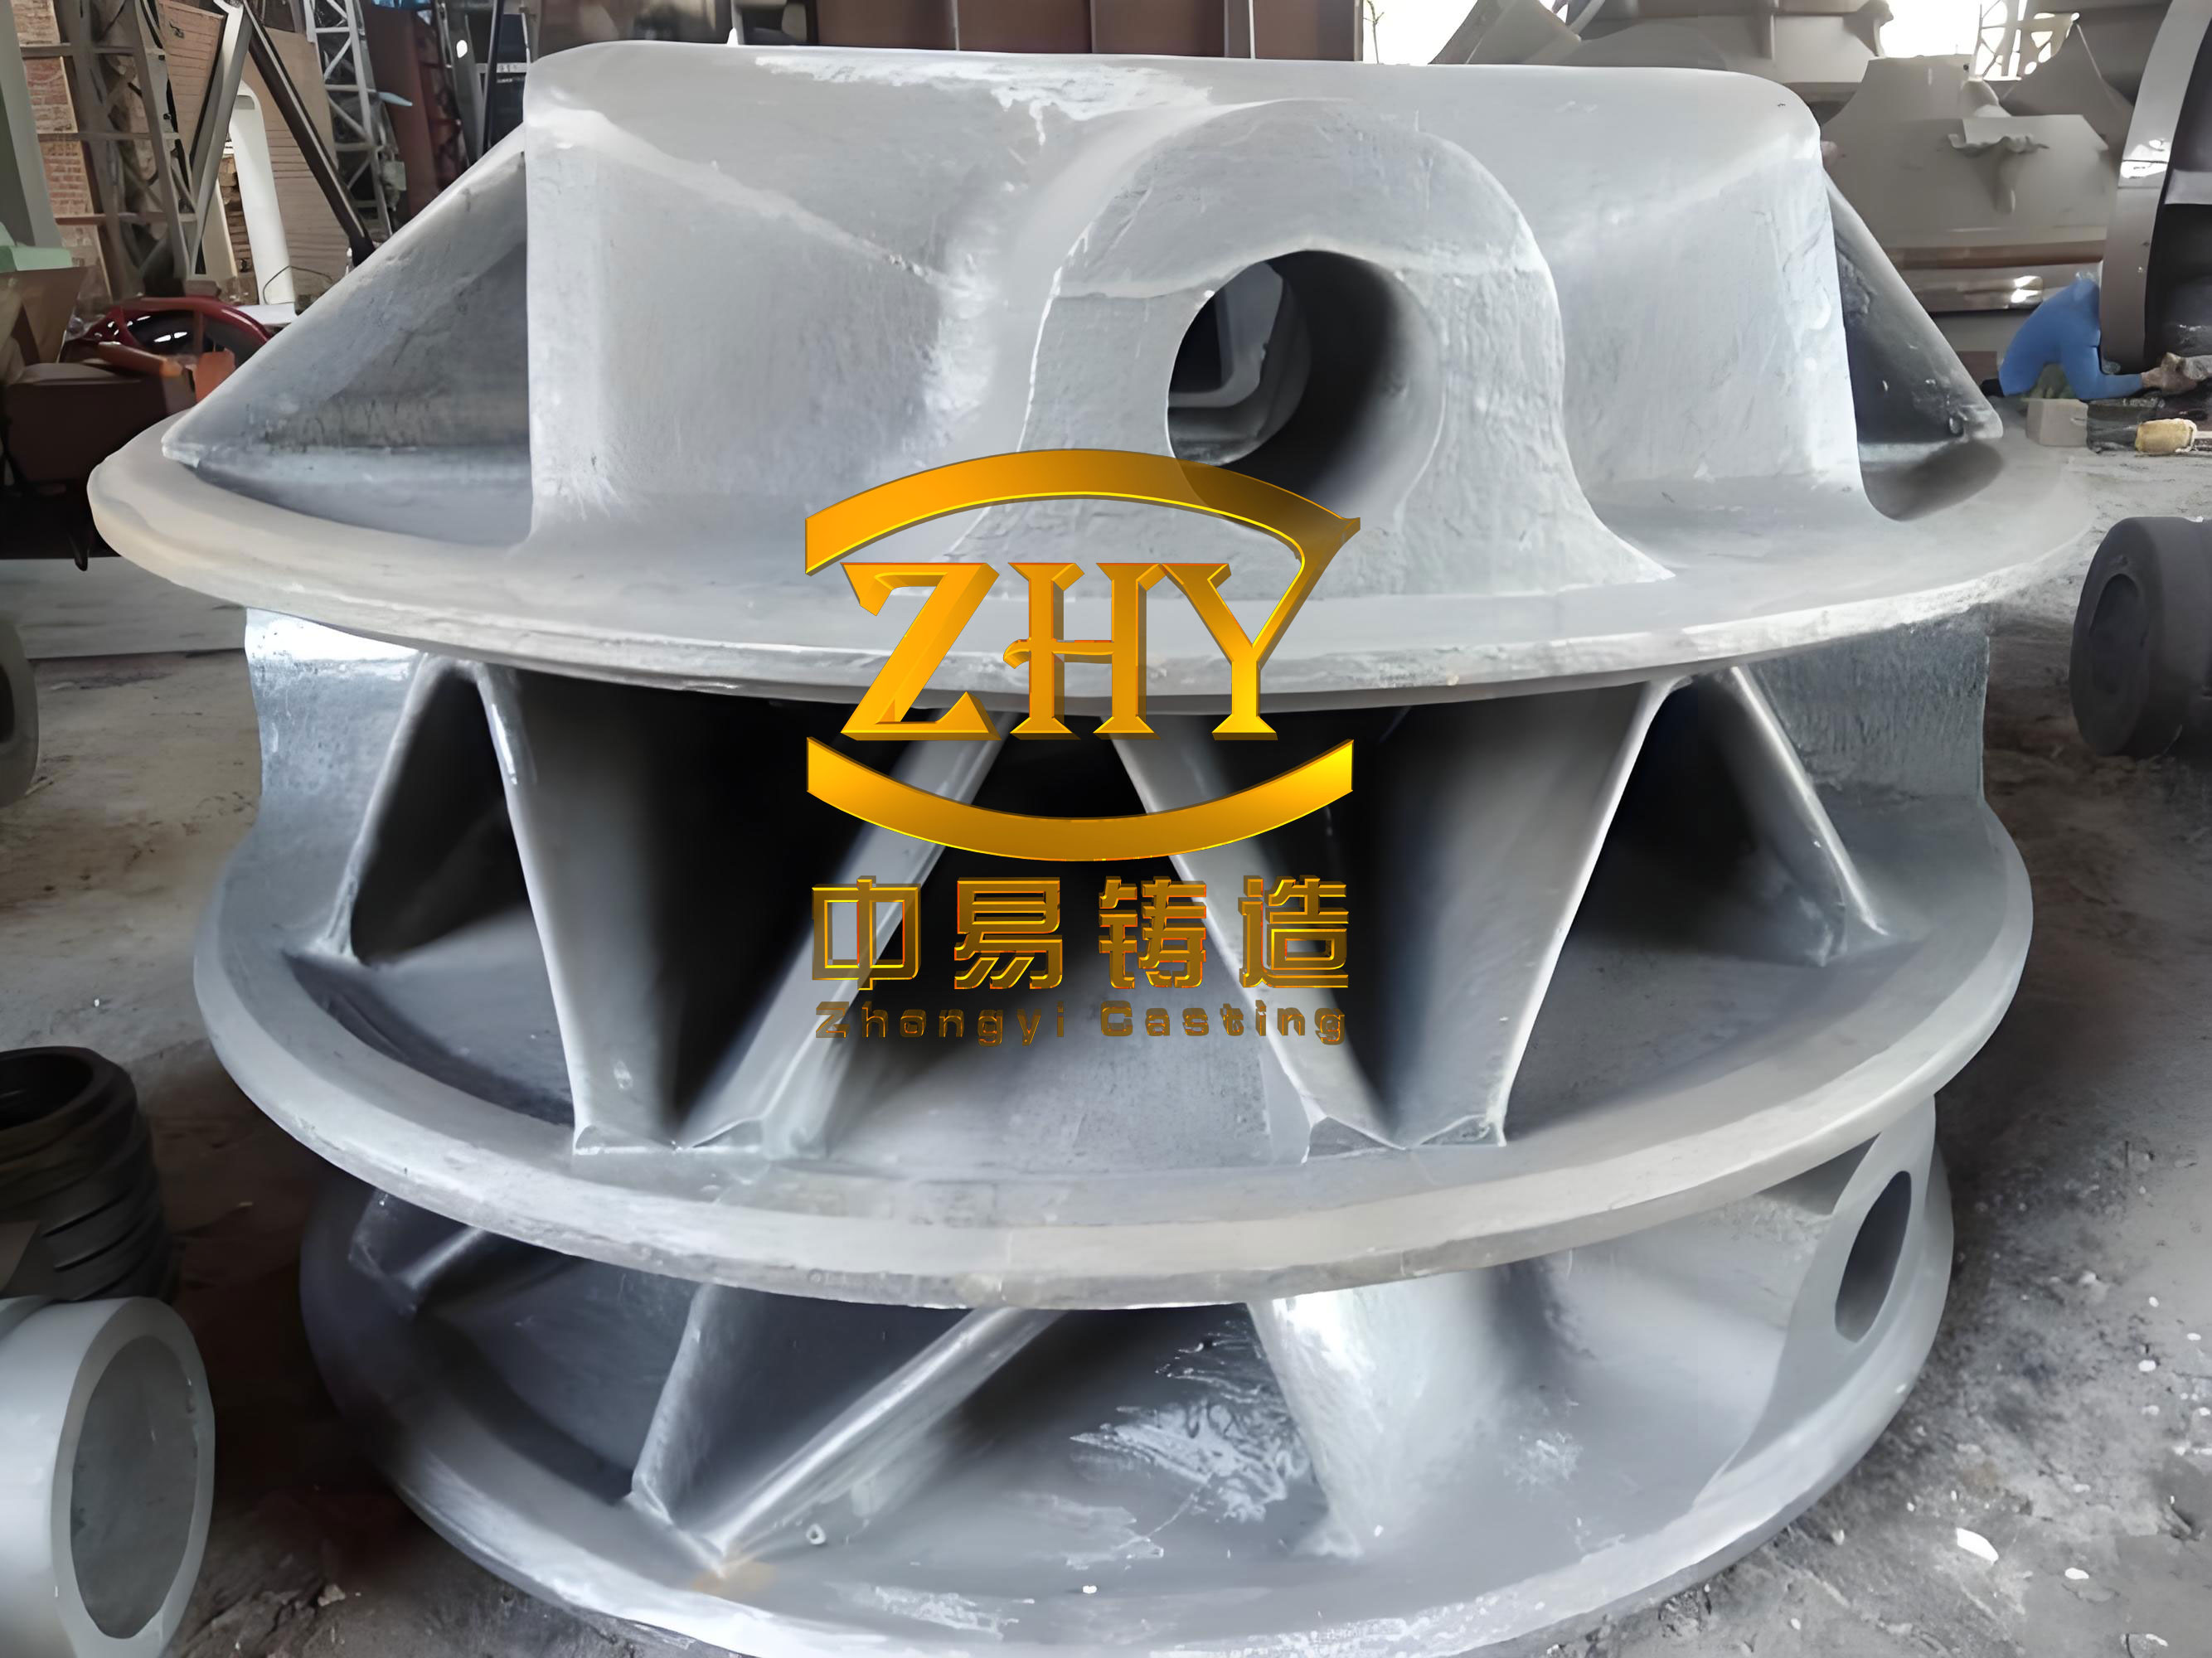
1. Physical Basis of Ductile Iron Casting Solidification
Ductile iron casting generally solidifies in a pasty mode. A sharp solid-liquid interface rarely exists over the whole casting section. Instead, solidification proceeds over a temperature interval, and the solid fraction increases nonlinearly with time. Graphite nodules act as the leading phase in eutectic solidification, and austenite forms around them. The simultaneous precipitation of graphite and austenite causes a complex volume balance. Graphite expansion can compensate part of the liquid shrinkage, but it can also generate internal pressure that drives liquid through residual channels. In my model, I therefore separate the total volume change into three contributions:
$$ \Delta V_{\text{total}} = \Delta V_{\text{liquid}} + \Delta V_{\text{austenite}} + \Delta V_{\text{graphite}} $$
For ductile iron casting, the graphite contribution is not a small correction. It can dominate the local volume balance during the eutectic stage. I describe the carbon equivalent, eutectic temperature, and carbon solubility limits because they determine whether graphite or austenite is the primary phase and how the eutectic stage proceeds.
$$ CE = C + 0.33Si + 0.33P + 0.4S – 0.03Mn $$
$$ T_E = 1154.6 + 6.5Si $$
$$ C_{TE} = 2.1 – 0.216Si $$
The carbon equivalent determines the primary solid fraction before the eutectic stage. For hypoeutectic ductile iron casting, austenite is the primary phase. For hypereutectic ductile iron casting, graphite is the primary phase. I use the following approximations for the primary fractions:
$$ f_{au,pr} = \frac{4.26-CE}{4.26-C_{TE}}, \quad CE < 4.26 $$
$$ f_{gr,pr} = \frac{CE-4.26}{100-4.26}, \quad CE > 4.26 $$
This distinction matters because the initial phase changes the subsequent nucleation and growth kinetics of graphite nodules and austenite shells. In a ductile iron casting with a high carbon equivalent, graphite precipitation occurs early and creates local carbon depletion. The depletion promotes austenite formation around the graphite nodules. The resulting eutectic cell contains a graphite nodule surrounded by an austenite shell. The growth of the nodule and shell is controlled by carbon diffusion through the austenite shell and across the solid-liquid interface.
2. Microstructural Evolution and Solid Fraction
I model graphite nucleation as a non-uniform process because industrial ductile iron casting contains inoculants, impurities, and heterogeneous substrates. I use a nucleation rate expression that depends on undercooling and the remaining liquid fraction:
$$ \frac{\partial N_{gr}}{\partial t} = (1-f_s)b\Delta T\exp\left(-\frac{c}{\Delta T}\right) $$
Here, \(N_{gr}\) is the nucleation density of graphite nodules, \(f_s\) is the solid fraction, \(\Delta T\) is the undercooling, and \(b\) and \(c\) are kinetic constants. After nucleation, the graphite nodule grows while an austenite shell forms around it. I approximate each eutectic cell as a graphite sphere of radius \(R_{gr}\) surrounded by an austenite shell with outer radius \(R_{\gamma}\). Carbon diffusion controls the motion of both interfaces.
$$ \frac{dR_{gr}}{dt} = \frac{(C_{\gamma/l}-C_{\gamma/gr})\rho_{\gamma}}{(C_{gr}-C_{\gamma/gr})\rho_{gr}} \frac{D_c^{\gamma}}{R_{gr}[1-1/(R_{\gamma}/R_{gr})]} $$
$$ \frac{dR_{\gamma}}{dt} = D_c^{\gamma} \frac{C_{\gamma/l}-C_{\gamma/gr}}{R_{\gamma}(-1+R_{\gamma}/R_{gr})(C_{l/\gamma}-C_{\gamma/l})} $$
The interfacial carbon concentrations are temperature-dependent. I use the following relations for ductile iron casting:
$$ C_{l/\gamma} = \frac{1}{97.3}(1569-T-24.32Si) $$
$$ C_{\gamma/l} = \frac{1}{177.9}(1528.4-T-32Si) $$
$$ C_{\gamma/gr} = \frac{(T-1154.6-6.5Si)(1.5-0.216Si)}{354.6+6.5Si}+2.1-0.216Si $$
To connect microscopic growth to the macroscopic solid fraction used in the thermal solver, I use the Johnson-Mehl model. The increase in solid fraction is proportional to the number density of active nodules and the growth rate of the eutectic cell:
$$ \frac{\partial f_s}{\partial t} = (1-f_s)4\pi N R^2 \frac{\partial R}{\partial t} $$
The mass fraction of graphite inside the eutectic cell is calculated from the densities and radii:
$$ f_{gr,eu} = \frac{\rho_{gr}R_{gr}^3}{\rho_{\gamma}(R^3-R_{gr}^3)+\rho_{gr}R_{gr}^3} $$
$$ f_{\gamma,eu} = f_s – f_{gr} $$
My treatment of ductile iron casting therefore does not rely on a linear solid fraction-temperature relation. The solid fraction evolves according to nucleation, diffusion-controlled growth, and impingement. This is essential because the latent heat release rate follows the same nonlinear path. A linear relation would over-soften the recalescence plateau and shift the final solidification time, which would in turn alter the predicted shrinkage porosity distribution.
| Parameter | Meaning | Typical range or value used in ductile iron casting |
|---|---|---|
| \(CE\) | Carbon equivalent | 4.0–4.6 |
| \(T_E\) | Eutectic temperature | 1140–1160 °C |
| \(C_{TE}\) | Carbon solubility in austenite at eutectic temperature | 1.6–1.9 wt.% |
| \(N_{gr}\) | Graphite nodule density | \(10^{11}\)–\(10^{14}\) m\(^{-3}\) |
| \(R_{gr}\) | Graphite nodule radius | 2–30 \(\mu\)m |
| \(R_{\gamma}\) | Austenite shell radius | 5–80 \(\mu\)m |
| \(f_s\) | Total solid fraction | 0–1 |
| \(f_{gr,eu}\) | Graphite fraction in eutectic cell | 0.05–0.25 |
3. Temperature Field Calculation for Ductile Iron Casting
Accurate temperature field calculation is the foundation of my shrinkage prediction model. The temperature field controls the cooling rate, the solidification sequence, the formation of isolated feeding zones, and the local pressure loss in residual mush. I solve the transient heat conduction equation with a latent heat source term:
$$ \frac{\partial T}{\partial t} = \frac{k}{\rho c}\left(\frac{\partial^2 T}{\partial x^2}+\frac{\partial^2 T}{\partial y^2}+\frac{\partial^2 T}{\partial z^2}\right)+\frac{Q}{\rho c} $$
The heat flux is described by Fourier’s law:
$$ q = -k\nabla T $$
The latent heat source \(Q\) is not prescribed as a constant. I compute it from the solid fraction increment obtained from the microstructure model:
$$ Q = \rho L \frac{df_s}{dt} $$
For the primary phase stage, I use an equivalent specific heat method because the latent heat release is relatively small and distributed over a narrow temperature interval:
$$ c_{eq} = c + \frac{L_{pre}}{\Delta T} $$
For the eutectic stage, I use the Johnson-Mehl-based solid fraction increment. This distinction improves the temperature curve in ductile iron casting because the recalescence plateau is reproduced more faithfully. I use an explicit finite difference scheme on an orthogonal hexahedral grid. The temperature update for a cell can be written as:
$$ T^{n+1} = T^n + \sum_j A_j(T_j^n-T^n)+B $$
where \(j\) denotes the neighboring cells, \(A_j\) contains the thermal properties and grid spacing, and \(B\) contains the source term. The time step is limited by a Courant-Friedrichs-Lewy condition:
$$ dt < \alpha \frac{\rho c \, dx \, dx}{k} $$
I treat the outer air layer with a fixed-temperature Dirichlet condition. Between different materials, I use a Robin condition. To avoid the uncertainty of a single interface heat transfer coefficient, I compute an equivalent thermal conductivity across the interface:
$$ k_{eq} = \frac{1}{d_i/k_i+1/h+d_j/k_j} $$
This equivalent conductivity is used in the finite difference stencil for adjacent cells of different materials. I apply this approach to the mold, casting, air, and feeding system. The thermal properties used in my simulations are summarized below.
| Material | Density (g cm\(^{-3}\)) | Thermal conductivity (cal cm\(^{-1}\) s\(^{-1}\) °C\(^{-1}\)) | Specific heat (cal g\(^{-1}\) °C\(^{-1}\)) | Liquidus (°C) | Solidus (°C) | Latent heat (cal g\(^{-1}\)) |
|---|---|---|---|---|---|---|
| Ductile iron QT400 | 6.815 | 0.0763 | 0.1915 | 1171.2 | 1140.0 | 61.2–80.0 |
| Ductile iron QT600-3 | 6.829 | 0.0763 | 0.1834 | 1175.0 | 1095.0 | 59.4 |
| Ductile iron QT700-2 | 6.858 | 0.0755 | 0.1912 | 1184.7 | 1135.0 | 59.5 |
| Coated sand mold | 1.55 | 0.00192 | 0.260 | — | — | — |
| Air | 0.00121 | 0.000062 | 0.240 | — | — | — |
4. Isolated Feeding Zones in Ductile Iron Casting
As solidification advances, the solid fraction in a ductile iron casting increases. When the solid fraction exceeds a critical value, the austenite dendrite network becomes coherent, and the remaining liquid is no longer free to move under gravity alone. The original liquid region is then divided into isolated feeding zones. I define three states based on the local solid fraction:
| State | Solid fraction | Flow behavior | Role in ductile iron casting | |
|---|---|---|---|---|
| Liquid | \(f_s=0\) | Free convection and feeding | Long-range feeding is possible | |
| Mushy | \(0<f_s<f_c\) | Interdendritic flow is possible | Feeding path can still exist | |
| Solid-like mush | \(f_s \ge f_c\) | Dendrite network is coherent | Feeding is strongly restricted |
I use a breadth-first search algorithm to identify isolated feeding zones. The algorithm marks each cell according to its solid fraction. A cell with \(f_s<f_c\) \(f_s<f_c\),="" \(o(n)\),="" a="" added="" added.="" also="" are="" belong="" can="" casting="" cell,="" cells="" cells,="" cells.="" complexity="" continues="" ductile="" feeding="" for="" from="" has="" i="" if="" in="" iron="" is="" it="" its="" large="" linear="" meshes.
Within each isolated feeding zone, I calculate the volume change from liquid shrinkage, austenite contraction, and graphite expansion. For a single cell \(i\), the volume change over one time step is:
$$ \Delta V_{e,i} = \left(\alpha_l \Delta T_i(1-f_{s,i})-\alpha_G \Delta f_{G,i}+\alpha_A \Delta f_{A,i}\right)(1-\varphi_i)V_i $$
Here, \(\alpha_l\), \(\alpha_G\), and \(\alpha_A\) are the liquid shrinkage, graphite expansion, and austenite contraction coefficients. \(\varphi_i\) is the porosity fraction. If \(\Delta V_{e,i}>0\), the cell tends to shrink. If \(\Delta V_{e,i}<0\), graphite expansion dominates. In that case, the excess expansion can feed other cells, but only through liquid migration. I limit the available feeding volume to the liquid volume in the cell:
$$ V_{p,i} = \min\left(\left|\frac{\Delta V_{e,i}}{V_i}\right|-\varphi_i, V_{l,i}\right) $$
The total shrinkage of an isolated feeding zone is then obtained by summing all porosity volumes and subtracting the available feeding volumes:
$$ \Delta V_{iso} = \sum_i \varphi_i V_i – \sum_j V_{p,j} $$
If \(\Delta V_{iso}\le 0\), the feeding zone is expansive. Its available liquid can compensate all local porosity, and no shrinkage allocation is required. If \(\Delta V_{iso}>0\), the feeding zone is contractive. It has a net shrinkage that cannot be compensated internally, and it may become a shrinkage defect in the ductile iron casting.
| Quantity | Condition | Interpretation |
|---|---|---|
| \(\Delta V_{iso}<0\) | Expansion exceeds shrinkage | Zone can feed other zones |
| \(\Delta V_{iso}=0\) | Balanced | No net shrinkage |
| \(\Delta V_{iso}>0\) | Shrinkage exceeds expansion | Zone requires feeding or forms porosity |
5. Allocation of Shrinkage Inside a Feeding Zone
For a contractive isolated feeding zone, I must decide where the shrinkage porosity forms. In gravity casting of ductile iron casting, the pressure field inside the feeding zone is not uniform. I initialize the static pressure field from gravity:
$$ P_{init} = -\rho g \Delta z $$
I then search from air-connected cells to identify open feeding zones. For cells connected to air, I correct the pressure by the atmospheric pressure. For a closed feeding zone, I keep the gravitational pressure distribution. After the pressure field is obtained, I allocate the shrinkage volume to cells with the lowest pressure first. This follows the physical expectation that porosity forms at the top of a feeding zone or near a free surface.
I use three allocation modes depending on the ratio of the total shrinkage volume to the available liquid volume in the current priority group:
$$ \varphi_i^{new} = \frac{\Delta V_{iso}}{N V_i} $$
In the first mode, the shrinkage volume is small. It is distributed uniformly over the highest-priority cells. In the second mode, the shrinkage volume is larger than the liquid volume of the highest-priority cells. Those cells are fully converted into porosity, and the remaining shrinkage is passed to the next priority group. In the third mode, the shrinkage volume is moderate. Some cells cannot accept the uniform share, so I sort them by liquid volume and fill the smallest cells first, then recompute the uniform share for the remaining cells. This dynamic allocation prevents nonphysical negative liquid fractions and produces a more realistic porosity morphology in ductile iron casting.
6. Cross-Zone Feeding Driven by Graphitization Expansion
A key feature of my model is that isolated feeding zones are not always independent. In ductile iron casting, graphite expansion can generate a pressure high enough to push liquid through narrow residual channels. I therefore allow cross-zone feeding between an expanding zone and a contracting zone if the expansion pressure exceeds the pressure loss along the path.
The expansion pressure of an expanding zone is related to its excess expansion volume and its bulk modulus. I approximate the zone as a confined elastic body. The expansion pressure is:
$$ P_e = K \frac{-\Delta V_{iso}}{\Omega_{iso}} $$
The bulk modulus is obtained from the elastic modulus and Poisson ratio:
$$ K = \frac{E}{3(1-2\nu)} $$
The pressure loss of liquid flowing through the residual mush is described by Darcy’s law:
$$ \nabla P_s = -\frac{\mu}{K_p}v_l $$
The permeability is calculated from the Kozeny-Carman relation:
$$ K_p = K_0 \frac{\phi^3}{(1-\phi)^2} $$
I express the pore fraction as the sum of residual liquid fraction and porosity fraction:
$$ \phi \approx V_l + \varphi_i $$
The permeability coefficient depends on the secondary dendrite arm spacing:
$$ K_0 = \frac{d^2}{180} $$
$$ d = \alpha t_s^n $$
Combining these relations gives the pressure loss per cell for liquid flow through the mush:
$$ \Delta P_s = \frac{\rho_s-\rho_l}{\rho_l} \frac{H}{R} \frac{180}{(\alpha t_s^n)^2} \frac{(1-V_l-\varphi_i)^2 \mu}{(V_l+\varphi_i)^2} dx $$
This expression shows the physical competition in ductile iron casting. If a cell contains a small but nonzero amount of residual liquid or porosity, liquid can still pass with a finite pressure loss. If the cell is almost fully solid, the pressure loss becomes extremely large. Therefore, a fully closed solid network blocks cross-zone feeding even if the expanding zone has a high graphite expansion pressure.
| Symbol | Physical meaning | Influence on cross-zone feeding |
|---|---|---|
| \(P_e\) | Expansion pressure | Driving force for liquid migration |
| \(\Delta P_s\) | Pressure loss in mush | Resistance to feeding |
| \(\mu\) | Liquid viscosity | Higher viscosity increases loss |
| \(V_l+\varphi_i\) | Residual liquid plus porosity | Higher value decreases loss |
| \(d\) | Secondary dendrite arm spacing | Larger spacing decreases loss |
| \(t_s\) | Local solidification time | Longer time increases spacing |
7. Minimum Pressure Loss Path and Feeding Potential
For an expanding zone, I need to know which contracting zones it can feed. I treat each cell as a node in a weighted graph. The edge weight is the pressure loss between neighboring cells. The problem becomes a shortest-path problem with pressure loss as the cost. I solve it with Dijkstra’s algorithm. This avoids the exponential growth of a direct path search and eliminates repeated calculations. I define the feeding potential as:
$$ G = P_e – \sum_i P_{s,i} $$
If \(G>0\), the expanding zone can drive liquid to the target contracting zone. If \(G\le 0\), the pressure loss is too large, and the target zone cannot be fed. The feeding potential also measures the strength of the feeding connection. A larger \(G\) means a stronger ability to feed. I use this value to assign priorities when distributing the expansion volume.
I group contracting zones into priority levels. If two contracting zones have feeding potentials that differ by less than a small threshold \(\gamma\), I place them in the same priority group. This avoids an artificial preference when the physical feeding abilities are almost identical. Within the same priority group, I distribute the available expansion volume in proportion to the shrinkage volume. If the total shrinkage of the highest-priority group is smaller than the available expansion volume, the excess expansion moves to the next priority group.
| Step | Operation | Purpose in ductile iron casting |
|---|---|---|
| 1 | Identify expanding and contracting zones | Separate feeders from shrinkage sites |
| 2 | Compute \(\Delta V_{iso}\) for each zone | Quantify local expansion or shrinkage |
| 3 | Compute \(P_e\) for expanding zones | Obtain graphite-driven pressure |
| 4 | Compute \(\Delta P_s\) for mush cells | Quantify flow resistance |
| 5 | Run Dijkstra search | Find minimum pressure loss paths |
| 6 | Evaluate feeding potential \(G\) | Decide whether feeding is possible |
| 7 | Group contracting zones by priority | Allocate expansion volume rationally |
| 8 | Update porosity fields | Predict final shrinkage defects |
8. Coupled Algorithm for Shrinkage Prediction in Ductile Iron Casting
The complete model is solved in a time-stepping loop. At each time step, I first update the temperature field and the solid fraction. Then I identify isolated feeding zones, compute the volume change of each zone, separate expanding and contracting zones, compute expansion pressure, build the pressure-loss graph, search for feasible cross-zone feeding paths, allocate expansion volume, and finally allocate remaining shrinkage to the lowest-pressure cells. The loop continues until all alloy cells exceed the critical solid fraction.
| Stage | Input | Output | Coupling with ductile iron casting physics |
|---|---|---|---|
| Temperature update | Previous temperature, properties, latent heat | New temperature field | Controls cooling and solidification sequence |
| Microstructure update | Temperature, undercooling, nucleation density | \(f_s\), \(f_{gr}\), \(f_{\gamma}\) | Represents graphite and austenite growth |
| Zone search | Solid fraction field | Isolated feeding zones | Defines feeding domains |
| Volume balance | Phase fractions and temperature change | \(\Delta V_{iso}\) | Quantifies expansion and shrinkage |
| Cross-zone feeding | \(P_e\), pressure loss graph | Feeding pairs and allocated volume | Models graphite-driven compensation |
| Porosity allocation | Pressure field and remaining shrinkage | Porosity fraction per cell | Predicts shrinkage cavity and porosity |
The numerical implementation is written in C++ and linked as a dynamic library. I use an external CAE environment for mesh generation and post-processing. The solver reads the mesh and material identifiers, initializes the temperature field, computes the solidification path, and exports porosity fields for visualization. This structure allows me to test the model on different ductile iron casting geometries without changing the core solver.
9. Validation by Temperature Measurement
I first validate the temperature field model with a sample cup experiment. The cup has a larger top cross-section and a smaller bottom cross-section. I place a thermocouple at the center of the casting and record the cooling curve. The measured curve shows a clear recalescence plateau. The temperature decreases rapidly, then slows near the eutectic temperature, rises slightly due to latent heat release, and remains nearly constant for a period before falling again. My simulated curve reproduces this behavior when the solid fraction is calculated from the microstructure model rather than from a linear relation.
In an initial calculation, the plateau after 175 s was too short. The simulated temperature fell earlier than the measured temperature. I attributed this to an underestimated latent heat value. After increasing the latent heat from 61.2 to 80.0 cal g\(^{-1}\), the simulated curve matched the measured curve much better. The correlation coefficient increased from 0.93372 to 0.99357. This result supports the use of coupled latent heat and microstructure calculation for ductile iron casting.
| Case | Latent heat (cal g\(^{-1}\)) | Correlation coefficient | Observed behavior |
|---|---|---|---|
| Initial parameters | 61.2 | 0.93372 | Plateau too short; early temperature drop |
| Adjusted parameters | 80.0 | 0.99357 | Plateau length and recalescence matched better |
10. Validation of Cross-Zone Feeding
I designed an irregular casting to test whether the cross-zone feeding model produces a physically meaningful redistribution of shrinkage. The casting consists of a larger left cylinder, a smaller right cylinder, and a narrow connecting section. The connecting section solidifies early and separates the two cylinders into different feeding zones. The right cylinder cools faster because it has a smaller volume and larger relative surface area. The left cylinder remains liquid longer and can become an expanding zone. When I activate cross-zone feeding, liquid from the left cylinder can flow through residual channels into the right cylinder. The predicted porosity in the right cylinder decreases, while some porosity shifts to the left cylinder. This is consistent with the graphite expansion behavior of ductile iron casting. When cross-zone feeding is disabled, the right cylinder retains more shrinkage defects. The comparison confirms that my model captures the interaction between isolated feeding zones.
| Model setting | Right cylinder porosity | Left cylinder porosity | Interpretation |
|---|---|---|---|
| Without cross-zone feeding | Higher | Lower | Zones are treated as independent |
| With cross-zone feeding | Lower | Higher | Graphite expansion drives liquid to right side |
11. Application to a Drive Wheel Type Ductile Iron Casting
I applied the model to a drive wheel type ductile iron casting with a circular symmetric structure and an internal cavity. The internal cavity creates a thermal barrier and promotes a long-lasting liquid region. The runner and riser on one side delay cooling and shift the last solidification region. I used a uniform mesh and calculated the temperature field, graphite fraction, liquid fraction, and porosity field. The temperature curves show a nonlinear decrease with a visible eutectic plateau. The graphite fraction is higher near the outer rim because the cooling rate is higher there and the eutectic reaction occurs earlier. The liquid fraction maps show that a connected liquid region breaks into several isolated zones as solidification proceeds. The predicted porosity is dispersed rather than concentrated in a single large cavity. This dispersion is consistent with the pasty solidification of ductile iron casting and with the local variation of graphite expansion.
| Observation | Simulated trend | Physical reason in ductile iron casting |
|---|---|---|
| Outer rim cools first | Higher graphite fraction | Higher cooling rate promotes eutectic nucleation |
| Internal cavity remains hot | Longer liquid retention | Reduced heat extraction and thermal resistance |
| Riser side cools slowly | Last solidification region | Riser heat supply and larger section modulus |
| Porosity is dispersed | Multiple small defects | Pasty solidification and local expansion imbalance |
The actual casting was cut and inspected. The observed shrinkage defects were distributed in the interior and near the last-solidified regions. The locations and approximate severity agreed with the simulation. The model did not predict a single large shrinkage pipe because the graphite expansion compensated part of the contraction. This is one of the main differences between ductile iron casting and steel casting, and it justifies the expansion-pressure term in my model.
12. Application to a Bracket Type Ductile Iron Casting
I also tested the model on a bracket type ductile iron casting with nonuniform wall thickness. The bracket has a thin right section and a thicker left section connected to a riser. The thin section cools quickly and solidifies early. The thick section and riser remain hot longer. The temperature field shows a strong gradient between the thin and thick regions. The predicted porosity is small and widely distributed. This pattern is often observed in ductile iron casting because graphite expansion can suppress large cavities but cannot completely eliminate local micropores in the last-solidified mush.
| Region | Cooling behavior | Predicted defect tendency |
|---|---|---|
| Thin right section | Rapid cooling | Early solidification; low shrinkage risk |
| Thick left section | Slow cooling | Long liquid retention; moderate risk |
| Riser connection | Very slow cooling | Last solidification; possible shrinkage |
| Transition zone | Moderate gradient | Dispersed micropores |
After pouring and sectioning, I compared the predicted shrinkage area with the observed shrinkage area on a selected cross-section. The predicted porosity area was 0.16 cm\(^2\) in a section area of 17.04 cm\(^2\), giving a ratio of about 0.939%. The observed porosity area was 648 pixels in a section area of 64917 pixels, giving a ratio of about 0.998%. The relative prediction accuracy was about 94.09%. The exact positions differed slightly because the model uses an idealized geometry and uniform material properties, but the area fraction and general distribution were close. This confirms that the model can provide quantitative support for process optimization in ductile iron casting.
13. Discussion
The most important difference between my model and conventional shrinkage criteria is that I do not treat graphite expansion as a simple modifier to the shrinkage coefficient. I treat it as a pressure source. This pressure source changes the direction of liquid flow between isolated feeding zones. In a conventional model, an isolated zone with net shrinkage is assumed to form porosity in place. In my model, that zone can receive liquid from an expanding zone if the path pressure loss is lower than the expansion pressure. This is a more realistic representation of ductile iron casting because graphite expansion occurs at the scale of eutectic cells and can generate local pressures that are much larger than the static pressure head.
The second important difference is the use of a microstructure-based solid fraction. The solid fraction controls the latent heat release, the onset of coherent dendrite networks, the permeability of the mush, and the division into isolated feeding zones. A linear solid fraction-temperature relation cannot capture the recalescence plateau or the rapid change in permeability near the end of solidification. My use of nucleation and diffusion-controlled growth gives a more realistic evolution of these quantities. The temperature validation and the porosity validation both support this choice.
The third important difference is the use of a minimum pressure loss path. The path between an expanding zone and a contracting zone is not necessarily straight. It follows the residual liquid and porosity channels. Dijkstra’s algorithm finds the path with the lowest total pressure loss. This is computationally efficient and physically meaningful. It also allows the model to account for the fact that a contracting zone may be close in distance but inaccessible because the local mush is almost fully solid. Conversely, a more distant zone may be accessible if a continuous residual channel remains open.
| Model feature | Conventional approach | My ductile iron casting model |
|---|---|---|
| Solid fraction | Linear or temperature-based | Microstructure-based with nucleation and growth |
| Graphite expansion | Global correction | Local pressure source |
| Feeding zones | Independent isolated zones | Interacting zones with cross-zone feeding |
| Flow resistance | Often ignored | Darcy pressure loss with permeability |
| Path selection | Straight-line or nearest neighbor | Dijkstra minimum pressure loss path |
| Porosity allocation | Last solid node | Pressure-ranked dynamic allocation |
14. Limitations and Further Improvement
My model still contains several simplifications. The thermo-physical properties are treated as constant within each material, although in reality density, thermal conductivity, and specific heat vary with temperature. A more accurate ductile iron casting simulation should use temperature-dependent properties and inverse methods to calibrate them. Gas precipitation is also not included. In ductile iron casting, gas porosity can interact with shrinkage porosity. If gas is trapped, it can increase the internal pressure and reduce shrinkage, or it can create additional pores. A future version of the model should include gas evolution and pore-gas pressure.
Another limitation is the treatment of graphite expansion as a current-time phenomenon. I assume that the expansion volume generated in a time step is available for feeding in the same time step. In reality, graphite expansion accumulates over time, and the pressure field may evolve with the elastic and plastic response of the austenite network. A more complete model would track the cumulative expansion volume and allow the pressure to relax or redistribute over multiple time steps. This would improve the prediction of delayed feeding and residual stress in ductile iron casting.
15. Conclusions
I have developed a numerical model for shrinkage defect prediction in ductile iron casting. The model combines microstructural nucleation and growth, nonlinear latent heat release, transient temperature field calculation, isolated feeding zone search, local volume balance, graphite expansion pressure, Darcy pressure loss, and minimum pressure loss path search. The model reproduces the recalescence plateau observed in temperature measurements. It predicts a dispersed porosity pattern rather than a single large cavity, which is consistent with the pasty solidification behavior of ductile iron casting. The cross-zone feeding test shows that an expanding zone can reduce porosity in a contracting zone when graphite expansion pressure exceeds the pressure loss along the residual mush channel. The drive wheel and bracket casting validations show that the predicted defect locations and area fractions agree with actual poured and sectioned castings. The relative prediction accuracy reached about 94.09% in the bracket case. I conclude that the proposed model provides a physically consistent and quantitatively useful tool for shrinkage defect prediction in ductile iron casting.
| Contribution | Method | Effect on ductile iron casting prediction |
|---|---|---|
| Microstructure-coupled solid fraction | Graphite nucleation, austenite shell growth, Johnson-Mehl model | Captures nonlinear latent heat and permeability evolution |
| Graphite expansion pressure | Bulk modulus and excess expansion volume | Provides driving force for cross-zone feeding |
| Mush pressure loss | Darcy law and Kozeny-Carman permeability | Quantifies resistance to interdendritic flow |
| Minimum pressure loss path | Dijkstra algorithm | Identifies feasible feeding connections |
| Priority-based expansion allocation | Feeding potential and grouping | Distributes expansion volume rationally |
| Pressure-ranked shrinkage allocation | Lowest-pressure-first dynamic filling | Predicts final porosity location and size |
For industrial application, I recommend using this model together with a calibrated material database and a mesh that resolves the thin connecting sections between thermal nodes. The mesh size should be fine enough to represent possible feeding channels, because a coarse mesh may artificially close a residual channel and suppress cross-zone feeding. I also recommend measuring the cooling curve for each alloy and inoculation condition so that the nucleation parameters and latent heat can be adjusted. With these inputs, the model can support riser design, chill placement, gating optimization, and defect diagnosis in ductile iron casting.
The broader implication of my work is that shrinkage prediction in ductile iron casting should not be treated as a purely thermal problem. It is a coupled thermal, microstructural, volumetric, and hydraulic problem. Graphite expansion is both a volumetric compensation mechanism and a pressure-driven flow mechanism. Isolated feeding zones are not necessarily independent. The residual mush is not a perfect barrier. By representing these effects explicitly, I obtain a more realistic map of shrinkage porosity and shrinkage cavities. This approach can be extended to other cast irons, compacted graphite iron, and castings with complex thermal boundaries. It can also be coupled with stress analysis to study the interaction between porosity, distortion, and residual stress in ductile iron casting.
$$ \text{Final porosity field} = f(T, f_s, f_{gr}, f_{\gamma}, P_e, \Delta P_s, G) $$
In my view, the most valuable outcome of this study is the demonstration that graphite expansion can be used as a predictive flow-driving variable rather than a fixed empirical correction. This shift in perspective improves both the physical transparency and the quantitative accuracy of shrinkage prediction for ductile iron casting.