
Thin-walled aluminum impellers concentrate several difficulties in one part: wall sections of a few millimetres, large projected area, curved blade surfaces that are dimensionally intolerant, and a service load that is cyclic and non-uniform. In a diversion impeller the water flow imposes periodic, asymmetric pressure on the blades, so the casting must combine high strength with high density, and internal shrinkage cannot be tolerated. Investment casting is chosen for such parts because it delivers dimensional accuracy and surface finish that sand casting cannot, but the same shell-based route brings slow cooling, a long process chain, and a strong sensitivity of yield to gating design.
This article examines a documented case: an A356 aluminum diversion impeller of 138 mm overall height, 398 mm maximum diameter and 3 mm blade wall, produced by investment casting with the aid of the finite-element casting package ProCAST. The sequence is characteristic of modern foundry practice — simulate the initial design, read the defect field, redesign the gating system, screen process parameters, then verify in metal.
The Investment Casting Route and Where It Fails
Investment casting descends from the lost-wax process. A fusible pattern is injected, assembled onto a runner, coated with refractory slurry and stucco, dried and hardened in repeated layers, dewaxed, and fired into a ceramic shell; molten metal is then poured into the fired cavity, and the shell is broken away after solidification. Minimum铸 feature sizes of about 0.5 mm in diameter and 0.3 mm in wall thickness are achievable, and castings over 500 mm with tolerances in the range of 0.015–0.10 mm per 25 mm are routinely quoted.
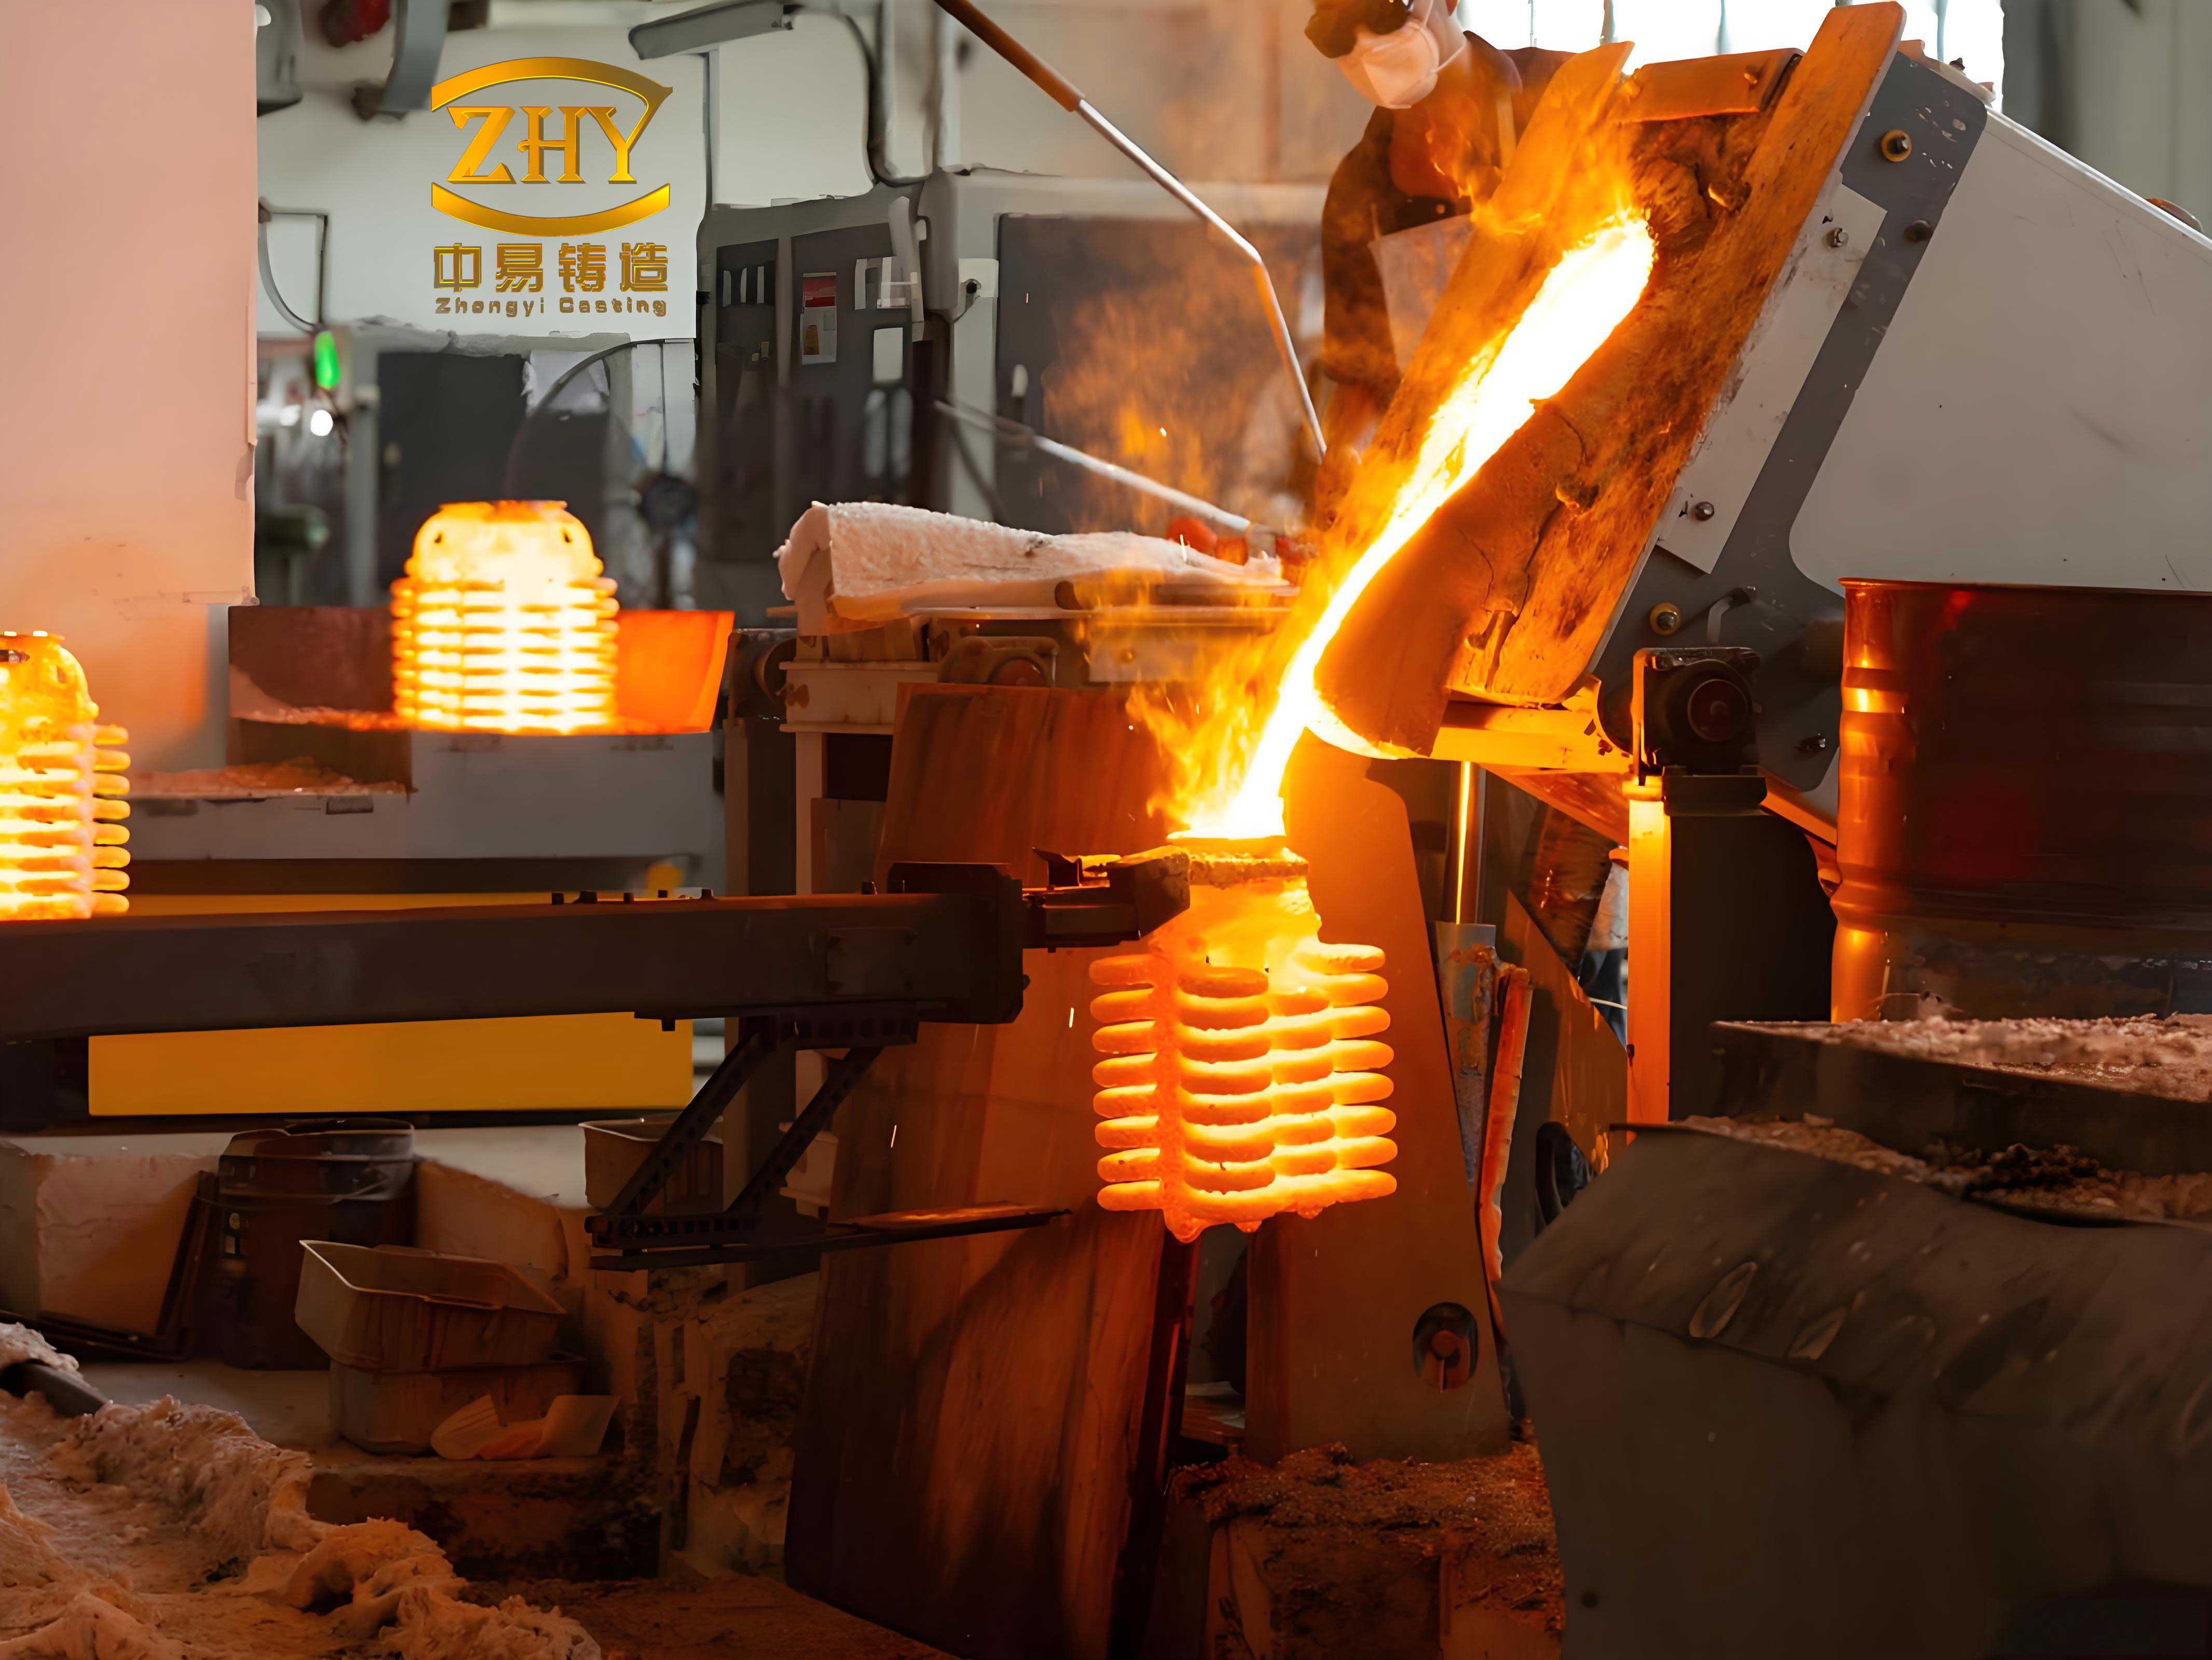
The process economics are less favourable than the metallurgy. Many工序 steps, long drying and firing cycles, and a large number of interacting variables mean that a complex thin-walled part can require repeated trials before an acceptable yield is reached. That is precisely the gap that casting simulation addresses: the filling and solidification sequence can be inspected before a shell is ever built.
Physics the Simulation Must Capture
Filling is treated as the flow of an incompressible liquid that obeys mass, momentum and energy conservation. The continuity equation for density ρ and velocity components ux, uy, uz is
$$\frac{\partial \rho}{\partial t}+\frac{\partial (\rho u_x)}{\partial x}+\frac{\partial (\rho u_y)}{\partial y}+\frac{\partial (\rho u_z)}{\partial z}=0$$
and the momentum balance in the x direction, with pressure P, body force Fx and kinematic viscosity ν, takes the Navier–Stokes form
$$\frac{\partial u_x}{\partial t}+u_x\frac{\partial u_x}{\partial x}+u_y\frac{\partial u_x}{\partial y}+u_z\frac{\partial u_x}{\partial z}=F_x-\frac{1}{\rho}\frac{\partial P}{\partial x}+\nu\nabla^2 u_x$$
with analogous expressions for the other two directions. The energy equation couples the advected temperature field to conduction and to any volumetric source term s:
$$\rho c\left(\frac{\partial T}{\partial t}+u_x\frac{\partial T}{\partial x}+u_y\frac{\partial T}{\partial y}+u_z\frac{\partial T}{\partial z}\right)=\lambda\left(\frac{\partial^2 T}{\partial x^2}+\frac{\partial^2 T}{\partial y^2}+\frac{\partial^2 T}{\partial z^2}\right)+s$$
Once the cavity is full, the problem becomes transient conduction through metal, shell and environment, with the latent heat released over the freezing interval carried by the solid fraction fs:
$$\rho c_p\frac{\partial T}{\partial t}=\lambda\left(\frac{\partial^2 T}{\partial x^2}+\frac{\partial^2 T}{\partial y^2}+\frac{\partial^2 T}{\partial z^2}\right)+\rho L\frac{\partial f_s}{\partial t}$$
Heat leaves the casting by conduction into the shell, and the shell loses heat to the surroundings by convection and radiation, the latter following the Stefan–Boltzmann law with surface emissivity below unity. In practice the metal–mould interface resistance is the single most influential boundary input; for a metal–sand contact it lies between roughly 300 and 1000 W·m⁻²·K⁻¹, and 500 W·m⁻²·K⁻¹ was adopted for the aluminum–ceramic shell pair in this case.
How Shrinkage Porosity Is Predicted
Shrinkage porosity arises from the competition between volumetric contraction and feeding. Liquid contraction and solidification contraction together exceed the solid-state contraction, so the liquid level inside the freezing skin falls; if no riser can supply metal through the remaining liquid channels, a macro-cavity forms. When the terminal liquid is broken into isolated pockets by growing grains, the result is dispersed micro-porosity instead.
Several criteria are used to locate these regions. The isothermal-curve method compares the time at which each point reaches the solidus, or a critical solid fraction of about 0.65, and flags any slow-freezing region enclosed by faster-freezing metal. The temperature-gradient method treats a small terminal gradient as an indicator of poor feeding. The most widely used criterion is that of Niyama, which combines the thermal gradient G and the cooling rate R:
$$\frac{G}{\sqrt{R}}=\frac{\sqrt{\left(\frac{\partial T}{\partial x}\right)^2+\left(\frac{\partial T}{\partial y}\right)^2+\left(\frac{\partial T}{\partial z}\right)^2}}{\sqrt{\dfrac{T_{upper}-T_{lower}}{t_{upper}-t_{lower}}}}$$
where Tupper and Tlower are the liquidus and solidus temperatures and tupper, tlower the times at which each is reached. Low values of G/√R indicate a high probability of porosity; the criterion is reliable for macro-shrinkage and is usually supplemented by a critical-solid-fraction test for dispersed porosity.
The Alloy and the Initial Top-Poured Design
The component is cast in A356, an Al–Si–Mg alloy selected for fluidity, pressure tightness and a small freezing range; its liquidus and solidus are 616 °C and 556 °C respectively. The specified composition is given below.
| Si | Mg | Cu | Fe | Mn | Zn | Al |
|---|---|---|---|---|---|---|
| 6.5–7.5 | 0.25–0.45 | ≤0.2 | ≤0.9 | ≤0.35 | ≤0.3 | Balance |
Density, thermal conductivity, enthalpy and solid fraction were taken as temperature-dependent functions from the software database rather than as constants, because each time step of the solution requires them at the local temperature. The latent heat of fusion was entered as 376 J/kg together with the enthalpy curve.
The initial gating design was a top-poured arrangement with five feeders: a central gate that also acts as a riser, three risers feeding the outer ring and blades, and a fifth riser feeding the inner ring. The assembly stands 460 mm tall, matches the 398 mm part diameter and has a gate area of about 60 cm². The part and gating were modelled in a CAD environment, meshed with a minimum surface element of 0.1 mm and a maximum of 5 mm, and converted to a 3 mm shell and a tetrahedral volume mesh of 1 973 358 elements. Pouring temperature was 750 °C, shell preheat 400 °C, and the fill time of 8 s corresponded to an inlet velocity of about 0.2 m·s⁻¹.
What the Initial Simulation Showed
Filling was orderly. Metal reached the bottom of the sprue at 0.5 s, filled the near-gate side by about 3.5 s, and had essentially filled the part by 4.5 s, with the pour complete at 8 s. No misrun or cold shut appeared. But the 3 mm blades split the flow: instead of rising uniformly, metal swept laterally along the upper ring and along the base, meeting on the far side, so that the last-filled blade region had already lost heat by the end of the pour.
The solidification sequence carried the real problem. The blades and the base cooled first, the casting fell below the solidus at around 820 s while the central riser still held a solid fraction of only about 0.27, and the assembly was fully solid by 1560 s. Because the blades freeze early and the base freezes late, the base cannot be fed through the blade network, and the gating provides too little metallostatic head to overcome the resistance of the thin inner-ring cavity. The predicted defect field was a continuous ring-shaped band of shrinkage at the bottom of the casting, with a plotted shrinkage fraction between 0.67 and 1.33, together with minor porosity at the inner ring and in the risers. Re-running the simulation with different pouring temperatures and speeds shifted neither the location nor the severity of the band, which identifies the gating geometry, not the process window, as the controlling variable.
Stepped Side Gating with a Reverse Sprue
The replacement design abandons top pouring. The part is stood on edge and fed from a stepped side system with a reverse sprue, which raises the effective metallostatic head without increasing the mould height. Ingates are distributed over both annular faces of the impeller at different heights, so that metal enters the cavity uniformly from both sides rather than jetting across it. Inclined ingates — 7° on the left, 3° on the right — cushion the incoming stream and improve feeding of the ring faces during solidification. Two channels connect the top of the casting to the gating, reinforcing top-up feeding, and the left sprue is run non-pressurized so that metal is introduced layer by layer from the bottom upward. Runner cross-sections are enlarged at the base, where the flow accelerates, to avoid turbulence at the ingate roots.
Re-meshed and re-solved with the same 750 °C pour, 0.1 m·s⁻¹ inlet velocity and 400 °C shell, the new system fills in the intended order: bottom runners at 1.0 s, the right cavity at 1.2 s, both sides by about 2 s, the right middle ingate at 2.5 s and the upper ingates at 4 s, with the cavity full at 8 s. After filling, the left sprue remains above 723 °C, the right sprue falls from 723 °C at the base to about 703 °C at the top, and the casting body sits between 670 and 690 °C, with the outer blade region down to about 650 °C. The casting is fully solid at 835 s and the whole assembly at 1870 s. Porosity is now confined largely to the right annular face and the gating itself, at a small volume fraction, in contrast with the continuous band produced by top pouring.
Orthogonal Optimization of Pouring Parameters
With the gating fixed, three parameters were screened at three levels each in an L9(3³) orthogonal array: pouring temperature (720, 750, 780 °C), pouring speed (60, 80, 100 mm·s⁻¹) and shell preheat (300, 400, 500 °C). Two responses were recorded for each of the nine runs — the shrinkage fraction and the maximum effective stress — and combined into a single score in which lower is better:
composite score = shrinkage fraction (%) × 100 + maximum effective stress (MPa)
| Run | Pouring temperature (°C) | Pouring speed (mm·s⁻¹) | Shell preheat (°C) | Max. effective stress (MPa) | Shrinkage fraction (%) | Composite score |
|---|---|---|---|---|---|---|
| L1 | 720 | 60 | 300 | 136.6 | 0.702 | 206.8 |
| L2 | 720 | 80 | 400 | 127.4 | 0.715 | 198.9 |
| L3 | 720 | 100 | 500 | 133.7 | 0.733 | 207.0 |
| L4 | 750 | 60 | 400 | 128.6 | 0.720 | 200.6 |
| L5 | 750 | 80 | 500 | 113.2 | 0.646 | 177.8 |
| L6 | 750 | 100 | 300 | 129.4 | 0.705 | 199.9 |
| L7 | 780 | 60 | 500 | 128.0 | 0.688 | 196.8 |
| L8 | 780 | 80 | 300 | 121.1 | 0.673 | 188.4 |
| L9 | 780 | 100 | 400 | 130.8 | 0.726 | 201.4 |
| Level sum | Pouring temperature | Pouring speed | Shell preheat |
|---|---|---|---|
| Level 1 | 612.7 | 604.2 | 595.1 |
| Level 2 | 578.3 | 565.1 | 600.9 |
| Level 3 | 586.6 | 608.3 | 581.6 |
| Range R | 34.4 | 43.2 | 19.3 |
Run L5 is the best of the nine and L3 the worst. Pouring speed produces the largest range and therefore dominates the response, followed by pouring temperature and then shell preheat. Both temperature and speed show an interior optimum at level 2 — the score first falls and then rises as the factor increases — while the shell preheat improves monotonically up to 500 °C. The resulting combination is 750 °C pouring temperature, 80 mm·s⁻¹ pouring speed and 500 °C shell preheat. At this setting the predicted maximum effective stress is 113.2 MPa, located at the junction between the blade root and the lower ring, where the section freezes slowly and is loaded by the contraction of both the blade and the ring; shrinkage is confined to the gates and runners, which are cut off after casting, and the part body is free of predicted porosity.
From Simulation to Metal: Pattern, Shell and Pour
Verification used a medium-temperature wax, WM36-4 (melting point 78 °C, linear shrinkage 0.6%, tensile strength 4.5–5.0 MPa, ash 0.02%), injected on a horizontal hydraulic wax machine rated at 7 MPa with a 30–80 °C temperature range. Injection pressure was set at 1.5–3 MPa, wax temperature 65 °C, die temperature 30 °C and dwell time 120 s; the moderate wax temperature fills the thin blade sections while limiting pattern shrinkage. Patterns were trimmed, patched, cleaned and wiped before assembly.
The shell used a colloidal silica binder (GRJ-30: 29–31% SiO₂, ≤0.5% Na₂O, pH 9–10, density 1.20 g·cm⁻³, viscosity ≤8 mm²·s⁻¹, particle size 9–20 nm) with fused quartz as the face-coat refractory and bauxite for the backup layers. Fused quartz has the lowest thermal expansion of the common refractories, which protects dimensional accuracy at the blade surfaces, while bauxite provides strength and permeability at lower cost. Four layers were applied with progressively coarser stucco — 100/120, 30/60 and 16/30 mesh — under the drying schedule below.
| Layer | Refractory | Stucco | Temperature (°C) | Relative humidity (%) | Air speed (m·s⁻¹) | Drying time (h) |
|---|---|---|---|---|---|---|
| Face | Fused quartz | Fused quartz | 22–25 | 60–70 | None | 6–8 |
| Transition | Bauxite | Bauxite | 22–25 | 50–60 | 6–8 | ≥8 |
| Reinforcement | Bauxite | Bauxite | 22–25 | 40–60 | 6–8 | ≥12 |
| Sealing | None | None | 22–25 | 40–60 | 6–8 | ≥24 |
Dewaxing was carried out in a high-pressure steam autoclave, the rapid heating being used deliberately to melt the pattern before differential expansion can crack the shell. The shells were then fired at 950–1050 °C for 1 h to burn out residual wax and carbon and to develop strength, and brought to the 500 °C preheat identified by the orthogonal study.
The A356 melt was refined with 0.5 wt% hexachloroethane added in five portions to the depth of the bath, held for about 20 min at 750 °C and allowed to settle for 15 min before pouring. Gravity pouring was used, with the ladle kept full so that the stream never breaks; the pour followed the simulated condition of 750 °C metal into a 500 °C shell at 80 mm·s⁻¹. Castings cooled in air for 1–2 h, were shot-blasted and sawn free of the gating, and were given a T6 treatment to homogenise the structure and relieve residual stress.
The finished impeller showed no visible shrinkage porosity, met a dimensional tolerance grade of CT5–4 and a surface roughness of Ra 3.2 µm, and satisfied the service requirements. The gating and parameter set derived from the simulation therefore transferred to production without an intermediate trial.
What the Case Establishes and What It Does Not
Two conclusions follow from the comparison of the two gating concepts. First, for a part whose thin sections freeze before the heavy sections can be fed, parameter tuning cannot compensate for a geometry that imposes the wrong solidification sequence: changing pouring temperature and speed left the ring-shaped defect at the base unchanged, whereas re-routing the ingates removed it. Second, the value of simulation here is diagnostic rather than predictive in an absolute sense — the filling pattern, the freeze order and the location of the last-fed region are what direct the redesign, while the absolute defect fraction remains a relative indicator.
The limits of the study are equally clear. Gating design still relies largely on empirical rules and experience, and the manual control of pouring speed in the verification pour introduces scatter that the simulation cannot represent; of the three parameters screened, pouring speed had the strongest effect and is the one least precisely held in practice. The thermal boundary conditions, particularly the metal–shell interface coefficient, were taken from standard ranges rather than measured for this shell system, and the mechanical assessment was confined to a single scalar maximum effective stress rather than a full distortion analysis. These are the natural next steps if the approach is to be extended to other thin-walled impeller families.