
This study investigates the sand casting process optimization of ZG270-500 alloy shell components to minimize defects like porosity, shrinkage cavities, and insufficient pouring. Three gating system designs were evaluated using ProCAST simulation, with orthogonal experiments determining optimal parameters for defect reduction.
1. Introduction
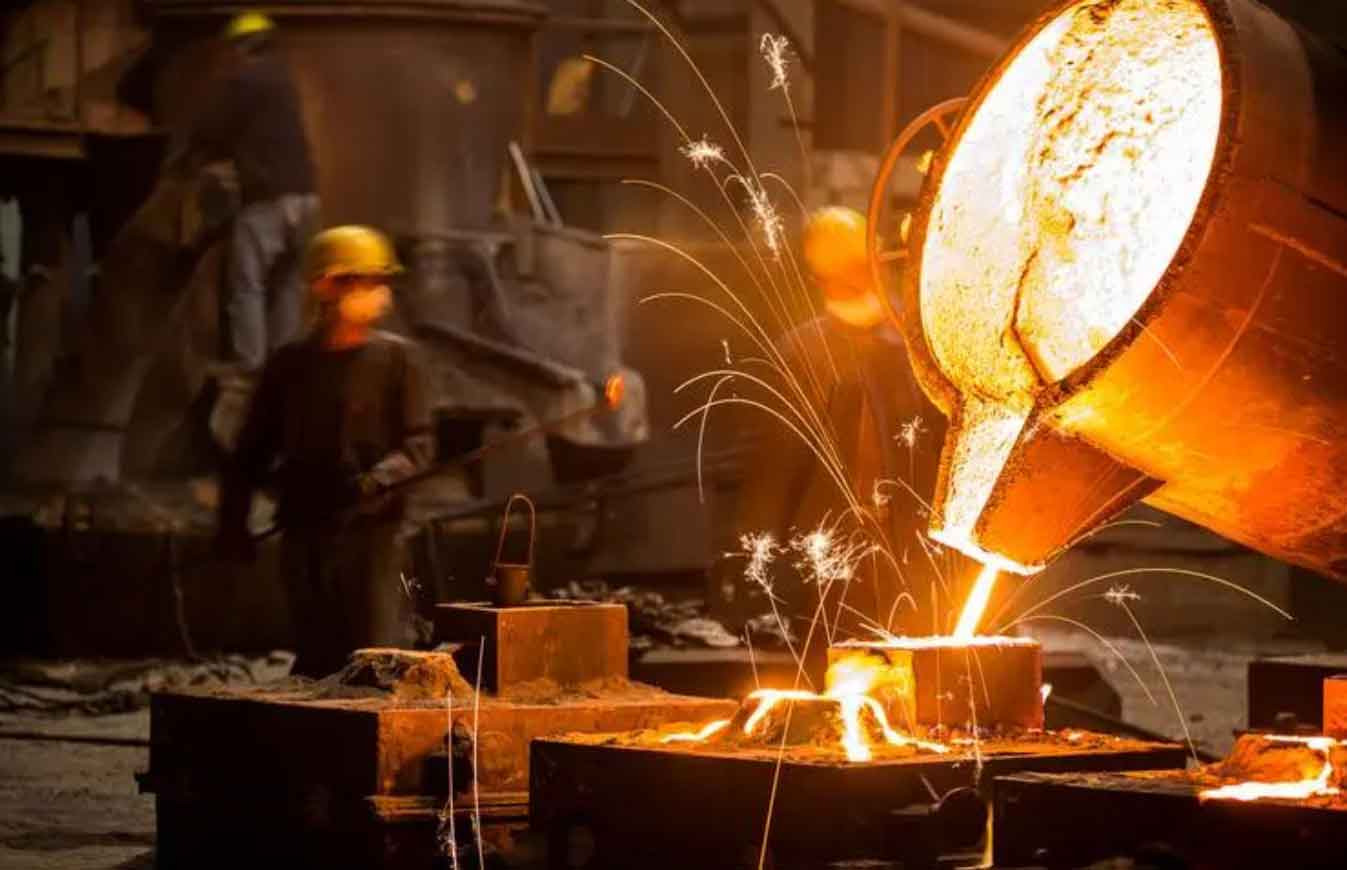
Sand casting remains a cost-effective method for producing complex steel components despite challenges in controlling shrinkage and gas entrapment. This research focuses on optimizing the sand casting process for a shell structure (392.93 kg, 812×525×356 mm) through numerical simulation and experimental validation.
2. Process Design
2.1 Material Composition
The chemical composition of ZG270-500 alloy is shown in Table 1, providing balanced strength and castability for sand casting applications.
| Element | C | Mn | P | S | Fe |
|---|---|---|---|---|---|
| Content (wt%) | 0.4–0.5 | 0.7–0.8 | ≤0.04 | ≤0.05 | Bal. |
2.2 Gating System Design
Three sand casting schemes were developed:
- Bottom gating at base section
- Side gating at cylindrical section
- Optimized system with four risers
The pouring time was calculated using:
$$ t = \frac{G_L}{N n q} $$
Where \( G_L \) = 450 kg (total metal weight), \( N \) = 1 (number of ladles), \( n \) = 1 (number of nozzles), and \( q \) = 27 kg/s (flow rate). This yielded \( t \) = 16.7 s with metal rise velocity:
$$ v = \frac{C}{t} = \frac{356\ \text{mm}}{16.7\ \text{s}} = 21.3\ \text{mm/s} $$
3. Numerical Simulation
3.1 Simulation Parameters
| Mesh size | 30 mm |
| Element count | 45,906 |
| Mold material | Silica sand |
| Heat transfer coefficient | 1,000 W/(m²·K) |
3.2 Defect Analysis
Initial schemes showed critical defects:
| Scheme | Shrinkage Volume (cm³) | Key Issues |
|---|---|---|
| 1 | 28.23 | Incomplete filling |
| 2 | 50.58 | Severe porosity |
| 3 | 1.42 | Optimal |
4. Process Optimization
4.1 Orthogonal Experiment
An L9 orthogonal array evaluated pouring parameters:
| Level | Temperature (°C) | Velocity (m/s) |
|---|---|---|
| 1 | 1,530 | 1.3 |
| 2 | 1,560 | 1.6 |
| 3 | 1,590 | 1.9 |
4.2 Range Analysis
| Parameter | K1 | K2 | K3 | Range |
|---|---|---|---|---|
| Temperature | 7.072 | 4.782 | 6.256 | 2.290 |
| Velocity | 5.905 | 5.683 | 6.527 | 0.844 |
Optimal parameters: 1,560°C pouring temperature with 1.6 m/s velocity.
5. Production Validation
The optimized sand casting process achieved:
- Defect reduction: 96% qualification rate
- Yield improvement: 66% process yield
- Mechanical properties meeting ASTM A148 standards
6. Conclusion
This study demonstrates that sand casting process optimization through numerical simulation effectively reduces defects in cast steel shells. The third scheme with optimized parameters (1,560°C, 1.6 m/s) minimized shrinkage porosity to 1.416 cm³, validating sand casting as a viable method for complex steel components.
$$ J = \sum_{i=1}^{n} (T_i – T_{opt})^2 + \alpha(v_j – v_{opt})^2 $$
Where \( J \) represents the quality optimization function, \( T_i \) and \( v_j \) are process parameters, and \( \alpha \) is weighting factor.