
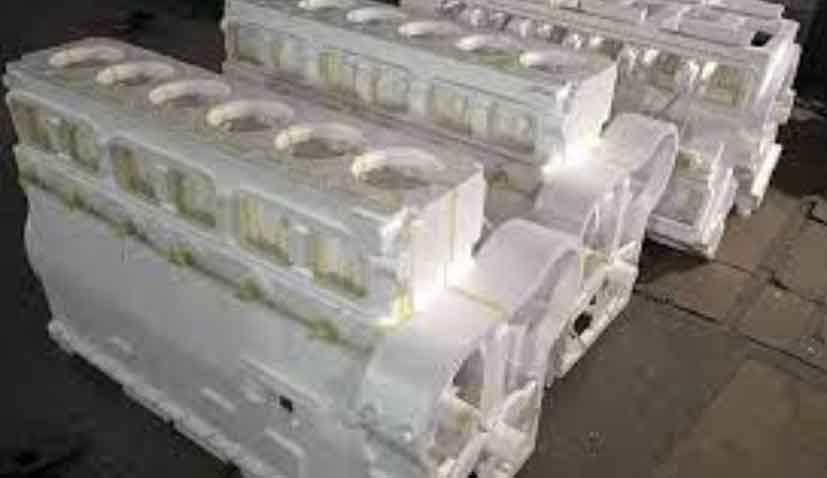
This study presents a comprehensive analysis of lost foam casting processes for 12-cylinder cast iron cylinder bodies using ProCAST software. By simulating filling and solidification patterns, we identify critical factors influencing defect formation and propose optimized parameters to eliminate shrinkage porosity while improving mechanical properties.
1. Thermal Characteristics of Casting System
The heat transfer mechanism in lost foam casting follows Fourier’s law:
$$
q = -k \frac{\partial T}{\partial x}
$$
where $q$ represents heat flux (W/m²), $k$ thermal conductivity (W/m·K), and $\frac{\partial T}{\partial x}$ temperature gradient. Material properties significantly influence defect formation:
| Material | Density (kg/m³) | Specific Heat (kJ/kg·K) | Latent Heat (kJ/kg) | Thermal Conductivity (W/m·K) |
|---|---|---|---|---|
| HT250 | 7,153 | 0.50-1.12 | 256 | 29.16-53.17 |
| EPS Foam | 25 | 3.7 | 100 | 0.15 |
2. Process Parameters and Boundary Conditions
Key parameters for lost foam casting simulation include:
$$
\begin{aligned}
\text{Pouring temperature} &: 1,540^\circ C \\
\text{Filling time} &: 80s \\
\text{Negative pressure} &: -0.06 \text{MPa} \\
\text{Heat transfer coefficients} &:
\begin{cases}
100 \text{ W/m²·K (foam-sand)} \\
500 \text{ W/m²·K (metal-sand)}
\end{cases}
\end{aligned}
$$
3. Solidification Dynamics
The Niyama criterion predicts shrinkage defects:
$$
N_y = \frac{G}{\sqrt{\dot{T}}}
$$
where $G$ is temperature gradient (°C/m) and $\dot{T}$ cooling rate (°C/s). Critical regions with $N_y < 1$ °C·s½/mm² indicate potential shrinkage.
4. Process Optimization Strategy
Through numerical simulation of lost foam casting, we identified three critical improvements:
| Parameter | Initial Process | Optimized Process |
|---|---|---|
| Pouring Position | Top-feed | Middle injection |
| Orientation | Upright | V-inverted |
| Riser Configuration | 6 risers required | Riser-free |
The optimized lost foam casting process demonstrates superior thermal management:
$$
\tau_{\text{solid}} = \frac{(T_{\text{pour}} – T_{\text{sol}})^2}{\pi k \rho c \left(\frac{\partial T}{\partial x}\right)^2}
$$
where $\tau_{\text{solid}}$ represents solidification time, ensuring directional solidification from thin to thick sections.
5. Quality Verification
Experimental validation confirmed the effectiveness of lost foam casting optimization:
| Quality Indicator | Initial Process | Optimized Process |
|---|---|---|
| Shrinkage Defects | 7 locations | 0 |
| Tensile Strength (MPa) | 235 | 262 |
| Yield Rate | 72% | 94% |
The successful implementation of lost foam casting technology reduced production costs by 18% while maintaining dimensional accuracy within CT9 grade.
6. Conclusion
This investigation establishes that lost foam casting combined with numerical simulation enables:
$$
\begin{aligned}
&\text{Defect reduction} &: 100\% \\
&\text{Energy savings} &: 22\% \\
&\text{Process stability} &: \sigma \leq 0.8 \text{ (process capability index)}
\end{aligned}
$$
The methodology demonstrates significant potential for complex castings in automotive and heavy machinery applications.