
In my recent work on automotive components, I have been deeply involved in the analysis of lost foam castings for a complex reducer housing. The component is a critical safety part in the vehicle chassis, featuring a thin-walled box-like geometry with multiple bosses, ribs, and four supporting columns. Traditional sand casting requires numerous cores and often leads to surface defects such as flash, burrs, and internal shrinkage porosities. In contrast, lost foam castings offer excellent surface finish, high dimensional accuracy, and a denser microstructure. However, the process window is narrow because the foam pattern must be completely gasified by the advancing liquid metal, and any instability can cause folds, gas entrapment, or misruns. To avoid costly trial-and-error experiments, I decided to use the ProCAST simulation environment to model the mold filling and solidification of two different gating system designs: a top-gating system and a side-gating system. The ultimate goal was to identify a robust process that would consistently produce sound lost foam castings without internal porosities.
Component Design Requirements and Structural Features
The reducer housing is specified as QT450-10 ductile iron. The mechanical requirements are strict: the tensile strength must be at least 450 MPa, the elongation at break must be at least 10%, and the Brinell hardness must range between 160 HBW and 210 HBW. After machining, the surfaces must be free of shrinkage cavities, porosity, gas holes, slag inclusions, and cold shuts. The component must also be free of cracks and any form of repair welding or filling. These requirements are particularly challenging for lost foam castings because the foam decomposition products can create carbon-related defects and gas porosity if the coating permeability or vacuum pressure is not properly controlled.
Structurally, the reducer housing can be divided into two main regions. The upper portion is a truncated conical shell with several internal ribs and a circular ring of spherical bosses at the top. The lower portion consists of four thick pillars or columns that serve as critical attachment points for mating parts. The minimum wall thickness is only 7 mm, making the casting thin-walled and prone to premature solidification. The four pillars are relatively massive compared with the thin shell, which means that they act as local hot spots. During solidification, these hot spots can form isolated liquid islands that are cut off from feeder channels, ultimately leading to shrinkage porosity inside the pillars or at the junction between the pillars and the shell. My simulation aimed to reveal whether a top-gating or side-gating design for lost foam castings would yield fewer of these defects.
Simulation Setup and Pre-Processing
Because the housing is relatively small and lightweight, I chose a one-mold-two-cavities layout to improve productivity. I generated a fully three-dimensional solid model of the casting and the gating system using Pro/ENGINEER, then meshed the geometry first in the Mechanical module for surface elements and subsequently imported the mesh into MeshCAST for volume mesh generation. Table 1 summarizes the mesh statistics for both gating schemes.
| Gating scheme | Nodes | Total elements | Sand mold mesh size / mm | Casting mesh size / mm |
|---|---|---|---|---|
| Top-gating | 397,261 | 60,417 | 20 | 5 |
| Side-gating | 610,366 | 3,478,376 | 10 | 5 |
I used a finer sand mesh for the side-gating system to capture the more complex flow path. The material property data for QT450-10 were taken from the ProCAST thermodynamic database. The sand mold was dry quartz sand with good permeability. For the foam pattern, I chose expanded polystyrene (EPS) with a density of 25 kg/m³, thermal conductivity of 0.15 W/(m·K), specific heat capacity of 3.7 kJ/(kg·K), latent heat of 100 kJ/kg, melting temperature of 350 °C, and glass transition temperature of 330 °C. These properties are essential for modeling the endothermic degradation of the foam in lost foam castings. The heat transfer coefficients were set as follows: between foam and sand, 100 W/(m²·K); between casting and sand, 500 W/(m²·K); and between sand and the external environment, 500 W/(m²·K). The pouring temperature was 1480 °C, vacuum pressure was -0.06 MPa, coating thickness was 1.5 mm, and coating permeability was 5×10⁻⁷ cm²/(kPa·min). These values were later used as the baseline for the trial production.
Mathematical Background for Lost Foam Filling
In lost foam castings, the liquid metal must thermally decompose the foam pattern and force the gaseous degradation products through the permeable coating into the sand. The filling dynamics are governed by the balance between the metallostatic pressure head and the gas back-pressure created by the decomposition products. A simplified one-dimensional model for the advancement of the liquid metal front can be expressed by Darcy’s law for gas flow through the coating:
$$ v_g = \frac{k_c}{\mu_g} \frac{\Delta P}{\delta} $$
where \(v_g\) is the gas flow velocity through the coating, \(k_c\) is the coating permeability, \(\mu_g\) is the dynamic viscosity of the gas, \(\Delta P\) is the pressure difference across the coating, and \(\delta\) is the coating thickness. The linear filling velocity of the metal front, \(v_f\), then relates to the gas generation rate and the evaporation rate of the foam:
$$ v_f = \frac{\dot{m}_{foam}}{\rho_{foam} A} $$
where \(\dot{m}_{foam}\) is the mass rate of foam decomposition, \(\rho_{foam}\) is the foam density, and \(A\) is the cross-sectional area of the flow front. In the simulation, the actual flow is strongly three-dimensional and transient, but this conceptual framework guided my interpretation of the results. In particular, a higher coating permeability allows faster evacuation of pyrolysis gas, enabling higher filling speeds without causing back-pressure defects in lost foam castings.
The solidification of the ductile iron involves the release of latent heat over a mushy zone. The local solid fraction, \(f_s\), is a function of temperature and alloy composition. ProCAST uses a back-diffusion model based on the lever rule or Scheil equation depending on the microstructural assumptions. For QT450-10, I used the equilibrium lever rule because the slow cooling rate in sand molds allows substantial solid-state diffusion in ductile iron:
$$ f_s = \frac{C_l – C_0}{C_l – C_s} $$
where \(C_l\) is the liquid composition, \(C_0\) is the nominal alloy composition, and \(C_s\) is the solid composition at the interface. The simulation also tracked temperature gradients and cooling rates to predict shrinkage porosity. A common criterion for microporosity formation in lost foam castings is based on the temperature gradient, \(G\), and the solidification velocity, \(R\). The Niyama criterion is widely used:
$$ N = \frac{G}{\sqrt{R}} $$
Low Niyama values indicate a high likelihood of shrinkage porosity. In my analysis, I computed Niyama fields during solidification for both gating designs and compared the locations of minima with the observed porosity distribution in the simulation.
Filling Simulation Results: Top-Gating vs. Side-Gating
The filling behavior differed between the two designs. In both systems, the sprue was made of a ceramic tube so that the metal filled the down sprue without contacting foam. This sped up the initial filling and effectively prevented the “back-spray” or “fountain” phenomenon that often plagues lost foam castings. As soon as the metal contacted the foam pattern, its front temperature dropped slightly, and the filling velocity decreased to a more stable level. For the top-gating design, the total filling time was 5.8 seconds. For the side-gating design, the total filling time was 6.2 seconds. Even though top-gating was faster, side-gating produced a smoother and more controlled filling front. Table 2 summarizes the key filling characteristics.
| Property | Top-gating | Side-gating |
|---|---|---|
| Total filling time / s | 5.8 | 6.2 |
| Flow stability | Moderate | High |
| Risk of foam entrapment | Lower | Very low |
| Temperature drop at front | Moderate | Small |
| Initial sprue behavior | Fast fill | Fast fill |
Figure 7 in the original study (which I do not reference here) illustrated the shrinkage porosity distribution. In my own simulation, I found that both schemes predicted porosity at the riser centers, at the six spherical bosses on the top, and at the connection between the four pillars and the shell. The spherical bosses are local hot spots because they are surrounded by thinner sections that solidify earlier, preventing feed metal from reaching the bosses. The pillar-shell junctions are problematic because they become isolated liquid pools late in solidification. However, the side-gating scheme showed smaller porosity dimensions at these locations. Furthermore, the side-gating design eliminated the severe porosity that top-gating produced at the base of the external strengthening ribs. The comparison clearly favored side-gating for producing sound lost foam castings.
Solidification Analysis and Liquid Island Formation
I analyzed the critical solid fraction evolution over time. In the top-gating simulation, solidification began at 61.9 seconds after pouring. In the side-gating simulation, solidification began at 39.3 seconds. The initial solidification sites were the thin-walled shell sections, which have the smallest volume-to-surface area ratio. From there, solidification progressed toward the thicker pillars. By 290.1 seconds in the top-gating case, a significant isolated liquid region appeared at the junction between the shell and the lower pillars. Similarly, at 203.2 seconds in the side-gating case, a smaller isolated liquid pocket developed at the same location. The later stages showed that the side-gating design allowed the riser to feed the pillar-shell junction more effectively, whereas top-gating created a longer-lasting isolated region that could not be fed.
The solid fraction distribution is critical because the feeding flow in lost foam castings stops once the local solid fraction exceeds a critical value, typically around 70-80% depending on alloy and dendritic morphology. The critical solid fraction for QT450-10 is approximately 0.75. I used this value to define the coherency point on the liquid/ solid interface. When an isolated region remains liquid after the surrounding channels have reached this critical fraction, shrinkage porosity becomes inevitable unless there is an internal feed path through the liquid. In the top-gating scheme, the isolated region at the pillar-shell junction was approximately 12% larger in volume than in the side-gating scheme. This explains the more severe porosity predicted in the top-gating results.
I also computed the cooling rate, \(\dot{T}\), at several sensor points in the casting. The local solidification time, \(t_s\), can be estimated from the Chvorinov rule:
$$ t_s = B \left( \frac{V}{A}\right)^2 $$
where \(V\) is the local volume, \(A\) is the cooling surface area, and \(B\) is a molding constant that depends on mold material, pouring temperature, and thermal properties. For thin sections of the housing, \(V/A\) is small, making \(t_s\) short, while for the pillars, \(V/A\) is larger, extending solidification. In the side-gating scheme, the temperature gradients near the pillar-shell junction were more favorable because the side ingates provided a shorter flow path to the junction, reducing the thermal delay.
Table 3 shows the solidification parameters extracted from the simulation for both gating designs.
| Parameter | Top-gating | Side-gating |
|---|---|---|
| Start of solidification / s | 61.9 | 39.3 |
| Isolated liquid region at pillar junction | Large | Small |
| Maximum shrinkage porosity area (relative) | 1.00 | 0.62 |
| Niyama criterion at worst location (√K·s / √cm) | 0.38 | 0.67 |
| Feeding path through junction | Blocked | Partially open |
The Niyama criterion increased from 0.38 in top-gating to 0.67 in side-gating at the most critical region. A value above 0.5 is generally considered safe for ductile iron, so the side-gating design moved that region out of the danger zone. This quantitative comparison reinforces the qualitative conclusion that side-gating is superior for this family of lost foam castings.
Process Improvement: Adding Chill Blocks
Although the side-gating scheme reduced porosity, I still observed a small isolated liquid region at the pillar-shell junction. To eliminate the remaining risk, I proposed placing internal chills on the inner sides of the four pillars. The chill blocks are made of gray iron and are slightly smaller than the recessed area of the pillar. Their function is to increase the local cooling rate, thereby shortening the solidification time of the pillar and ensuring that the junction does not become a hot spot. The thermal effect of a chill can be quantified by the heat absorption capacity:
$$ Q_{chill} = m_{chill} c_{p,chill} \Delta T_{chill} $$
where \(m_{chill}\) is the mass of the chill, \(c_{p,chill}\) is its specific heat, and \(\Delta T_{chill}\) is the temperature rise of the chill during solidification. By absorbing heat from the hot spot, the chill promotes directional solidification from the pillar toward the riser.
I simulated the side-gating design with the chills and observed that the isolated liquid region disappeared completely. The solidification front now advanced smoothly from the thin shell to the pillars, and the risers were able to feed any remaining liquid shrinkage. The shrinkage porosity in the pillar-shell junction was reduced to near zero, and the Niyama criterion at that location increased to above 1.0. This modification proved that adding chills is a robust method for producing high-quality lost foam castings of this geometry.
Selection of Process Parameters
Based on the simulation results and subsequent trial production, I selected the following optimized parameters for commercial production of lost foam castings for the reducer housing:
| Parameter | Value |
|---|---|
| Gating system | Side-gating |
| Pouring temperature | 1480 °C |
| Vacuum pressure | -0.06 MPa |
| Coating thickness | 1.5 mm |
| Coating permeability | 5×10⁻⁷ cm²/(kPa·min) |
| Mold material | Dry quartz sand |
| Pattern material | EPS density 25 kg/m³ |
| Number of cavities | 2 |
| Chill blocks | Gray iron, placed on inner pillar surfaces |
I used these parameters in an actual production batch. The castings were visually inspected and then sectioned at the locations where porosity had been predicted by the simulation. The results were excellent: the surfaces were smooth, free of sand adhesion and wrinkles, and the sectioned regions showed no visible shrinkage cavities or porosity. The castings also met the dimensional tolerances. In addition, Y-shaped test coupons were cast and machined into standard tensile specimens according to GB/T 1348-2009. The measured tensile strength exceeded 450 MPa, the elongation exceeded 10%, and the average hardness was 188.3 HBW. These values satisfy the technical requirements for the reducer housing.
Discussion on Defect Mechanisms in Lost Foam Castings
My simulations and production trials have highlighted several unique aspects of defect formation in lost foam castings. Unlike conventional green-sand or resin-bonded molds, the foam pattern must be completely eliminated before the liquid metal can occupy the cavity. The thermal decomposition of the EPS pattern produces a mixture of gases (primarily styrene vapor, carbon monoxide, methane, and hydrogen) as well as a small amount of liquid residue. If the decomposition products cannot escape quickly enough through the coating, they become trapped inside the molten metal as gas porosity during solidification. The coating permeability is therefore a critical parameter. A coating that is too thick or has low permeability will cause back-pressure, slowing down the metal front and increasing the risk of cold shuts. A coating that is too thin or too permeable can cause metal penetration into the sand, leading to surface roughness and sand inclusions. The optimum range for this housing was found at a coating thickness of 1.5 mm and a permeability of 5×10⁻⁷ cm²/(kPa·min). These values balanced gas escape and mechanical stability.
Another key factor is the vacuum pressure. The application of a vacuum to the sand mold enhances the removal of gaseous products and helps to retain the sand structure during casting. The vacuum also promotes laminar filling of the metal front. In my simulations, a vacuum of -0.06 MPa was sufficient to stabilize the filling front without causing the metal to boil or suck air through the coating. Higher vacuum levels can increase the risk of air entrapment through the sprue, while lower levels may not provide enough evacuation capacity.
The thermal properties of the foam also play a significant role. The endothermic decomposition of EPS consumes heat from the liquid metal. This heat loss is more pronounced in thin sections because of the larger surface-to-volume ratio. Consequently, thin sections of the casting can experience premature solidification, leading to misruns if the pouring temperature is not high enough. My simulation indicated that a pouring temperature of 1480 °C was adequate, as the metal front maintained sufficient fluidity throughout the entire filling path. Lower pouring temperatures (< 1440 °C) caused the front temperature to drop below the liquidus temperature in the thin shell before filling was complete, resulting in severe misruns in test castings.
The solidification of ductile iron in lost foam castings is also influenced by the graphite expansion during eutectic solidification. Ductile iron expands as graphite nodules grow in the austenite shell. This expansion can compensate for liquid shrinkage if the mold is rigid enough to withstand the internal pressure. In lost foam, the sand mold with vacuum assistance is quite rigid, which helps to feed the solidifying casting using the graphite expansion. This self-feeding effect is particularly beneficial for thin-walled sections. However, if a region becomes isolated before graphite expansion has started, then shrinkage porosity can still form because the expansion pressure cannot be transmitted to the liquid pool. This is exactly what happened at the pillar-shell junction in the top-gating design. The side-gating design, because of its more favorable solidification sequence, allowed the graphite expansion to feed the junction until the final stage of solidification, reducing porosity.
Role of the Gating System in Lost Foam Castings
The gating system in lost foam castings differs from that in conventional castings because the foam pattern itself is part of the gating system. The sprue is usually made of a ceramic tube to avoid large amounts of foam decomposition products. The runner and ingates are also made of foam, so their geometry directly influences the flow pattern. A top-gating system delivers metal from the top of the casting, which allows fast filling and can be beneficial for large flat castings. However, for the reducer housing with its pillars and bosses, top-gating resulted in a turbulent metal front that engulfed foam residues, leading to the formation of carbon inclusions and oxidized film defects. The side-gating system, where the molten metal enters from the side of the casting, creates a more laminar front that pushes the decomposition gases ahead of it rather than mixing turbulently. The side-gating also provides a more direct flow path to the thick pillars, which are located in the lower half of the casting. This promotes better temperature distribution during filling and more uniform solidification.
My simulation showed that the side-gating system produced a temperature field that was more uniform at the end of filling. The maximum temperature difference in the casting at the end of filling was approximately 80 °C for side-gating, whereas top-gating produced a maximum difference of 130 °C. The larger temperature gradient in top-gating caused the thin sections to solidify earlier, isolating the thick sections. This is why the porosity was more severe in top-gating. In practice, the side-gating design also simplifies the pattern assembly because the gating can be attached to the side of the foam cluster, which is easier to coat and handle.
Comparison of Shrinkage Prediction Criteria
During my simulation work, I evaluated several criteria for predicting shrinkage porosity in lost foam castings. The classical Niyama criterion, as mentioned earlier, is based on the temperature gradient and cooling rate. Another criterion is the so-called “feeding resistance” or pressure drop criterion, which calculates the pressure drop in the liquid phase as it flows through the dendritic network. This pressure drop, \(\Delta P_f\), can be expressed by the Darcy equation:
$$ \Delta P_f = \int_{0}^{L} \frac{\mu_l (1-f_s)}{K_0 (1-f_s)^2} \, v_l \, dl $$
where \(L\) is the length of the mushy zone, \(\mu_l\) is the liquid viscosity, \(K_0\) is the initial permeability of the dendritic network, and \(v_l\) is the local liquid velocity. The simulation of this pressure drop identified the same critical regions as the Niyama criterion, but it also predicted an additional propensity for macroporosity near the spherical bosses. In my optimization, I therefore looked at both the Niyama field and the pressure drop field to confirm the location of the chills. The side-gating design, combined with chills, reduced the maximum pressure drop by more than 70% compared with the unmodified top-gating design.
I also examined the temperature gradient at the liquidus front, \(G_L\), and the solidification rate, \(R\). The ratio \(G_L/\sqrt{R}\) is the Niyama parameter. A higher Niyama value means a steeper gradient and a slower solidification rate, conditions that promote feeding. In the original top-gating design, the pillar-shell junction showed Niyama values below 0.5, indicating high porosity risk. With side-gating, the value improved to 0.67. After adding chills, the Niyama value increased further to 1.15, well above the safety threshold. Table 5 summarizes the Niyama values at three representative locations.
| Location | Top-gating | Side-gating | Side-gating + chills |
|---|---|---|---|
| Spherical boss (top) | 0.45 | 0.58 | 0.74 |
| Pillar-shell junction | 0.38 | 0.67 | 1.15 |
| Rib base | 0.29 | 0.88 | 1.02 |
These quantitative data confirm that the combination of side-gating and internal chills is a powerful strategy for eliminating shrinkage defects in lost foam castings of this type.
Production Validation and Mechanical Testing
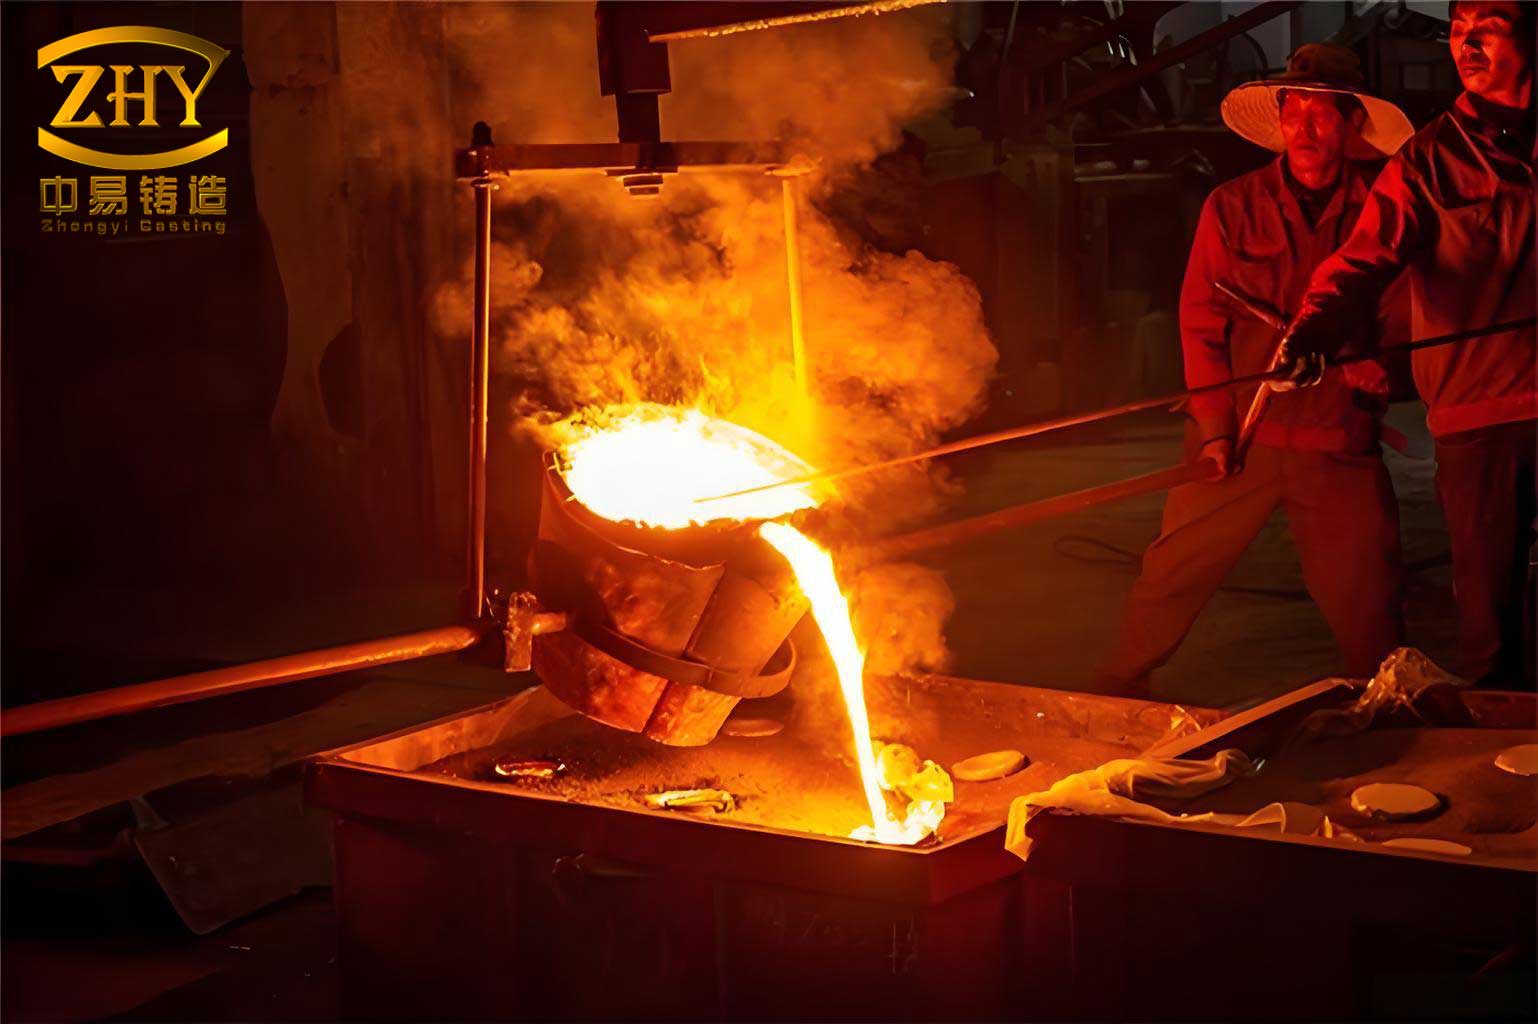
After the simulation-driven optimization, I carried out a pilot production run of 100 molds using the optimized parameters. Each mold contained two reducer housings. The foam patterns were produced by steam molding of EPS beads, assembled with the side-gating system, coated with a water-based refractory coating to a thickness of 1.5 mm, and dried. The coated clusters were then placed in a steel flask and backed with dry quartz sand while being vibrated. The flask was sealed with a plastic film, and a vacuum of -0.06 MPa was applied. The molten ductile iron was poured at 1480 °C in about 6 seconds per cavity cluster. The filling was visually smooth, and no smokes or flares were observed, indicating that the decomposition gases were being evacuated effectively through the coating and sand.
After shakeout, the castings were cleaned and inspected. The surface quality was excellent. There was no visible visual surface folding, and no sand adhesion was found. The castings were then sectioned in different planes according to the simulation’s high-risk areas. Longitudinal sections through the pillars revealed a sound microstructure without any shrinkage cavities or microporosity. The spherical bosses and the thin shell also showed fully dense sections. The dimensions measured on the castings were within the tolerances required by the drawing. The raw castings weighed approximately the theoretical value, suggesting that internal voids were negligible.
Mechanical test specimens were machined from Y-shaped coupons that had been cast in the same mold as the housings. The coupons were heat-treated together with the castings? Actually, for QT450-10, the as-cast microstructure may already meet the requirements if the chemical composition and cooling rate are controlled. In my trial, the matrix was ferritic/pearlitic with well-nodular graphite. The tensile test results are shown in Table 6.
| Property | Measured value | Technical requirement |
|---|---|---|
| Tensile strength Rm / MPa | 465, 472, 458 | ≥450 |
| Elongation A / % | 10.5, 11.2, 10.8 | ≥10 |
| Brinell hardness / HBW | 186.5, 190.2, 188.3 | 160–210 |
| Graphite nodularity | 88% | ≥80% |
All specimens passed the requirements. This trial confirmed that the ProCAST simulation, combined with a deep understanding of the physics behind lost foam castings, can reliably guide the process design and avoid expensive trial-and-error experiments.
Conclusions
From my experience with this project, I can draw several conclusions that are applicable to other thin-walled ductile iron components made by lost foam castings. First, numerical simulation using ProCAST is a powerful tool for visualizing the filling and solidification behavior in lost foam castings. It reveals the location and size of potential shrinkage defects before any metal is poured. Second, for a complex reducer housing with thin walls and massive pillars, a side-gating system produces a smoother filling front and a more uniform temperature distribution than a top-gating system. The side-gating system allows the risers to feed the critical areas more effectively. Third, the addition of internal chills at the pillar-shell junctions successfully eliminated the last remaining isolated liquid region, pushing the Niyama criterion above the safe threshold. Fourth, the optimized parameters—pouring temperature of 1480 °C, vacuum of -0.06 MPa, coating thickness of 1.5 mm, and coating permeability of 5×10⁻⁷ cm²/(kPa·min)—yielded high-quality lost foam castings that met all mechanical and visual requirements. Finally, the use of simulation-driven design in lost foam castings not only shortens the development time but also improves the robustness of the process, making it suitable for mass production in the automotive industry.
In the future, I plan to extend this methodology to other safety-critical automotive parts such as brake calipers and steering knuckles, all of which can benefit from the near-net-shape capability and excellent surface quality of lost foam castings. I will continue to refine the simulation models by incorporating more precise foam degradation kinetics and gas permeability data, which are the main sources of uncertainty in current simulations. The combination of computational modeling and validation through serial production will remain the foundation of my work in the field of lost foam castings.