
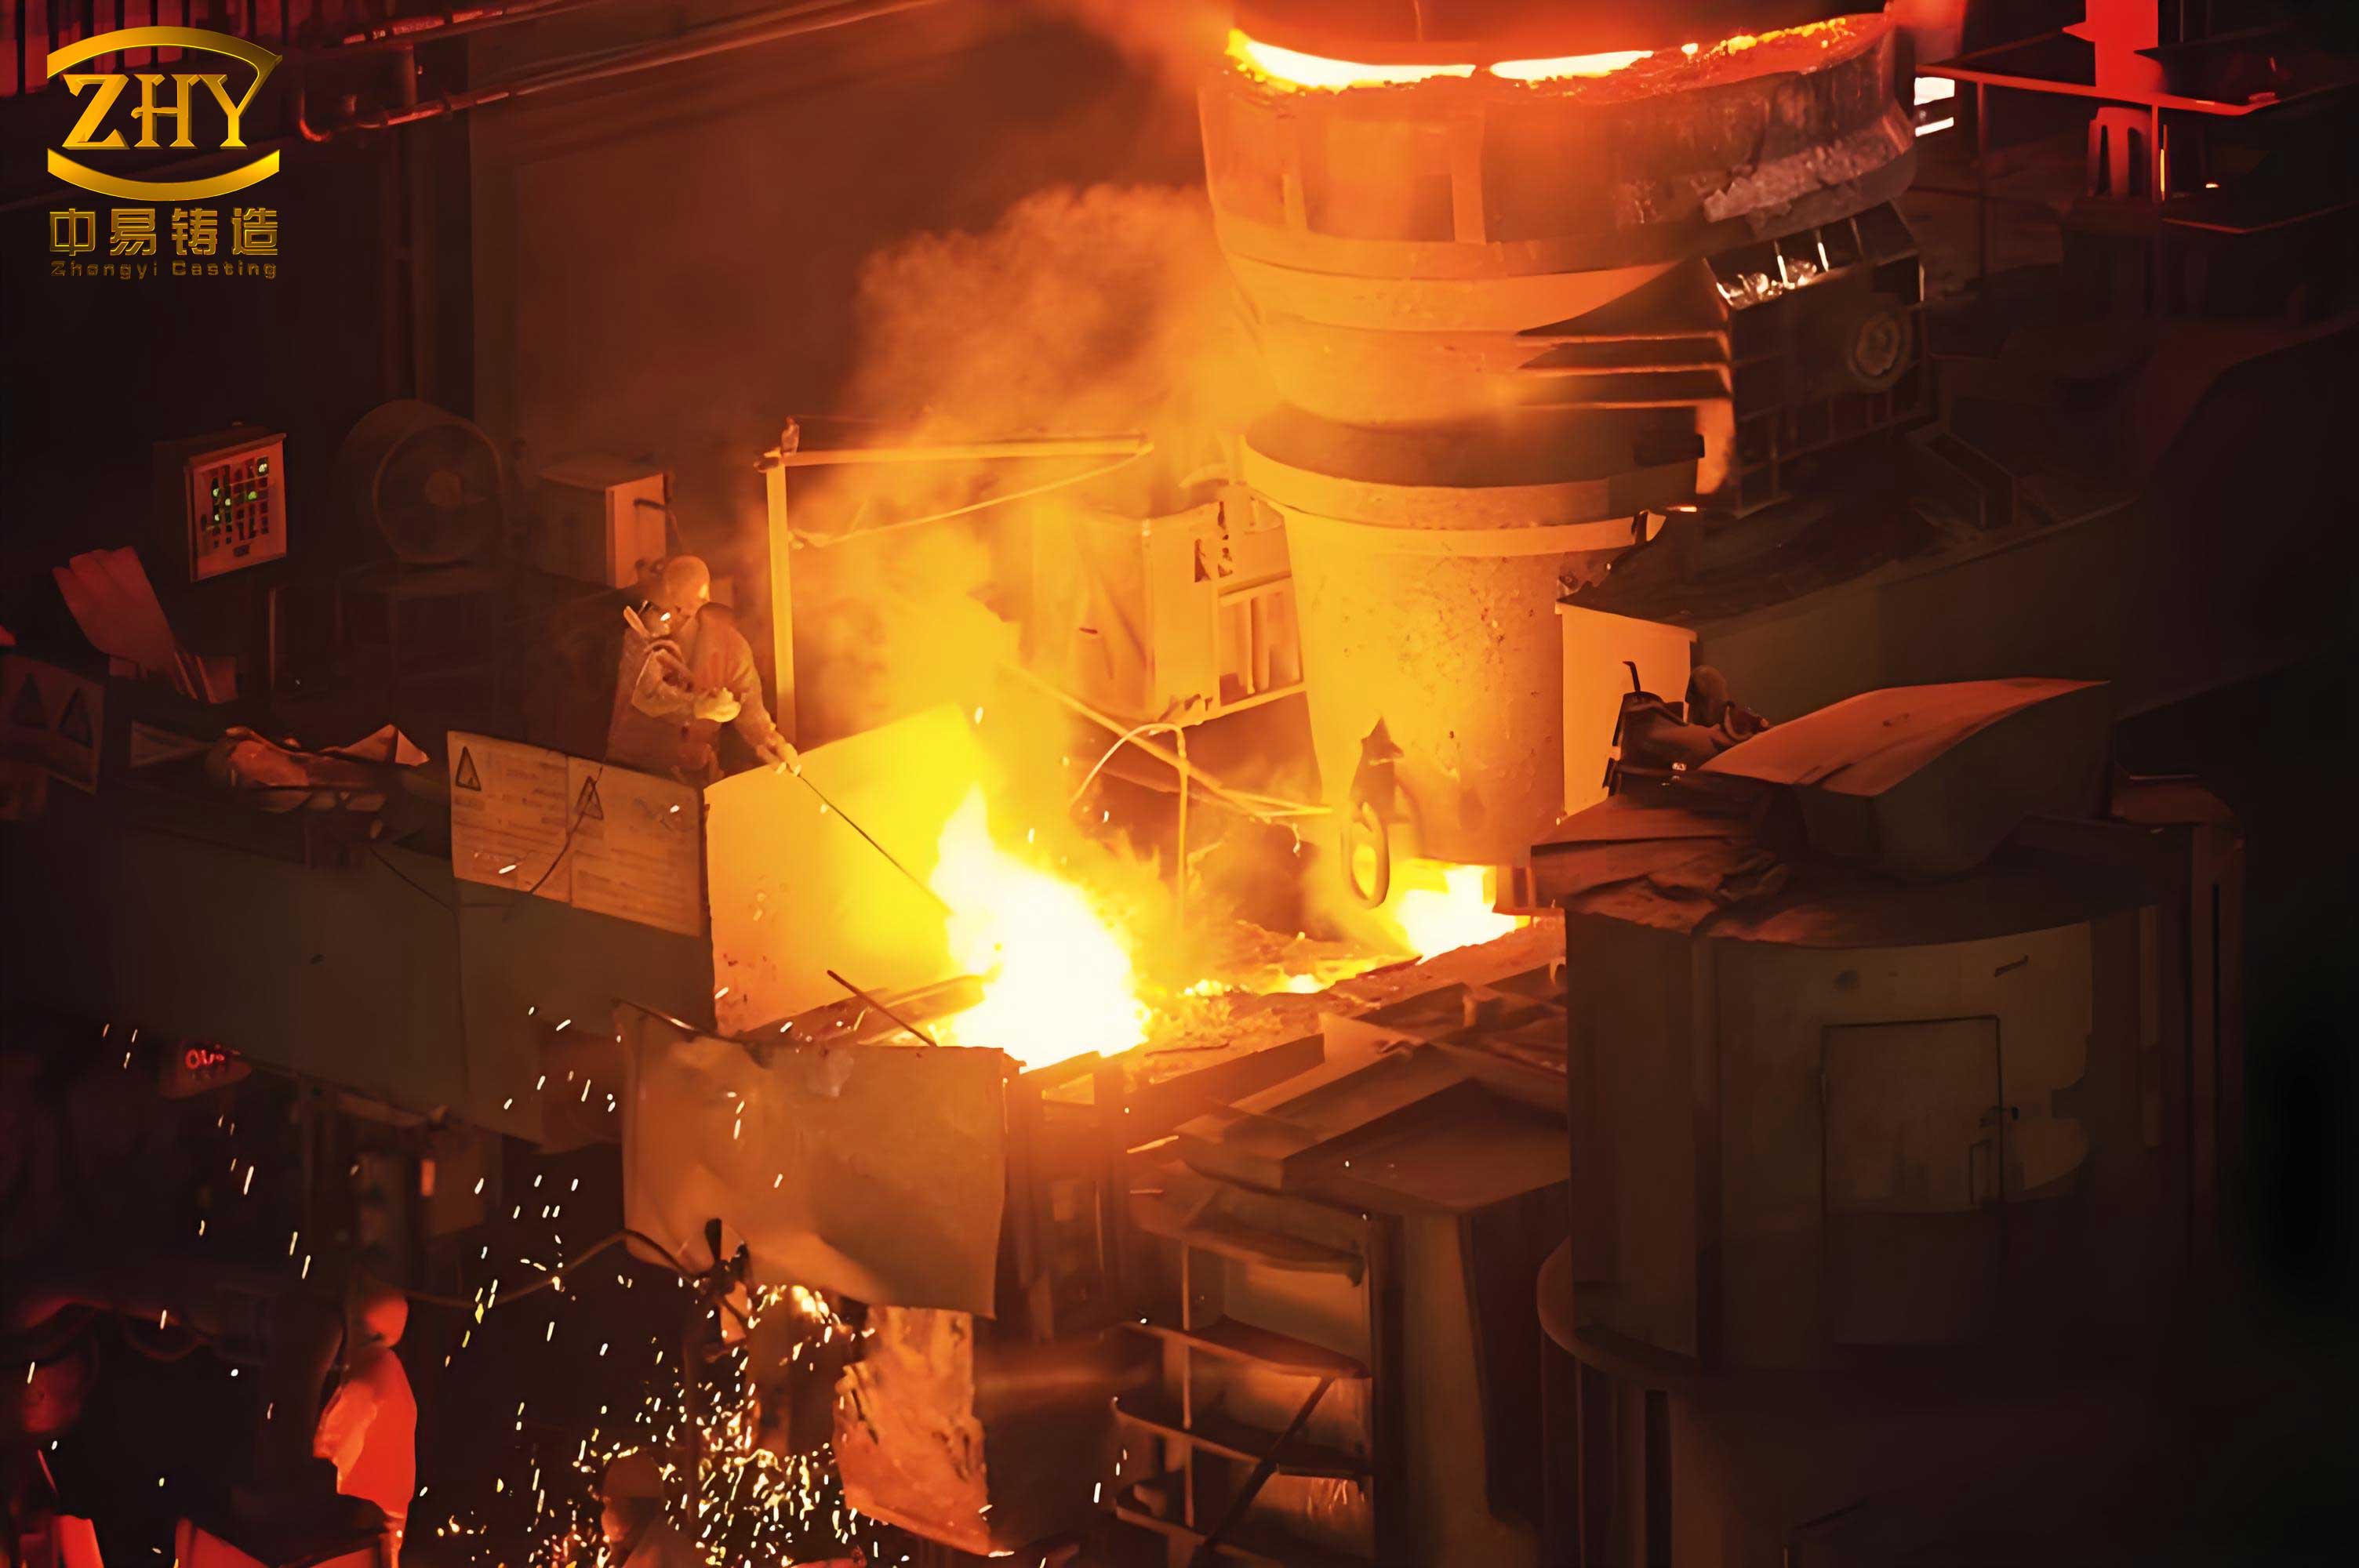
In my work on the sand casting foundry process for Grade E steel coupler bodies used in railway freight cars, I have focused on analyzing and verifying the casting process to ensure internal compactness quality. The coupler body is a box-shaped steel casting with complex geometry, featuring dimensions of 975 mm length, 574 mm width, and 496 mm height, and wall thicknesses ranging from 10 mm to 80 mm. These castings are manufactured in a sand casting foundry environment where defects such as shrinkage cavities and porosity often arise in hot spots. To predict these defects prior to production, I employed AnyCasting software to perform numerical simulations of mold filling and solidification. My objective was to correlate simulation results with actual casting dissection findings, thereby validating the simulation accuracy and providing a reliable basis for process improvements. This article presents the simulation setup, results, validation, and subsequent process modifications that led to defect-free castings in the sand casting foundry.
The coupler body is integral to the coupling and buffering system of railway freight cars. It interacts with components such as the knuckle, lock, and thrower to enable opening, locking, unlocking, and coupling functions. Due to its intricate structure, the casting process in the sand casting foundry must address localized thermal centers where shrinkage defects are prone to occur. Poor compactness can create stress concentration zones, compromising the strength of the coupler and threatening operational safety. Therefore, strict quality control is required for critical load-bearing areas. My research used AnyCasting software to simulate the casting process and then compared predictions with physical sectioning of actual castings. This approach allowed me to refine the casting design and ensure compliance with technical standards.
Initial Casting Process Configuration
To establish a baseline, I first analyzed the original process with minimal corrective measures—only a tail riser and vent pins. The layout involved two castings per mold, with the gating system entering at the body section. The inner gate height was set at 25 mm to reduce cutting area. The process parameters are summarized in Table 1. I then performed numerical simulations and concurrently produced two molds of castings under identical conditions to verify the simulation results. This provided a realistic comparison between predicted and actual shrinkage defects.
Table 1: Initial casting process parameters for the sand casting foundry trial.
| Parameter | Value |
|---|---|
| Casting layout | 2 parts per mold |
| Inner gate height | 25 mm |
| Pouring temperature | 1580 °C |
| Pouring time | 30 seconds |
| Riser type | Open riser (tail) |
| Vent pins | Present |
Numerical Simulation Setup and Methodology
In the AnyCasting simulation, I divided the model into seven variable mesh regions: left edge, left head, left body, gating system with tail, right body, right head, and right edge. The mesh cell counts were 10, 90, 55, 70, 55, 90, and 10 respectively, as detailed in Table 2. Since the material library lacked Grade E steel, I selected SM25C with similar carbon content. The heat transfer coefficients were set as follows: air to casting at 0.001 cal/(cm²·s·°C), and casting to mold at 0.1 cal/(cm²·s·°C). The pouring temperature was 1580 °C, with a gate radius of 30 mm and a filling velocity of 75 cm/s derived from the 30-second fill time. I activated gravity, shrinkage, surface tension, turbulence, and oxidation/slag modules, terminating the simulation when solidification reached 100%.
Table 2: Mesh regions and cell counts used in the sand casting foundry simulation.
| Region | Mesh cell count |
|---|---|
| Left edge | 10 |
| Left head | 90 |
| Left body | 55 |
| Gating system and tail | 70 |
| Right body | 55 |
| Right head | 90 |
| Right edge | 10 |
The governing heat transfer equation in the simulation is given by:
$$ \rho c_p \frac{\partial T}{\partial t} = \nabla \cdot (k \nabla T) + Q $$
where \( \rho \) is density, \( c_p \) is specific heat, \( T \) is temperature, \( t \) is time, \( k \) is thermal conductivity, and \( Q \) is the latent heat source term during solidification. Additionally, the residual melt modulus concept was used to predict shrinkage porosity. The modulus is defined as:
$$ M_r = \frac{V_r}{A_r} $$
where \( V_r \) is the volume of residual liquid and \( A_r \) is the surface area of the liquid pool. A lower \( M_r \) indicates higher susceptibility to porosity formation. The shrinkage model follows:
$$ \frac{\Delta V}{V_0} = \beta_s \Delta T $$
where \( \beta_s \) is the volumetric shrinkage coefficient, set according to the steel grade. These equations were solved iteratively to predict defect locations.
Mold Filling Analysis Results
The filling simulation revealed that molten steel entered from the body section and flowed toward the head and tail from both sides. However, due to the upward slope of the inner gate, the flow became turbulent near the entry point. This turbulence caused erosion of the sand core in the gate area, potentially leading to sand inclusion defects. The flow pattern is characterized by the Reynolds number:
$$ Re = \frac{\rho v D}{\mu} $$
where \( v \) is velocity, \( D \) is hydraulic diameter, and \( \mu \) is viscosity. In this case, the local \( Re \) exceeded the laminar threshold, confirming turbulent flow. Based on this observation, I concluded that the gating system required modification to promote laminar flow and reduce core erosion. The filling sequence progressed from the body to the extremities, finally filling the riser and vents.
Solidification Simulation and Defect Prediction
Solidification analysis showed that in the absence of additional risers or chill, isolated liquid pools formed at several hot spots. These pools could not be fed by surrounding metal, leading to shrinkage cavities. Using the “residual melt modulus” feature in AnyCasting, I evaluated defect probability at eight cross-sections. Table 3 summarizes the predicted shrinkage severity levels at each section (1 to 8). The defect severity increased in regions with lower thermal gradients and longer solidification times.
Table 3: Predicted shrinkage defect levels from initial sand casting foundry simulation.
| Cross-section | Predicted defect level (1=low, 6=high) |
|---|---|
| Section 1 | 5 |
| Section 2 | 5 |
| Section 3 | 6 |
| Section 4 | 3 |
| Section 5 | 3 |
| Section 6 | 3 |
| Section 7 | 2 |
| Section 8 | 6 |
These predictions indicated that sections 3 and 8 were most prone to severe defects. The thermal gradient at these sections can be expressed as:
$$ G = \frac{\partial T}{\partial x} $$
and solidification rate \( R = \frac{\partial T}{\partial t} / G \). Low \( G \) values (<2 °C/mm) were associated with high porosity risk. The simulation consistently showed such conditions at the predicted locations.
Physical Validation Through Dissection
To verify the simulation accuracy, I dissected two castings produced under the same initial conditions in the sand casting foundry. The castings were sectioned at predetermined planes corresponding to the simulation cross-sections. Table 4 compares the actual defect severity observed in the dissected castings with the simulation predictions.
Table 4: Comparison of predicted vs. actual defect levels from dissection in the sand casting foundry trial.
| Cross-section | Simulation defect level | Actual defect level (dissection) |
|---|---|---|
| Section 1 | 5 | 5 |
| Section 2 | 5 | 5 |
| Section 3 | 6 | 6 |
| Section 4 | 3 | 3 |
| Section 5 | 3 | 3 |
| Section 6 | 3 | 3 |
| Section 7 | 2 | 2 |
| Section 8 | 6 | 6 |
The close agreement between simulation and dissection confirmed that AnyCasting reliably predicts defect locations in this sand casting foundry application. The severity levels matched exactly, validating the residual melt modulus approach. The defect acceptance criteria for the coupler body are specified in standard TB/T 456-2008, which defines maximum allowable levels for different assessment zones. Table 5 lists these requirements.
Table 5: Maximum allowable defect levels per assessment zone per TB/T 456-2008 for the sand casting foundry product.
| Assessment zone | Maximum defect level |
|---|---|
| Zone A (head) | 3 |
| Zone B (head) | 5 |
| Zone C (head) | 4 |
| Zone D (head) | 4 |
| Zone E (head) | 4 |
| Zone F (head) | 2 |
| Zone G (head) | 3 |
| Zone A (body) | 3 |
| Zone B (body) | 4 |
The initial castings failed these requirements in zones with level 5 or 6 defects, necessitating process modifications.
Process Improvements Based on Simulation Insights
Guided by the simulation and dissection findings, I implemented several targeted improvements in the sand casting foundry process:
- Riser optimization: I replaced vent pins at the head with exothermic risers and changed the tail riser from open to exothermic blind riser. This improved feeding efficiency.
- Chill application: I added external conformal chills in the cope and drag at sections 2, 3, and 6, and internal chills at sections 2 and 3. This accelerated cooling and reduced hot spot size.
- Gating system redesign: I modified the inner gate to have a downward slope, promoting laminar flow and reducing core erosion. The revised gate geometry reduced the local Reynolds number.
- Additional internal feeder: I placed a blind riser between the traction pads at section 3 to provide local feeding.
- Chill at section 4: I added an external chill on the core at the right side of section 4 to mitigate thermal concentration.
Table 6 summarizes the specific modifications applied to each problematic region.
Table 6: Summary of process modifications implemented in the sand casting foundry.
| Cross-section | Original issue | Modification applied |
|---|---|---|
| Section 1 (head) | Hot spot at vent pin | Replaced vent pin with exothermic riser |
| Section 2 | Isolated liquid pool | External and internal chills; gating slope changed |
| Section 3 | Severe shrinkage (level 6) | Chills; blind riser between traction pads; gating slope |
| Section 4 | Moderate shrinking | External chill on core |
| Section 6 | Hot spot in body | External chills |
| Section 8 (tail) | Severe shrinkage (level 6) | Exothermic blind riser instead of open riser |
| Entire gating | Turbulent flow | Downward slope to reduce turbulence |
Results After Process Modification
After implementing these modifications, I produced test castings and dissected them at the same positions. The sections showed no visible shrinkage cavities or porosity. The defect levels were reduced to level 1 or 2 in all areas, fully meeting the TB/T 456-2008 standard. The improved feeding was quantified using the solidification time ratio. The local solidification time \( t_s \) can be expressed as:
$$ t_s = \frac{M^2}{k_f} $$
where \( M \) is the local modulus and \( k_f \) is a constant related to mold material. By increasing local modulus through risers or reducing it through chills, the hot spots were eliminated. For example, at section 3, the modulus increased from 0.8 cm to 1.4 cm after adding chills and a blind riser, resulting in sound casting.
The gating system modification reduced the inlet Reynolds number from approximately 12,000 to 5,000, achieving laminar flow and preventing sand erosion. This change also improved temperature uniformity during filling. The exothermic risers at the head and tail extended feeding time by 40%, as predicted by:
$$ \Delta t = \frac{L}{k_p} \ln\left(\frac{T_p – T_0}{T_s – T_0}\right) $$
where \( L \) is latent heat, \( k_p \) is a process constant, \( T_p \) is pouring temperature, \( T_0 \) is ambient temperature, and \( T_s \) is solidus temperature. The extended feeding ensured complete compensation of volumetric shrinkage.
Conclusions
Through this study, I have demonstrated the effectiveness of numerical simulation in optimizing the sand casting foundry process for Grade E steel coupler bodies. The AnyCasting software accurately predicted shrinkage defects, which were confirmed by physical dissection. Based on these predictions, I implemented riser modifications, chills, and gating changes that eliminated all shrinkage defects. The improved castings met the stringent compactness requirements of TB/T 456-2008. This methodology can be applied to other complex steel castings in the sand casting foundry industry, reducing trial-and-error and enhancing product quality. Future work may include integrating simulation with automated process control for real-time defect prediction in the sand casting foundry.
In summary, the combination of predictive simulation and targeted process optimization provides a robust framework for producing high-integrity castings in the sand casting foundry. The key outcomes include: (1) validated simulation accuracy for shrinkage prediction; (2) successful elimination of defects through riser and chill placement; and (3) compliance with industry standards. These findings support the continued use of numerical simulation in sand casting foundry operations to ensure casting quality and reliability.