
1. Introduction and Research Background
As one of the oldest metal hot-working techniques mastered by humanity, casting has always served as a fundamental process within the manufacturing industry. From the Bronze Age ritual bronzes of ancient China to the modern high-integrity components used in nuclear power and deep-sea engineering, the evolution of casting technology reflects the continuous pursuit of material performance and structural complexity. Among the various casting methodologies, sand casting remains the most widely adopted route, accounting for approximately 60% to 70% of global casting production. Its economic advantages, geometric flexibility, and suitability for producing massive components make it indispensable for manufacturing large structural steel parts.
However, the production of large steel castings is fraught with technical challenges. The inherently high pouring temperatures, substantial section thickness variations, and prolonged solidification times create favorable conditions for the formation of shrinkage cavities, porosity, hot tears, and inclusions. Statistics indicate that defects arising during casting operations account for approximately 12.7% of the annual output of steel castings, leading to enormous economic losses and resource waste. For a long time, foundries relied on trial-and-error approaches to rectify process-related problems, a methodology that is both time-consuming and costly. The advent of computational simulation, particularly through platforms such as ProCAST, has fundamentally transformed this paradigm by enabling the virtual prototyping of the entire casting process.
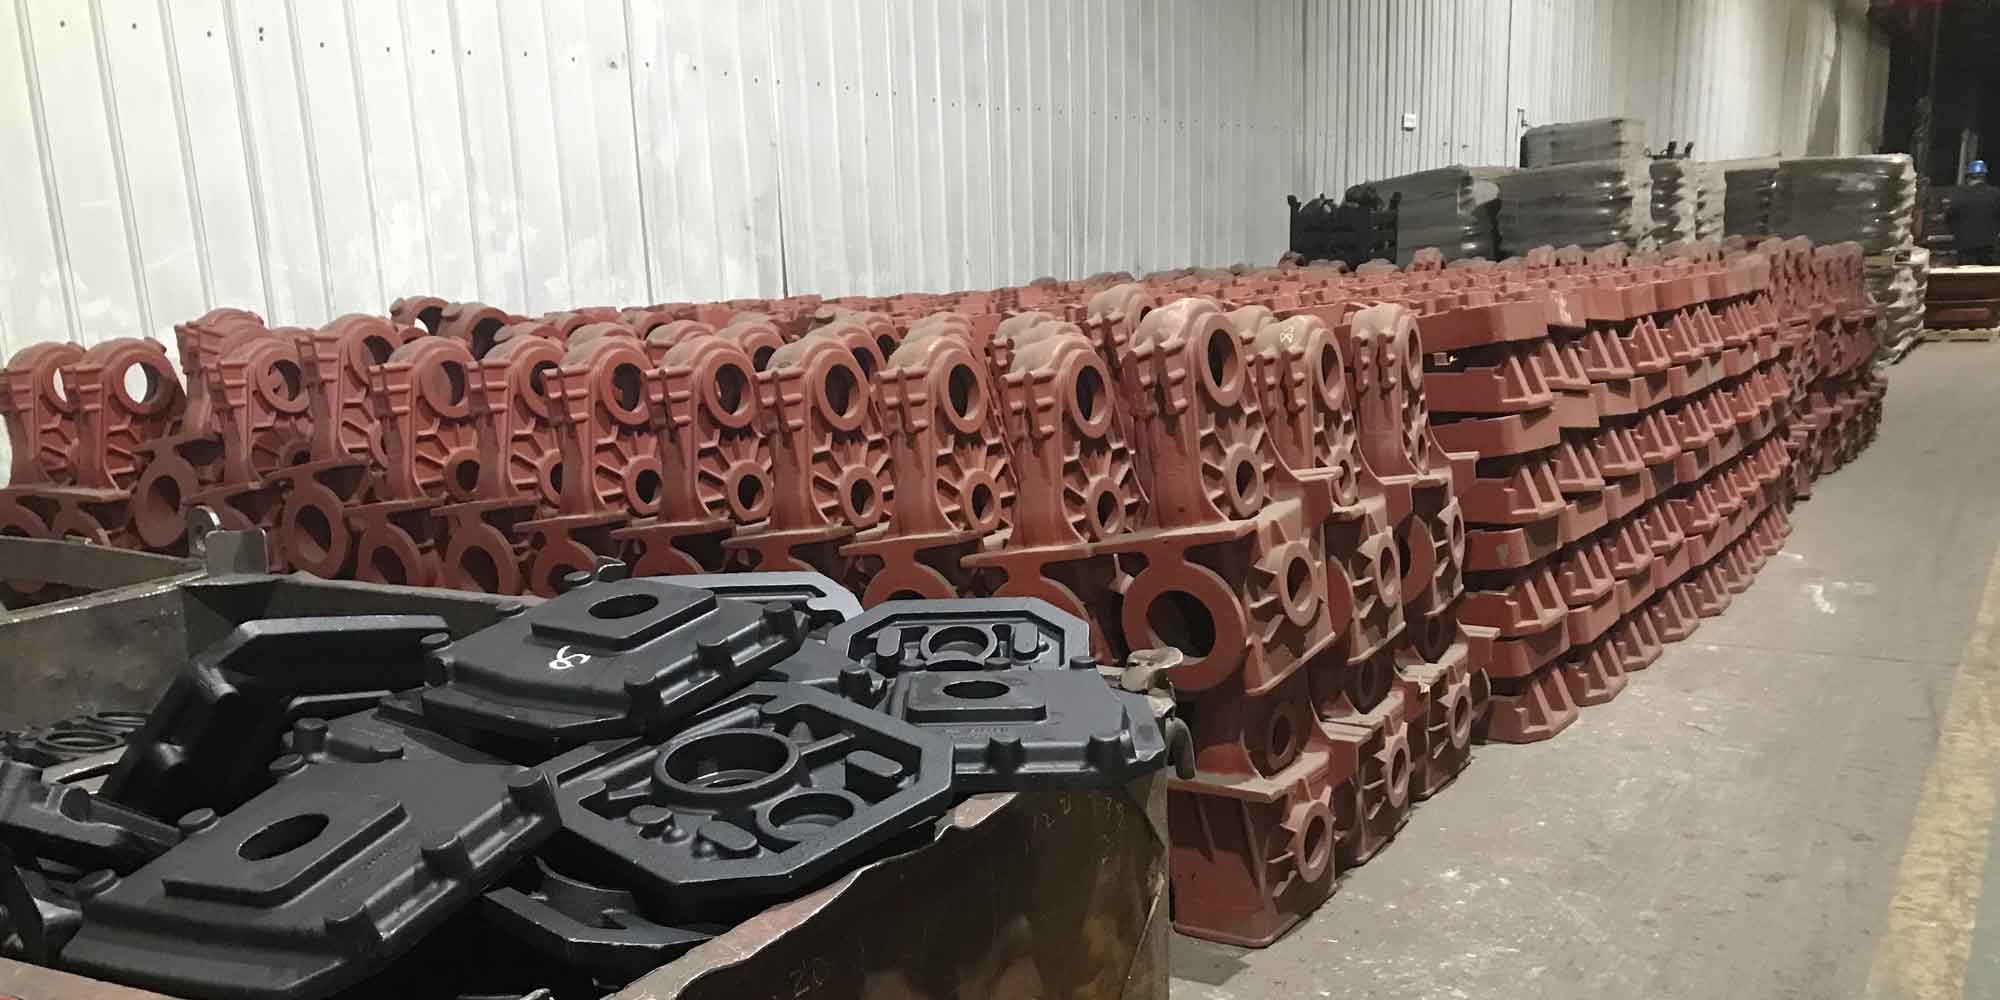
The present research addresses a critical industrial challenge: the frequent occurrence of shrinkage defects in top-loaded ball valve steel castings. These castings, unlike their side-entry counterparts, feature a large overall envelope, thick wall sections, and pronounced local wall-thickness differences. These characteristics significantly complicate temperature distribution control during mold filling and the establishment of effective feeding channels during solidification. The objective of this work is to systematically optimize the sand-casting process for such components through numerical simulation, defect prediction, and experimental verification, thereby enhancing the overall quality and reliability of these steel castings.
2. Literature Review and Research Status
2.1 Development of Sand Casting in China
Sand casting in China underwent remarkable transformations across several decades. During the 1950s to the 1970s, green sand molding dominated the production of small and medium-sized castings, whereas large components were predominantly manufactured using dry sand molds. The development of CO₂-sodium silicate bonded sands marked a significant breakthrough for steel castings. In the 1980s, the automotive industry’s demand for thin-walled precision components drove the adoption of high-density molding technologies, including static pressure and air-impact molding. Entering the 21st century, resin-bonded sands and 3D printing technologies have revolutionized the field, enabling unprecedented design freedom for gating systems and sand cores while reducing environmental impact.
2.2 Progress in Casting Simulation Technology
The origins of casting simulation date back to the 1940s when researchers at Columbia University conceptualized the “Heat and Mass Flow Analyzer” to numerically solve heat conduction problems. In 1962, V. K. Fursund of Denmark introduced the finite difference method to simulate the solidification heat transfer of castings. The subsequent decades witnessed the rise of commercial software platforms employing both Finite Element Method (FEM) and Finite Difference Method (FDM). The microstructural simulation era began in the 1990s, coupling cellular automaton with finite difference techniques to predict grain morphologies and micro-segregation. The current state-of-the-art integrates multi-physics coupling, artificial intelligence, and high-performance parallel computing to achieve robust predictions of flow fields, thermal fields, stress evolution, and defect formation.
2.3 Defect Prediction Methodologies
The prediction of shrinkage porosity and macro-shrinkage cavities occupies a central role in casting simulation. The Niyama criterion stands out as one of the most widely applied indicators, based on the local thermal gradient and cooling rate:
$$Ny = \frac{G}{\sqrt{R}}$$
where \(G\) is the temperature gradient and \(R\) is the solidification cooling rate. When the \(Ny\) value falls below a critical threshold (e.g., 1.1 for large steel castings), the risk of micro-porosity becomes significant. Other methods include the critical solid fraction criterion, the time-gradient method, and the thermal modulus approach. Modern simulation platforms also leverage flow-solidification coupling to trace feeding paths and identify isolated liquid pools that lead to macro-shrinkage defects.
3. Theoretical Foundations of Sand Casting Process Design
3.1 Casting Process Overview
The manufacturing route for large steel castings begins with pattern making, often via CNC machining of wooden models with appropriate shrinkage allowances. The mold is then prepared from resin-bonded sand, and cores are assembled to define internal cavities. Concurrently, melting is performed in medium-frequency induction furnaces followed by vacuum refining to achieve the desired chemistry and temperature. The molten steel is poured into the mold, allowed to solidify over a controlled cooling period, and subsequently subjected to shakeout, fettling, heat treatment, and rigorous non-destructive inspection.
3.2 Gating System Design
The gating system profoundly affects casting soundness by governing the flow pattern, filling velocity, and thermal gradients during pouring. The principal design objective is to ensure smooth, laminar filling without air aspiration or mold erosion. Gating systems may be classified as top-gating, bottom-gating, middle-gating, or step-gating based on the inlet position. The cross-sectional area ratios can be converging, diverging, or semi-diverging, each imparting distinct flow characteristics. For large steel castings with substantial hydrostatic heads, bottom-gating is generally preferred to minimize turbulence; however, it establishes an inverted temperature gradient that may compromise top riser efficiency. The selection of gating type requires a careful balance between filling dynamics and solidification feeding requirements.
3.3 Riser Design Based on Modulus Method
Risers serve as reservoirs of liquid metal to compensate for volumetric shrinkage during solidification. The modulus method, pioneered by Chvorinov, remains a widely used approach for riser sizing. The modulus \(M\) of a casting section is defined as the ratio of its volume \(V\) to its cooling surface area \(A\):
$$M = \frac{V}{A}$$
For riser design, the following condition must be satisfied to ensure that the riser solidifies later than the casting section it feeds:
$$M_r \geq K_c \cdot M_c$$
where \(M_r\) is the riser modulus, \(M_c\) is the casting modulus, and \(K_c\) typically ranges from 1.1 to 1.2 for top risers. For side risers, a more stringent ratio of \(M_c : M_n : M_r = 1 : 1.1 : 1.2\) is employed, where \(M_n\) denotes the modulus of the riser neck. Additionally, the riser must contain sufficient volume to account for both liquid and solidification contraction:
$$\eta V_r \geq \beta \left(V_r + V_c\right)$$
In this equation, \(\beta\) represents the total solidification shrinkage factor, and \(\eta\) corresponds to the riser efficiency. Table 1 summarizes typical efficiency values for various riser types commonly encountered in steel casting practice.
| Riser Type | Cylindrical | Spherical | Exothermic | Atmospheric | Gas-pressed |
|---|---|---|---|---|---|
| Efficiency (%) | 12–15 | 15–20 | 25–30 | 15–20 | 30–35 |
Exothermic/insulating riser sleeves significantly extend the solidification time of the riser by reducing heat losses. The effective modulus of a sleeved riser can be amplified as:
$$M_{eff} = 1.43 \cdot M_r$$
Thus, for the same solidification time, a sleeved riser may be substantially smaller than an equivalent sand riser, improving the process yield and reducing the amount of steel castings required per mold.
3.4 Chills and Their Role in Solidification Control
Chills are metallic inserts placed within the mold to locally accelerate cooling and thereby influence the solidification sequence. They are strategically positioned at hot spots or heavy sections to create preferential heat extraction, promoting directional solidification toward the risers. The chill thickness \(t_c\) is related to the casting section thickness \(\delta\) by an empirical relationship:
$$t_c = K \cdot \delta$$
Under various section-thickness ratios \(t/T\), the chill arrangement and dimensions must be selected to achieve the desired cooling effect. For large steel castings, the placement of a chill can significantly increase the effective feeding distance of risers, reduce the number and size of risers, and refine the local microstructure through rapid cooling. However, improper chill design may introduce cold shuts, excessive thermal stresses, or incomplete fusion. Thus, the positioning and sizing of chills must be carefully engineered, often with the aid of numerical simulation.
4. Numerical Model and Simulation Setup
4.1 Casting Description and Initial Process Plan
The component under investigation is a top-loaded ball valve body weighing approximately 5.76 tonnes, with overall dimensions of 1920 mm × 1406 mm × 1310 mm. Due to its structural complexity, the casting exhibits multiple hot spots at the flange-body junctions and thick central sections, where shrinkage defects tend to nucleate. The original foundry process consisted of a bottom-gating system with four symmetrically arranged ingates, six risers of varying dimensions, and several cold-iron placements. The layout is schematically illustrated in the process design drawings.
4.2 Three-Dimensional Modeling and Meshing
The complete casting assembly, including the casting itself, gating systems, risers, and chills, was modeled using NX 12.0 software. The assembly was exported in the STEP format and imported into the Visual-Mesh module of ProCAST. A virtual mold box measuring 5000 mm × 5200 mm × 4000 mm was created to represent the sand mold. The meshing strategy employed a multi-scale approach: a coarse mesh was adopted for the sand mold, whereas a fine mesh was applied to the casting body, the risers, and the chill regions to ensure accuracy in critical zones. Table 2 lists the mesh sizes for each component.
| Region | Mesh Size (mm) |
|---|---|
| Sand mold | 100 |
| Thick risers | 50 |
| Standard risers | 30 |
| Casting region | 10 |
| Chills | 10 |
Defect-free meshing resulted in approximately 90,000 surface elements and 460,000 volume elements, providing adequate resolution for the subsequent thermo-fluid analysis.
4.3 Material Properties and Boundary Conditions
The casting material selected for the valve body was WCB, a carbon steel grade commonly specified for pressure-containing parts. The chemical composition and mechanical properties of WCB are summarized in Tables 3 and 4. Since WCB is not predefined in the ProCAST database, a custom material model was established using the thermodynamic calculation engine inside the software. The computed liquidus and solidus temperatures were 1509°C and 1472°C, respectively. The specific heat, density, thermal conductivity, solid fraction, and mechanical properties (Young’s modulus, Poisson’s ratio) were all defined as functions of temperature according to the simultaneous calculations.
| Element | C | Si | Mn | P | S | Cr | Ni+Mo |
|---|---|---|---|---|---|---|---|
| Specification | 0.25–0.30 | ≤0.60 | ≤1.00 | ≤0.040 | ≤0.045 | ≤0.50 | ≤1.00 |
| Yield strength (MPa) | Tensile strength (MPa) | Elongation (%) | Hardness (HB) |
|---|---|---|---|
| ≥250 | ≥485 | ≥22 | 137–179 |
The sand mold was modeled as a resin-bonded sand with thermophysical properties obtained from the software database. The interface heat transfer coefficients were configured as: casting-to-mold at 500 W/(m²·K), casting-to-chill at 2000 W/(m²·K), and mold-to-air at 10 W/(m²·K). The initial mold temperature was set to 20°C, while the pouring temperature was initially assumed to be 1570°C. The gravity direction was aligned with the vertical axis of the casting, and the filling limit was set to 100%. The filling time was calculated based on the mass flow rate equation:
$$t_f = \frac{W / \rho}{Q_m}$$
where \(W\) is the casting weight, \(\rho\) is the steel density, and \(Q_m\) is the mass flow rate. For a pouring rate of 100 kg/s, the filling duration was approximately 90 seconds.
5. Simulation of the Original Process: Results and Defect Prediction
5.1 Filling Behavior
The simulation of the original process revealed a relatively smooth bottom-gating filling sequence. The liquid steel entered the mold cavity through the runner system and progressively rose from the bottom, with the temperature field exhibiting the expected vertical stratification. At the completion of filling, the temperature distribution remained within the range of 1509°C to 1570°C, confirming that no premature freezing occurred during the pouring stage. The observed layer-by-layer filling behavior was deemed favorable regarding the promotion of directional solidification.
5.2 Solidification Sequence and Temperature Field
The solid-fraction evolution tracked throughout the solidification stage. At the instant of complete filling, the average solid fraction was already 2.4%, indicating early solidification onset in the thinner sections. At 50% solid fraction, the solidification front proceeded from the mold walls inward, while the central flange junction remained liquid. The critical observation was that the final liquid regions did not reside exclusively within the risers; rather, they extended into the casting body itself, particularly at the riser platforms and the thick wall sections. This indicated that the original risers lacked sufficient capacity to maintain feeding throughout the later stages of solidification.
The temperature profiles extracted from five thermocouple points positioned at strategic locations further confirmed this phenomenon. Points located in the thick sections cooled more slowly and remained above the liquidus temperature long after other regions had fully solidified. The measured cooling curve differentials suggested that solidification in the heavy sections extended well beyond the feeding capability of the riser system. The total solidification time for the original process was approximately 12,513 seconds.
5.3 Shrinkage Porosity Prediction Using the Niyama Criterion
The application of the Niyama criterion to the simulated solidification results of the original process identified four distinct regions prone to macro-shrinkage cavities, accompanied by multiple zones of dispersed micro-porosity. The predicted defects were predominantly localized at the riser-casting junctions and within the thickest sections of the casting. The total defect volume was calculated to be approximately 13% of the casting volume, clearly indicating a deficiency in the feeding system design. A parallel prediction using the critical solid fraction criterion further corroborated these observations.
5.4 Validation Against Actual Casting Trials
To verify the credibility of the simulation, the foundry conducted actual pouring trials based on the original process plan. Non-destructive inspection of the resulting steel castings, including ultrasonic testing and magnetic particle examination, revealed shrinkage cavities in the flange joints and internal porosity in the heavy wall sections. These actual defects corresponded precisely with the locations predicted by the ProCAST simulation, thereby validating the numerical model. The excellent agreement between simulation and practice affirmed the reliability of ProCAST for this class of large steel castings. Consequently, it was deemed appropriate to employ simulation-driven process optimization before further costly trials.
6. Process Optimization and Simulation of the Improved Design
6.1 Design Improvements
Based on the findings from the original process simulation and the industrial casting trials, a series of modifications were implemented. The primary changes targeted the reinforcement of the feeding system. Four main risers were upgraded with 20-mm-thick exothermic insulating sleeves (FT400), while five auxiliary risers were redesigned with a double-layer insulating structure. Exothermic top cover boards were added to the riser tops to reduce heat loss. The use of exothermic sleeves was expected to increase the feeding efficiency to 30–60% and extend the riser solidification time by a factor of up to 2.3. These changes were designed to ensure that the risers would remain liquid longer than the casting regions they were intended to feed.
In addition, additional chills were introduced at the flange zones of the casting, where the original defect analysis had revealed significant porosity. The number and placement of chills were reevaluated through a series of parametric simulations. The final layout featured two sets of chills with optimized thicknesses and gaps, positioned to interrupt the hot spots and create diverging temperature gradients that promote bottom-to-top solidification.
6.2 Simulation Results of the Improved Process
The improved process model was meshed and simulated using identical numerical settings to ensure comparability. The filling stage was again satisfactory, with no evidence of turbulence-related defects. The solidification sequence exhibited a clear progression from the thinner walls toward the thicker sections, with the heavy flange junctions solidifying earlier than in the original design due to the chilling effect. The solid fraction plots at various time instants demonstrated that the final liquid pools were confined exclusively to the riser bodies, confirming that the riser redesign successfully established an unobstructed feeding path throughout the entire solidification process.
The temperature distribution in the improved casting at multiple time intervals revealed an optimal thermal gradient: the bottom sections were cooler, while the risers retained higher temperatures. This gradient configuration, in conjunction with the chill-induced cooling, created near-ideal conditions for directional solidification. The Niyama criterion applied to the improved process indicated that all shrinkage defects were confined within the riser interior, with the casting body completely free of macro-porosity. The volumetric shrinkage ratio decreased from 13% to negligible levels in critical regions.
7. Orthogonal Experiment for Process Parameter Optimization
7.1 Design of the Orthogonal Matrix
While the structural improvements to the feeding system largely resolved the macro-defects, further optimization of the key processing parameters was pursued to achieve the best possible internal quality of steel castings. An orthogonal experimental design was employed to evaluate the effects of pouring temperature, pouring velocity, and initial mold temperature. An \(L_9(3^4)\) orthogonal array was constructed, with three factors each varied over three levels, as summarized in Table 5.
| Factor | Level 1 | Level 2 | Level 3 |
|---|---|---|---|
| A: Pouring temperature (°C) | 1580 | 1570 | 1560 |
| B: Pouring velocity (kg/s) | 100 | 90 | 105 |
| C: Mold temperature (°C) | 20 | 25 | 30 |
7.2 Simulation Results and Range Analysis
Nine separate simulations were conducted following the orthogonal matrix. The shrinkage porosity percentage, calculated from the simulated defect volumes, served as the single evaluation criterion. The results of the orthogonal experiments are presented in Table 6.
| Run | A | B | C | Porosity (%) |
|---|---|---|---|---|
| L1 | 1 | 1 | 1 | 12.35 |
| L2 | 1 | 2 | 2 | 11.37 |
| L3 | 1 | 3 | 3 | 13.62 |
| L4 | 2 | 1 | 2 | 10.38 |
| L5 | 2 | 2 | 3 | 7.54 |
| L6 | 2 | 3 | 1 | 9.99 |
| L7 | 3 | 1 | 3 | 14.64 |
| L8 | 3 | 2 | 1 | 11.65 |
| L9 | 3 | 3 | 2 | 15.53 |
Range analysis was applied to the porosity data, with mean values calculated for each factor level. The range \(R\) was obtained for each factor by subtracting the minimum mean from the maximum mean. Table 7 presents the results of this range analysis.
| Factor | A | B | C |
|---|---|---|---|
| K1 | 37.52 | 37.37 | 33.99 |
| K2 | 27.91 | 30.56 | 37.28 |
| K3 | 41.82 | 39.14 | 35.80 |
| k1 | 12.50 | 12.46 | 11.33 |
| k2 | 9.30 | 10.19 | 12.43 |
| k3 | 13.94 | 13.05 | 11.93 |
| Range (R) | 13.91 | 8.58 | 3.29 |
The range analysis indicated that pouring temperature had the most dominant influence on shrinkage porosity, followed by pouring velocity, while mold temperature exerted a comparatively minor effect. The optimal combination that minimized porosity was \(A_2B_1C_1\): pouring temperature at 1570°C, pouring velocity at 100 kg/s, and mold temperature at 20°C.
7.3 Simulation of the Optimal Parameter Combination
Simulation using the optimized parameter combination yielded a final porosity of approximately 6.9%. The defect prediction map displayed shrinkage cavities exclusively at the upper portion of the risers, with the casting body wholly free of any macro-defects. The internal quality of the steel castings under this parameter set was judged to be excellent and consistent with the requirements for high-integrity pressure-containing components.
8. Industrial Verification of the Optimized Process
To confirm the practical validity of the optimized process, a full-scale industrial validation was undertaken. The foundry proceeded with the production of the valve body in accordance with the revised process plan and the optimal process parameters identified above. All melting, pouring, and post-casting treatments were performed exactly as prescribed. After cooling and shakeout, the risers were cut off, revealing competent interior structures with smooth, fully-fed riser necks. The visual inspection of the cross-sectioned risers confirmed that the feeding system had drawn the liquid metal from the riser body to the casting, leaving a clean, prominent shrinkage pipe located entirely within the riser.
Subsequent non-destructive testing of the casting, including ultrasonic and magnetic particle inspection, revealed no internal defects of a macroscopic nature. Weld repairs were not required. These results aligned almost perfectly with the simulation predictions, confirming that the optimized feeding system and process parameters were highly effective in producing sound steel castings.
9. Extension of the Methodology to Other Castings
Beyond the ball valve body, the same integrated design-simulation-optimization workflow was successfully extended to other large steel castings produced in the same facility. For instance, a heavy-shell casting subjected to the same methodology demonstrated similar success. The defect predictions were confined to the riser zones, and the actual production parts passed all quality checks. This generalization indicates the robustness of the numerical simulation approach for a wide variety of complex steel castings and suggests a path toward more efficient foundry practice.
10. Techno-Economic Analysis
The economic impact of the process improvements was assessed based on the industrial data. Thanks to the reduction in defect rates, the yield of good products increased from 78% to 92%, reflecting a 14% decrease in scrap rate. With an annual production volume of 500 units and a unit price of 160,000 RMB, the direct savings from waste reduction were approximately 3.43 million RMB per year. In addition, the shortening of the production cycle from 18 to 13.5 days enabled an additional 125 units to be produced each year, contributing a further 2 million RMB in sales revenue. Energy consumption per casting was reduced by 15% due to fewer rework cycles, adding approximately 101,000 RMB to annual savings. Combined with the reduced consumption of steel castings, the total direct annual benefits reached approximately 2.443 million RMB.
Indirect economic benefits were also significant. The improved quality of steel castings justified a 4% price premium, resulting in an additional annual gross income of 3.2 million RMB. The shortened lead time and enhanced reliability attracted new orders, providing an estimated 8 million RMB in incremental revenue. Altogether, the total indirect benefits amounted to roughly 11.2 million RMB annually. The demonstrated improvements in productivity and quality underscore the substantial value delivered by the simulation-driven process optimization.
11. Conclusions and Outlook
In this research, a comprehensive methodology combining process design, numerical simulation, orthogonal optimization, and industrial validation was successfully implemented to improve the quality of top-loaded ball valve steel castings. The main conclusions can be summarized as follows.
First, the original gating and feeding system was assessed through ProCAST simulation, revealing inadequate riser feeding capacity and non-optimal thermal gradients. The predicted shrinkage defects coincided precisely with those found in actual production inspections, demonstrating the simulation’s reliability as a diagnostic tool for large steel castings.
Second, the introduction of exothermic insulating sleeves, optimized chill placements, and redesigned riser platforms effectively eliminated the macro-shrinkage in the casting body. The new design established proper directional solidification from the bottom to the top of the casting, with the final liquid regions confined exclusively to the risers.
Third, the orthogonal experiments provided a rigorous statistical basis for the determination of optimum processing parameters. The ranking of the influential factors was found to be: pouring temperature > pouring velocity > mold temperature. The optimum combination was determined to be 1570°C pouring temperature, 100 kg/s pouring velocity, and 20°C mold temperature. The validation simulation under these conditions achieved a porosity reduction to 6.9%, all of which remained within the riser system.
Finally, the industrial production runs fully validated the optimized process, yielding steel castings free of macroscopic defects and meeting all non-destructive testing standards. The success of this study demonstrates the feasibility and efficiency of the “simulation-prediction-optimization-verification” roadmap for the manufacturing of high-quality steel castings.
Future work could explore the incorporation of microstructural simulation using the CAFE module to gain deeper insights into grain morphology and solidification texture. Moreover, expanding the material database and refining interface heat transfer models will further improve the predictive accuracy for even more complex casting geometries. The continued integration of simulation science with manufacturing practice promises to drive further improvements in the production of high-integrity steel castings.