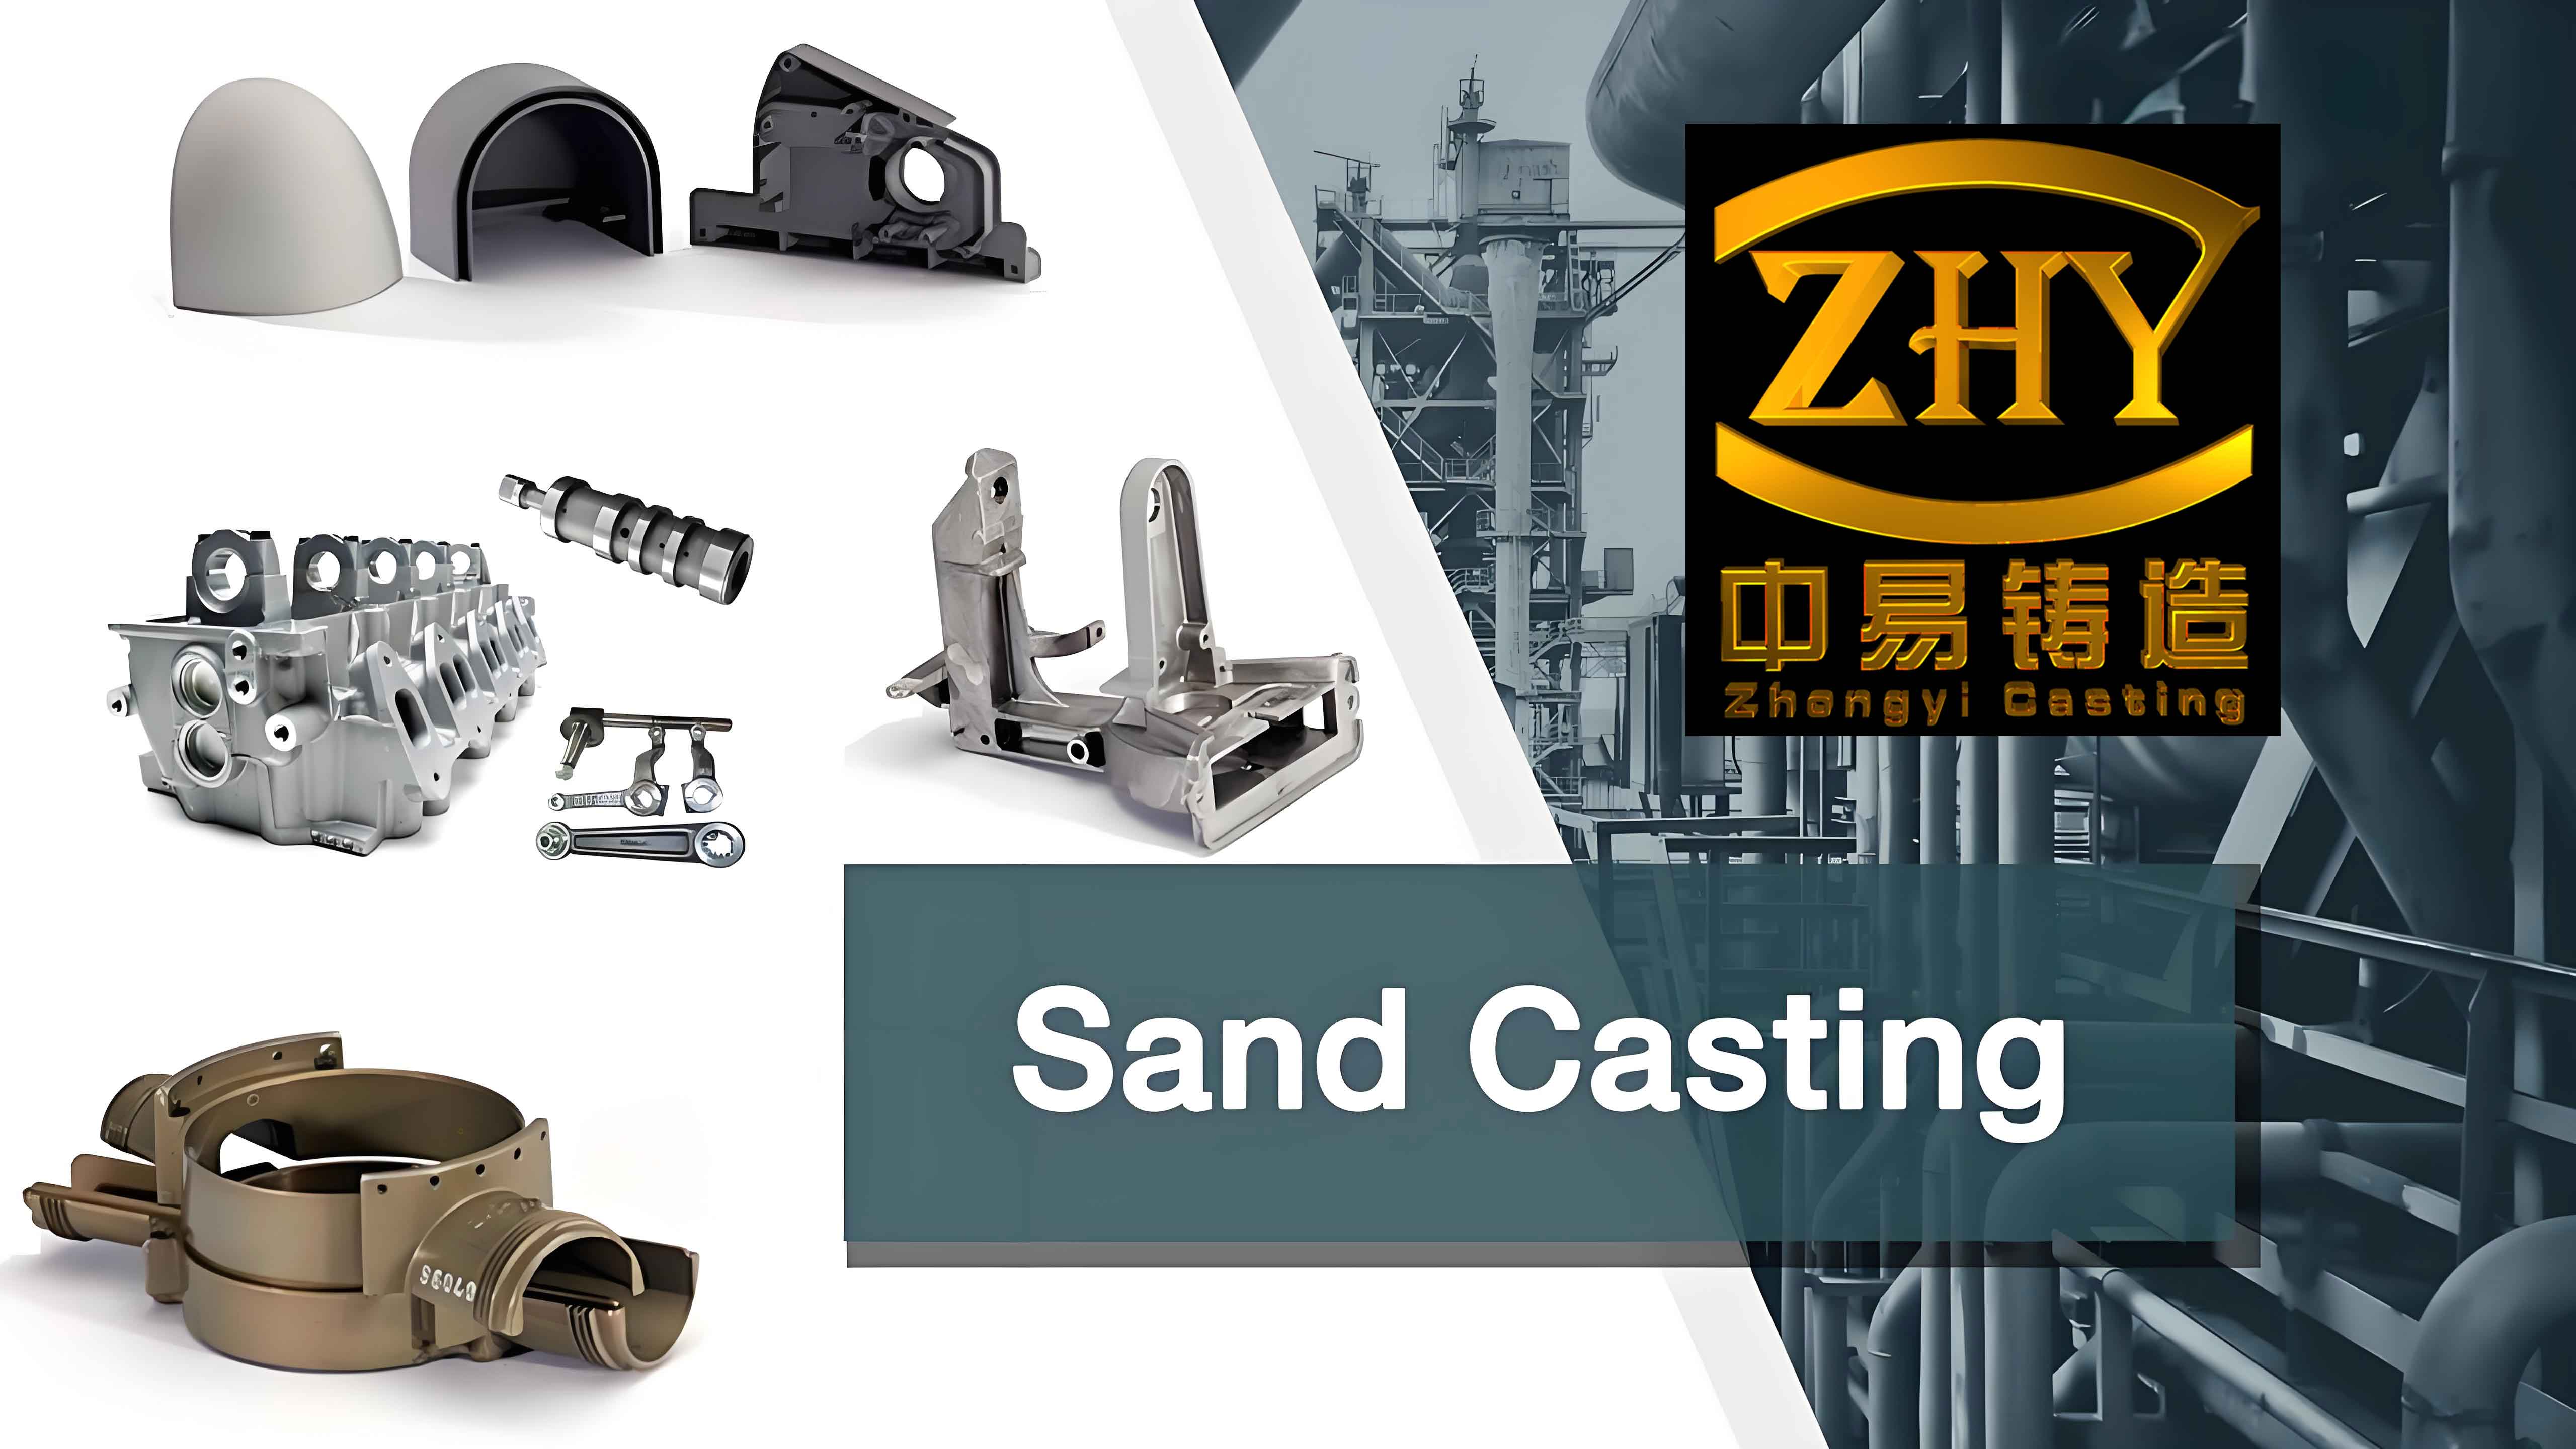
This study investigates the application of numerical simulation to optimize the rapid sand casting process for aluminum alloy engine cylinder heads. By integrating CAD/CAE systems with 3D printing technology, we demonstrate an efficient approach to casting process design and validation.
1. Process Design and Material Characterization
The cylinder head geometry (Figure 1) was modeled using UG NX 8.0 software, featuring complex internal channels and thin-wall structures. The casting material ZL105 aluminum alloy exhibits excellent castability with chemical composition shown in Table 1.

| Element | Si | Cu | Mg | Al |
|---|---|---|---|---|
| wt% | 4.5-5.5 | 1.0-1.5 | 0.4-0.6 | Bal. |
The sand casting process parameters were determined using the following heat transfer equation:
$$ \frac{\partial T}{\partial t} = \alpha \left( \frac{\partial^2 T}{\partial x^2} + \frac{\partial^2 T}{\partial y^2} + \frac{\partial^2 T}{\partial z^2} \right) $$
where α represents thermal diffusivity, calculated as:
$$ \alpha = \frac{k}{\rho C_p} $$
with k = 150 W/m·K, ρ = 2,680 kg/m³, and Cp = 900 J/kg·K for the silica sand mold.
2. Numerical Simulation Methodology
Using ProCAST software, we established the following boundary conditions for sand casting simulation:
| Parameter | Value |
|---|---|
| Pouring temperature | 690-720°C |
| Mold preheat temperature | 25°C |
| Interfacial heat transfer coefficient | 200-1,000 W/m²·K |
| Mesh elements | 508,256 |
The filling process was analyzed using the Navier-Stokes equations:
$$ \rho \left( \frac{\partial \mathbf{u}}{\partial t} + \mathbf{u} \cdot \nabla \mathbf{u} \right) = -\nabla p + \mu \nabla^2 \mathbf{u} + \rho \mathbf{g} $$
where μ = 0.0013 Pa·s for molten aluminum at 700°C.
3. Results and Analysis
The single-side bottom gating system demonstrated excellent filling characteristics:
| Time (s) | Filling Completion | Flow Front Temperature (°C) |
|---|---|---|
| 2 | Initial penetration | 705±5 |
| 5 | 15% | 695±8 |
| 16 | 100% | 670±10 |
Solidification analysis revealed sequential phase transformation:
$$ f_s = 1 – \left( \frac{T_L – T}{T_L – T_S} \right)^{1/(k_0-1)} $$
where fs = solid fraction, TL = 622°C (liquidus), TS = 536°C (solidus), and k0 = partition coefficient (0.17 for Al-Si system).
4. Quality Validation
The sand-cast components exhibited:
- Maximum porosity: 9.7%
- Average grain size: 85 μm
- Surface roughness: Ra 12.5 μm
Shrinkage defects followed the Niyama criterion:
$$ N_y = \frac{G}{\sqrt{\dot{T}}} $$
where G = temperature gradient (°C/m), and $\dot{T}$ = cooling rate (°C/s). Critical Niyama values < 1.0 (K1/2·s1/2/mm) indicated microporosity formation.
5. Process Optimization
Key improvements in sand casting parameters:
| Parameter | Initial | Optimized |
|---|---|---|
| Pouring speed (kg/s) | 0.75-1.5 | 1.2-1.4 |
| Riser diameter (mm) | 60 | 75 |
| Chill thickness (mm) | 15 | 25 |
This numerical approach reduced prototype iterations by 40% compared to traditional sand casting methods while maintaining dimensional accuracy within CT8 grade (ISO 8062).
