
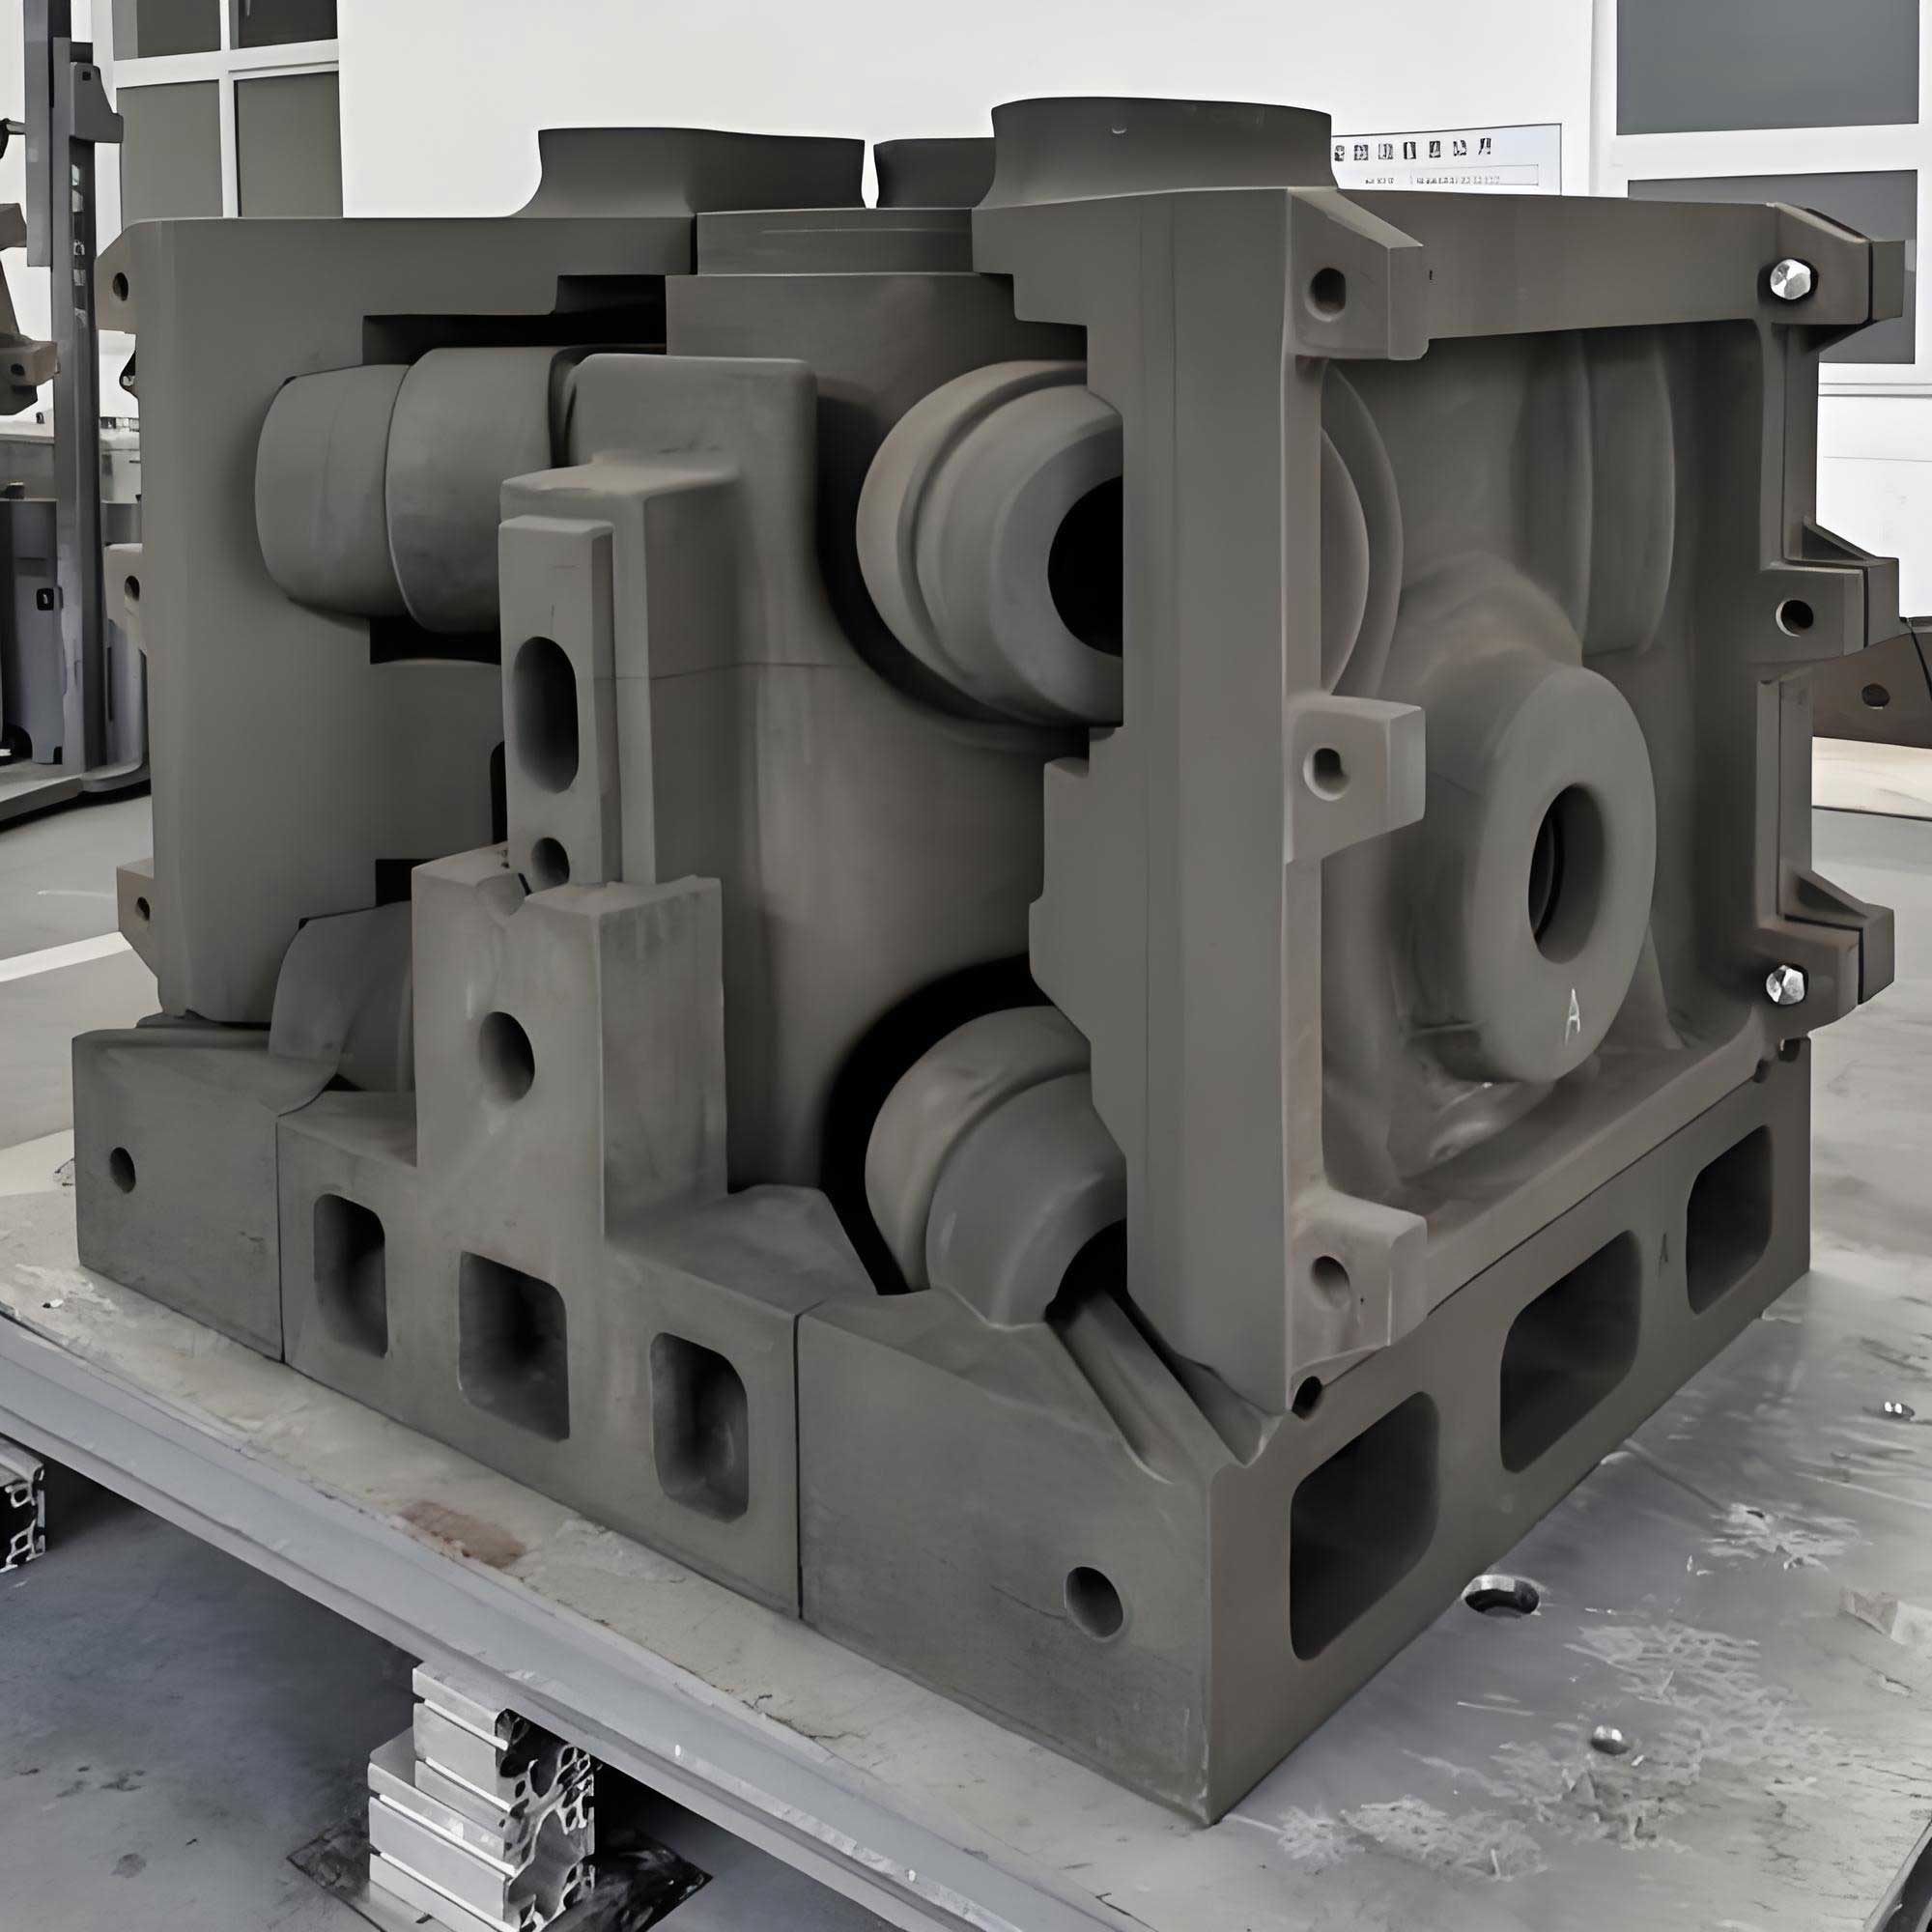
In modern manufacturing, the demand for high-quality castings with complex geometries has driven the rapid adoption of additive manufacturing technologies. Among them, 3d printing sand casting has emerged as a revolutionary approach to produce sand molds directly from digital models. This technique significantly shortens the development cycle, reduces tooling costs, and enables fabrication of intricate mold geometries that are difficult or impossible to achieve with conventional pattern-based methods. However, the quality of the final casting is strongly dependent on the dimensional accuracy and surface integrity of the printed sand mold. In practice, sand molds are often inspected manually after printing using calipers and gauges, which is time-consuming, inconsistent, and may damage the fragile sand surface. Therefore, there is an urgent need for an automated, non-contact, and in-process inspection system that can evaluate sand mold quality during the printing operation itself. In this work, we present a comprehensive machine-vision-based online inspection framework tailored specifically for 3d printing sand casting processes. Our system integrates a high-resolution industrial camera, a large-field lens, and a ring light source mounted on the printing equipment, enabling capture of the sand surface after each printed layer. We develop a robust image segmentation algorithm based on an improved Markov random field (MRF) model to accurately extract mold contours from noisy and blurry sand images. Furthermore, we propose a novel accuracy prediction method that estimates the dimensional error of printed parts from the statistical fluctuation of fitted circle centers. For defect detection, we adopt a YOLOv5-based convolutional neural network to recognize typical sand mold defects such as insufficient sand spreading and scratch marks. Experimental results demonstrate that our methods achieve high accuracy and reliability, providing a practical solution for real-time quality control in 3d printing sand casting.
1. System Overview and Hardware Development
The proposed online inspection system is integrated into a self-developed sand mold 3D printer (model LSMP600). This printer uses the binder jetting principle, where a layer of sand mixed with a curing agent is first spread, and then a printhead selectively deposits resin binder according to the slice data. After each layer, the sand surface is scanned by the vision system to assess both dimensional conformity and defects. The system architecture consists of two main parts: the optical hardware and the image processing algorithms. The hardware was selected based on the required field of view (FOV) and resolution, which are determined by the maximum print area of 600 mm × 500 mm and the specified tolerance for sand molds. According to Chinese standard GB6414-86, the highest accuracy grade for sand casting is CT7, with a tolerance of 1.8 mm for the given size range. To ensure reliable metrology, the measurement precision should be at least one-third of the tolerance, i.e., 0.6 mm. Therefore, the camera resolution must be sufficient to resolve 0.6 mm features over the entire FOV. The required number of pixels in the X and Y directions are calculated as follows:
\[
N_x = \frac{600\,\text{mm}}{0.6\,\text{mm}} = 1000
\]
\[
N_y = \frac{500\,\text{mm}}{0.6\,\text{mm}} = 834
\]
To provide good margin for edge detection and segmentation, we selected a higher-resolution camera. The chosen model is the Hikvision MV-CE200-10GM, a 20-megapixel monochrome area scan camera with a resolution of 5472 × 3648 pixels and a frame rate of 5.9 fps. The camera sensor has a pixel size of 2.4 μm, which enables fine feature extraction. Table 1 lists the key specifications of the camera.
| Parameter | Value |
|---|---|
| Model | MV-CE200-10GM |
| Sensor type | CMOS, global shutter |
| Resolution | 5472 × 3648 |
| Pixel size | 2.4 μm × 2.4 μm |
| Frame rate | 5.9 fps |
| Signal-to-noise ratio | 41.5 dB |
| Dynamic range | 65.5 dB |
The lens must provide a sufficiently large image circle and low distortion to capture the entire printing area without significant perspective errors. We mounted the camera at a working distance of approximately 1145 mm above the sand bed. The required focal length can be computed using the thin lens formula:
\[
f = \frac{\text{WD} \times \text{sensor\_size}}{\text{FOV}} = \frac{1145 \times 5472 \times 2.4\times10^{-3}}{600} \approx 25.17 \text{ mm}
\]
Accordingly, we chose the Hikvision MVL-KF2528M-12MP lens with a fixed focal length of 25 mm. This lens offers a maximum FOV of 674.28 mm × 520.56 mm at the specified working distance, which comfortably covers the printing area. The optical distortion is only 0.40%, which is acceptable for high-accuracy measurement. Table 2 summarizes the lens characteristics.
| Parameter | Value |
|---|---|
| Focal length | 25 mm |
| Optical distortion | 0.40% |
| Field angle | 36.7° |
| Aperture range | F2.8 |
| Lens mount | C-mount |
For consistent and uniform illumination over the large sand surface, we selected a ring light source (Hikvision MV-LRSS-H-80-W) with white LED arrays. The ring geometry provides a uniform light distribution and reduces shadows caused by surface irregularities. This lighting setup enhances the contrast between the printed resin area (which appears dark purple/black due to curing) and the unprinted sand (which appears yellowish-brown), facilitating subsequent image segmentation. The illumination uniformity was verified experimentally, and the chosen configuration resulted in no glare or specular reflection that could interfere with the imaging.
The mechanical structure holds the camera and light source in a rigid frame mounted above the sand bed. The frame is designed to avoid any interference with the printer’s moving parts, especially the inkjet carriage and the sand spreading mechanism. The camera is positioned vertically downward, while the ring light is placed coaxially with the lens to achieve bright-field illumination. The entire vision unit is compact and can be easily installed or removed from the printer. The design was validated through repeated image acquisitions during actual printing runs, demonstrating stable image quality and repeatable positioning.
2. Sand Mold Image Segmentation Using Improved Markov Random Field
One of the greatest challenges in machine-vision-based measurement on 3d printing sand casting is the accurate extraction of mold boundaries from sand images. Unlike conventional machined parts, sand mold images have several unique characteristics that make segmentation difficult. First, the entire image field is composed of fine sand particles, whose size, shape, and resin content vary spatially. This produces a texture that resembles strong noise, obscuring the true edges of the printed object. Second, the binder is sprayed as a fine mist, and the droplets diffuse laterally upon contacting the sand surface. This leads to a gradual transition zone along the printed contours, rather than a sharp step edge. Third, the high resolution of the camera and the large area result in a massive amount of data, which demands computationally efficient algorithms.
We compared several conventional segmentation approaches, including global thresholding, SLIC superpixels, and Markov random field (MRF) methods. As shown in our experiments, thresholding performs poorly because the lighting is not perfectly uniform across the large area, causing the histogram to be multi-modal and making a single threshold ineffective. SLIC superpixels, while preserving local structure, also suffer from over-segmentation in regions with gradual intensity variation. In contrast, MRF approaches are probabilistic and can incorporate spatial context, making them naturally suited for images with weak edges and high noise. The MRF model treats the observed image as the realization of a random field and seeks the most probable labeling given an observed field, based on Bayesian inference.
Let the observed sand image be denoted by \(Y = \{Y_s, s \in S\}\), where \(S\) is the set of all pixel coordinates in an \(M \times N\) grid. The corresponding label field is \(X = \{X_s, s \in S\}\), where each label takes a value from a finite set \(\beta \in \{1,2,\dots,L\}\). In our binary segmentation problem, we have \(L=2\): one label for the printed mold and one for the background sand. According to Bayes’ rule, the posterior probability is:
\[
P(X|Y) \propto P(Y|X) P(X)
\]
Here \(P(Y|X)\) is the likelihood, which models the intensity distribution within each class, and \(P(X)\) is the prior, which encodes spatial smoothness. The MAP estimate of the label field is then obtained by minimizing the energy function:
\[
E(X) = \sum_{s \in S} \left[ \frac{(Y_s – \mu_{x_s})^2}{2\sigma_{x_s}^2} + \frac{1}{2}\ln(2\pi \sigma_{x_s}^2) \right] + \sum_{c \in C} V_c(X)
\]
where \(\mu_{\beta}\) and \(\sigma_{\beta}\) are the mean and standard deviation of pixel intensity for class \(\beta\), and \(V_c(X)\) is the clique potential that penalizes inconsistent labels within a local neighborhood.
We adopt the iterative conditional modes (ICM) algorithm to optimize this energy function due to its efficiency and simplicity. ICM updates each pixel label by minimizing the local energy conditioned on its neighbors, iterating until convergence. However, the standard MRF-ICM procedure tends to produce a “staircase” or serrated effect along the edges of the segmented region, because of the strong pointwise noise in sand images. This is particularly problematic for dimensional measurement because the edge roughness leads to errors in feature extraction. To overcome this, we propose an improved MRF model that adds a penalty term specifically designed to suppress the formation of thin protrusions and concave notches along the segmented contour.
We define the improved energy function as:
\[
U(X_s) = \frac{(Y_s – \mu_{x_s})^2}{2\sigma_{x_s}^2} + \sum_{c \in C} V_c(X) + \lambda \cdot D(X_s)
\]
where \(D(X_s)\) is a defect potential function that is activated when the local label configuration around the pixel contains an unwanted pattern, such as a single-pixel protrusion or a one-pixel-wide gap. The parameter \(\lambda\) controls the strength of this regularization. In our implementation, we used a second-order neighborhood system and defined \(D(X_s)\) based on the multi-level logistic (MLL) model, but with additional constraints that penalize configurations where the center label differs from all its four orthogonal neighbors. This effectively enforces smooth, continuous boundaries and eliminates isolated pixel errors. The resulting algorithm is named “improved Markov random field” (IMRF).
We evaluated the segmentation performance on sand images captured 10 seconds after printing, using manually annotated ground truth contours. Three metrics were computed: edge IoU (Intersection over Union), edge pixel accuracy (PA), and edge class pixel accuracy (CPA). Table 3 shows the comparison between thresholding, standard MRF, and our improved MRF.
| Method | Edge IoU | Edge PA | Edge CPA |
|---|---|---|---|
| Thresholding | 0.528 | 0.806 | 0.813 |
| Standard MRF | 0.579 | 0.854 | 0.872 |
| Improved MRF | 0.618 | 0.881 | 0.912 |
As can be seen, the improved MRF yields significantly better results than standard MRF, with an edge IoU increase of 6.7% relative to MRF, and an edge PA increase of 3.2%. Compared to thresholding, the improvements are 17.05% in IoU, 9.31% in PA, and 12.18% in CPA. These quantitative gains confirm that the added defect potential effectively minimizes segmentation artifacts and provides a more precise contour for downstream measurement.
3. Dimensional Accuracy Prediction for 3D Printed Sand Molds
The final goal of dimensional inspection in 3d printing sand casting is to determine whether the printed mold dimensions meet the specified tolerances. Since the mold is built layer by layer, the accuracy of the entire part can be assessed by monitoring the deviation of each layer. However, directly measuring physical dimensions from a single image is challenging because the boundary of the printed region is not sharply defined due to resin diffusion and sand grain effects. To address this, we developed a prediction method based on the statistical behavior of geometric features fitted from the segmented contour.
We used a standard test artifact called an “eight-character block” (八字块) which consists of six circular arcs with different radii. The artifact is designed for general accuracy assessment, as it contains both convex and concave curved features. After printing, we capture an image of the layer surface after every 1 mm of printed thickness (i.e., every two layers). The image is first corrected for lens distortion using a pre-calibrated mapping. The corrected image is then segmented using the improved MRF algorithm described in Section 2. The contour of the printed artifact is extracted, and each arc segment is fitted by a circle using the least-squares method.
For a circle with center \((a,b)\) and radius \(R\), the least-squares fit minimizes the sum of squared distances from the observed edge points \((x_i, y_i)\) to the circle:
\[
\min_{a,b,R} \sum_{i=1}^{n} \left( \sqrt{(x_i-a)^2 + (y_i-b)^2} – R \right)^2
\]
In practice, we use the algebraic least-squares solution for linearized circle fitting. Since the circle center is derived from a set of boundary points, any error in the edge location will cause the fitted center to fluctuate. If we repeatedly fit the same arc from multiple images (taken at different layers or under slightly different conditions), the dispersion of the fitted center positions reflects the dimensional stability of the printed layer. In our experiment, we collected 10 measurements of the same artifact, each time acquiring an image at a different layer (but the same arc feature). For each of the six arcs, we computed the standard deviation of the fitted center coordinates in both X and Y directions. Table 4 lists the standard deviations (in pixels) for the first arc as an example.
| Measurement | X (pixel) | Y (pixel) |
|---|---|---|
| 1 | 321.41 | 204.57 |
| 2 | 315.57 | 197.82 |
| 3 | 321.41 | 204.57 |
| 4 | 321.41 | 204.78 |
| 5 | 321.34 | 204.82 |
| 6 | 321.58 | 204.21 |
| 7 | 321.75 | 204.52 |
| 8 | 321.82 | 204.62 |
| 9 | 321.91 | 204.49 |
| 10 | 320.99 | 204.17 |
| Std. Dev. | 0.2688 | 0.2092 |
Some measurements may contain gross outliers due to segmentation failures or foreign particles. These outliers are identified by a simple threshold (e.g., deviation > 3σ) and removed before statistical analysis. For the valid points, the combined fluctuation of the center in the image plane is computed as:
\[
\Delta = \sqrt{S_x^2 + S_y^2}
\]
where \(S_x\) and \(S_y\) are the standard deviations of the X and Y coordinates, respectively. Converting this pixel-domain fluctuation to physical units using the known pixel size (0.167 mm/pixel) yields the center fluctuation in millimeters. For the entire artifact, we average the fluctuations of all six arcs to obtain a single metric \(F_{\text{mean}}\).
To relate this center fluctuation metric to the actual dimensional error of the printed part, we printed several test specimens and measured their real dimensions using a coordinate measuring machine. The actual size deviation \(\delta\) was defined as the maximum deviation from the nominal dimension. We then computed the Pearson correlation coefficient between \(F_{\text{mean}}\) and \(\delta\). The results are summarized in Table 5.
| Test # | Mean center fluctuation (mm) | Actual size deviation (mm) |
|---|---|---|
| 1 | 3.682×10⁻⁴ | 0.724 |
| 2 | 5.908×10⁻⁴ | 0.881 |
| 3 | 6.108×10⁻⁴ | 0.916 |
| 4 | 3.190×10⁻⁴ | 0.710 |
| 5 | 4.653×10⁻⁴ | 0.865 |
| 6 | 3.393×10⁻⁴ | 0.704 |
| 7 | 3.592×10⁻⁴ | 0.693 |
| 8 | 4.360×10⁻⁴ | 0.825 |
The Pearson correlation coefficient \(r\) is 0.941, indicating a strong positive linear relationship. This means that a larger center fluctuation corresponds to a larger dimensional error of the printed part. We fitted a linear regression model to predict the size deviation from the center fluctuation:
\[
\delta_{\text{pred}} = k \cdot F_{\text{mean}} + b
\]
From the experimental data, we obtained \(k \approx 1748\). The prediction accuracy was evaluated by comparing the predicted deviations with the measured deviations, yielding a maximum absolute error of ±0.15 mm. This is well within the required inspection accuracy of ±0.33 mm for the sand mold process. Therefore, the proposed center fluctuation metric serves as a reliable, real-time indicator of dimensional quality in 3d printing sand casting. By monitoring this metric layer by layer, it becomes possible to detect early signs of dimensional drift and take corrective actions before the complete part is printed, thus saving material and time.
4. Defect Detection in Sand Mold Printing Using YOLOv5
In addition to dimensional accuracy, surface defects are another major factor affecting the quality of sand molds used in 3d printing sand casting. Common defects observed in our binder jetting printer include “insufficient sand spreading” (铺砂不足) and “sand face scratches” (砂面划痕). Insufficient sand spreading occurs when the sand layer thickness is locally reduced, leading to gaps or voids that can cause mold delamination or weak spots. Scratch marks are formed when large sand particles or impurities are dragged by the spreading blade, creating linear recessions on the sand surface. These defects are not only visible on the surface but may also be reproduced in subsequent layers, ultimately affecting the casting surface quality.
Traditional rule-based vision algorithms can be tailored to detect specific defects, but they often lack generalization when defect appearance varies widely. To achieve robust and real-time detection, we employed a deep learning approach based on the YOLOv5 object detection framework. YOLOv5 is a state-of-the-art single-stage detector that offers an excellent trade-off between speed and accuracy, making it suitable for in-process monitoring. The network architecture consists of a CSPDarknet backbone, a PANet neck with SPP module, and an anchor-based detection head. The YOLOv5 framework also incorporates several data augmentation strategies that improve the robustness of the model. In particular, the Mosaic data augmentation randomly combines four training images into one, enhancing the variety of object scales and backgrounds. The Focus module in YOLOv5 performs a slice operation to down-sample the input image without losing information, thereby increasing inference speed.
We built a defect dataset from images captured with the online vision system. Since no public dataset exists for sand mold printing defects, we collected and annotated our own data. The acquisition process yielded 2176 images with a resolution of 5472 × 3648 pixels. Because training directly on such large images is computationally expensive, we cropped them into smaller patches of 1300 × 620 pixels. After filtering out low-quality samples, we retained 1562 defect images. Among them, 80% (1249 images) were used as the training set and 20% (313 images) as the validation set. The images were labeled using the LabelImg tool, marking two classes: Class 01 for insufficient sand spreading and Class 02 for scratch marks. The dataset included images with a single defect, multiple defects, and defects coexisting with printed patterns to better simulate real production conditions. Some examples of these defect images are shown in Figure 1 (the figure has been omitted in this text).
The training was conducted using a computer with an Intel Core i5-8400 CPU and 8 GB RAM. We used the PyCharm IDE with PyTorch as the deep learning framework. The input image size was set to 640×640 pixels, confidence threshold 0.25, and IoU threshold 0.45. We initialized the network with a pre-trained weights file, YOLOv5s.pt, which had been trained on the COCO dataset. Transfer learning from a pre-trained model accelerates convergence and improves generalization, especially with a relatively small dataset. The model was trained for 50 epochs. To monitor training progress, we recorded the mean Average Precision (mAP), precision (P), recall (R), and loss values after each epoch.
After training, we evaluated the model on the validation set. Table 6 lists the precision, recall, and mAP metrics for each class and for the overall model.
| Class | Precision (P) | Recall (R) | mAP@.5 | mAP@.5:.95 |
|---|---|---|---|---|
| All | 0.864 | 0.907 | 0.922 | 0.723 |
| 01: Insufficient sand | 0.877 | 0.967 | 0.974 | 0.770 |
| 02: Scratch marks | 0.852 | 0.846 | 0.869 | 0.680 |
The overall recall of 90.7% and precision of 86.4% demonstrate that the model can reliably identify most defects while maintaining a low false-positive rate. For the insufficient sand class, the recall is as high as 96.7%, meaning that nearly all such defects are captured. The slightly lower recall for scratch marks (84.6%) is attributed to the varying length and contrast of scratch defects, some of which are quite faint. Nevertheless, the detection performance is adequate for industrial online monitoring.
We also analyzed the loss curves. The classification loss decreased to 0.0001 after 50 epochs, while the bounding box regression loss decreased to 0.016. The low final losses indicate that the model has learned the distinct features of the defects and is able to localize them accurately. The mAP@0.5:0.95 value of 0.723 is particularly encouraging because this metric is more stringent than mAP@0.5, requiring the predicted boxes to match the ground truth over multiple IoU thresholds.
5. Conclusion and Future Works
In this paper, we presented a machine-vision-based online inspection system for 3d printing sand casting that addresses both dimensional accuracy and surface defect detection. The developed hardware platform, consisting of a high-resolution camera, a low-distortion lens, and a ring light, captures high-quality images of the sand surface during the printing process. We introduced an improved Markov random field segmentation algorithm that effectively handles the noisy, low-contrast sand images, achieving an edge IoU of 0.618, which is a 17% improvement over thresholding. This precise segmentation serves as the basis for dimensional estimation.
For dimensional inspection, we proposed a novel accuracy prediction method based on the statistical fluctuation of fitted circle centers. Experiments on eight print runs showed a strong correlation (r=0.941) between center fluctuation and actual size deviation. The prediction model achieved an accuracy of ±0.15 mm, satisfying the required tolerance for sand mold inspection. This method enables layer-by-layer monitoring, which can trigger early warnings and prevent waste in large-scale sand mold production.
For defect detection, we adapted the YOLOv5 framework and trained it on a custom dataset of two typical sand mold defects. The model achieved a recall of 90.7% and a precision of 86.4%, demonstrating its capability for real-time identification of insufficient sand spreading and scratches. The detection results can be integrated into the printer control system to automatically pause or adjust the process when a defect is detected.
There are several directions for future improvement. First, the accuracy prediction method could be extended to parts that lack circular arcs by using line-fitting techniques of the segmented edges. Second, the defect detection model can be improved by collecting more annotated data, especially for low-contrast defects, and by exploring advanced architectures such as YOLOv7 or transformer-based detectors to further reduce false negatives. Third, the online inspection system could be integrated with a closed-loop feedback mechanism that automatically adjusts printing parameters (e.g., resin saturation, spreader speed) based on the measured quality metrics, thereby realizing fully autonomous quality control in 3d printing sand casting.
In conclusion, the methods and systems developed in this work provide a solid foundation for automated quality assurance in additive manufacturing of sand molds. The integration of machine vision, advanced image processing, and deep learning techniques offers a powerful solution to the persistent challenge of ensuring consistency and reliability in sand casting production. Our ongoing research aims to refine these algorithms and expand their applicability to other aspects of the sand casting workflow, ultimately contributing to the digital transformation of the foundry industry.