
In modern engine technology, the demand for high-performance, durable, and efficient components has never been greater. As a core component in internal combustion engines, the cylinder liner operates under extreme conditions of high pressure, temperature, and friction. Therefore, its reliability and lifespan are critical to overall engine performance. Spheroidal graphite cast iron, often referred to as ductile iron, is widely utilized for cylinder liners due to its excellent mechanical properties, such as high strength, good wear resistance, and superior cavitation erosion resistance. However, during the production of spheroidal graphite cast iron cylinder liners using horizontal centrifugal casting with water-cooled metal molds, defects like inverse chill (reverse white iron) can occur, particularly in thicker sections. This defect manifests as hard, brittle phases within the microstructure, compromising mechanical integrity, increasing machining difficulty, and reducing tool life. Understanding and mitigating such defects is essential for improving product quality and economic efficiency.
The formation of inverse chill in spheroidal graphite cast iron is influenced by multiple factors, including chemical composition segregation, inoculation effectiveness, and cooling conditions during solidification. Traditional trial-and-error methods for process optimization are time-consuming and costly. With advancements in computational numerical simulation technology, casting simulation software provides a powerful tool for predicting defect locations, analyzing solidification patterns, and optimizing process parameters. Although simulation of horizontal centrifugal casting processes is still evolving and may not perfectly replicate real-world conditions, it offers significant advantages such as shorter development cycles, lower research costs, and ease of parameter adjustment. In this article, I will discuss the application of casting simulation to analyze and optimize the casting process for spheroidal graphite cast iron cylinder liners, with a focus on eliminating inverse chill defects through targeted modifications.
The core of this study involves using simulation software to model the temperature field and solid-liquid phase distribution during solidification. By identifying the last-to-solidify regions, which are prone to defects, we can implement process changes to promote more uniform cooling. Key optimizations include adjusting cooling water flow rates and insulation coating thicknesses in specific areas. The results demonstrate that simulation-guided optimization effectively reduces defect occurrence, enhances product quality, and provides a framework for similar applications. Throughout this discussion, I will emphasize the importance of spheroidal graphite cast iron in automotive and industrial sectors, and how process improvements can unlock its full potential.
To begin, let’s explore the mathematical foundation for simulating the casting process. The filling and solidification of molten metal in centrifugal casting involve complex fluid dynamics and heat transfer phenomena. The flow is characterized as viscous, incompressible, and unsteady with a free surface. Thus, it follows the fundamental laws of conservation of mass and momentum. The continuity equation and the Navier-Stokes equation form the basis for modeling fluid motion. In Cartesian coordinates, the continuity equation for an incompressible fluid is given by:
$$ \frac{\partial u}{\partial x} + \frac{\partial v}{\partial y} + \frac{\partial w}{\partial z} = 0 $$
where \( u, v, w \) are the velocity components in the \( x, y, z \) directions, respectively. The Navier-Stokes equation, which describes momentum conservation, can be expressed as:
$$ \frac{\partial (\rho \phi)}{\partial t} + \nabla \cdot (\rho \vec{V} \phi) = \nabla \cdot (\mu \nabla \phi) + S_u – \nabla P $$
Here, \( \rho \) is density, \( t \) is time, \( \phi \) represents a velocity component, \( \vec{V} \) is the velocity vector, \( \mu \) is dynamic viscosity, \( P \) is pressure, and \( S_u \) is a source term. For temperature field simulation during solidification, the heat conduction behavior must also be considered, governed by the energy balance equation:
$$ \rho c \frac{dT}{dt} = \nabla \cdot (k \nabla T) + \dot{Q} $$
where \( c \) is specific heat, \( T \) is temperature, \( k \) is thermal conductivity, and \( \dot{Q} \) represents internal heat sources (e.g., latent heat release during phase change). These equations are solved numerically using finite element or finite volume methods within the simulation software to predict flow patterns, temperature distribution, and solidification sequences.
For the spheroidal graphite cast iron cylinder liner studied here, the physical model includes the casting, mold, end plates, and insulation coatings. The liner has a maximum outer diameter of 140 mm, a length of 298 mm, and a maximum wall thickness of 19 mm. Machining allowances are applied: 7–9 mm on the inner diameter, 40 mm at the pouring end, and 20 mm at the tail end. The assembly of the casting and mold is crucial for accurate simulation, as it defines the heat transfer boundaries.
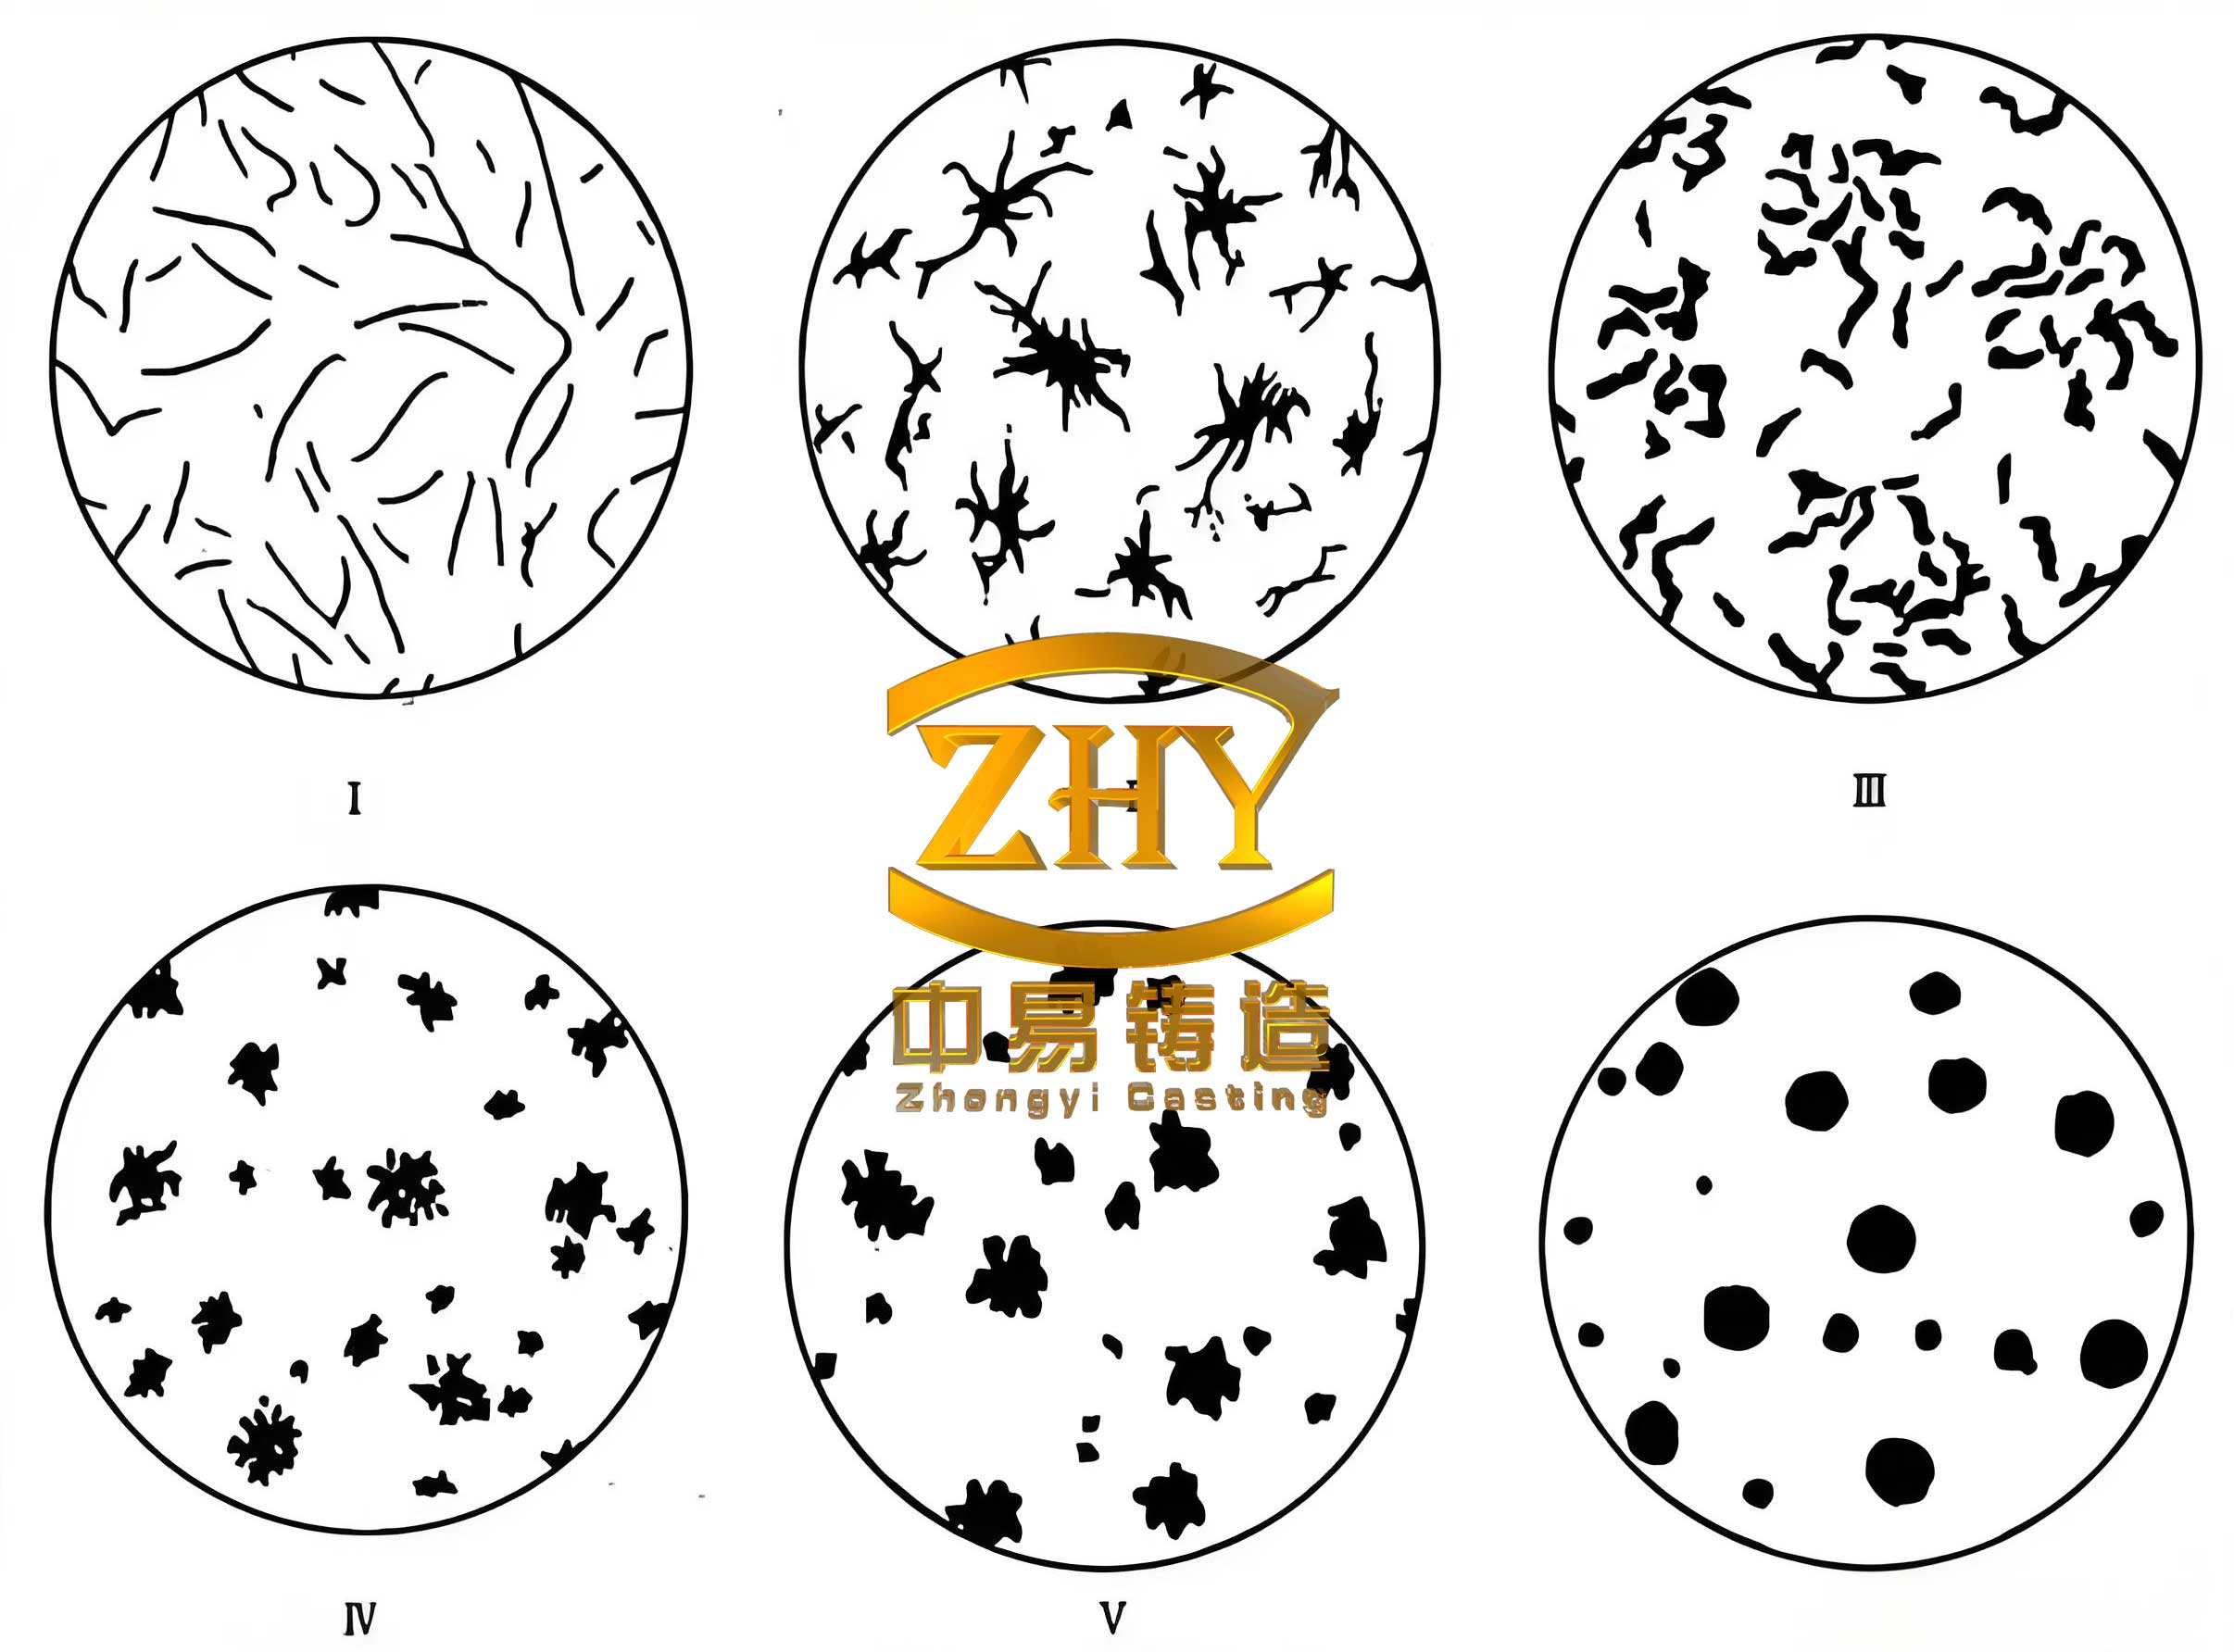
This image illustrates a typical microstructure of spheroidal graphite cast iron, highlighting the graphite nodules in a metallic matrix, which is essential for its properties. In our simulation, the geometry is discretized using unstructured tetrahedral meshes, with finer meshes applied to the casting and insulation layers to capture detail, while coarser meshes are used for the mold to reduce computational load. The mesh consists of 99,812 surface elements and 719,843 volume elements, ensuring sufficient resolution for reliable results.
The initial casting process parameters are based on production experience. The material for the cylinder liner is pearlitic spheroidal graphite cast iron, with a chemical composition as shown in Table 1. The mold and end plates are made of HT250 gray iron. The centrifugal casting process involves pouring molten metal into a rotating mold, with rotation speed calculated using Konstantinov’s empirical formula:
$$ n = 29.9 \sqrt{\frac{G}{r}} $$
where \( n \) is mold speed in rpm, \( G \) is the gravity factor (typically 40–110), and \( r \) is the inner radius of the casting in meters. For this casting, \( r \) is approximately 0.05 m (considering the inner surface after machining allowance), yielding a speed range of 840–1380 rpm. Based on practice, an initial speed of 1200 rpm is selected. Other key parameters include pouring temperature, pouring rate, mold preheat temperature, and heat transfer coefficients, summarized in Table 2.
| Element | C | Si | Mn | Cu | Ni | Mg | Ce | S |
|---|---|---|---|---|---|---|---|---|
| Content | 3.4–3.9 | 2.4–2.9 | ≤0.5 | 1.0–1.3 | 0.1–0.3 | ≥0.035 | <0.04 | <0.02 |
| Parameter | Value or Range |
|---|---|
| Pouring Temperature | 1340–1390 °C |
| Pouring Rate | 2.0–2.5 kg/s |
| Mold Preheat Temperature | 200–300 °C |
| Casting/Mold/Coating Heat Transfer Coefficient | 500 W·m⁻²·K⁻¹ |
| Mold/Cooling Water Heat Transfer Coefficient | 5000 W·m⁻²·K⁻¹ |
| Casting Inner Surface/Air Heat Transfer Coefficient | 20–60 W·m⁻²·K⁻¹ |
| Centrifugal Speed | 1200 rpm |
| Casting Material | Spheroidal Graphite Cast Iron |
| Mold Material | HT250 Gray Iron |
Simulation of the initial process reveals critical insights into temperature distribution and solidification behavior. The temperature field at different time steps shows that the outer surface of the casting, in contact with the insulation coating and mold, cools rapidly due to the high temperature gradient with the water-cooled mold. The inner surface, exposed to air, also loses heat via radiation and convection, but at a slower rate. However, in thicker sections, a “sandwich” effect emerges: the outer and inner layers solidify first, while the mid-wall region remains liquid longer, creating a thermal hotspot. This is exacerbated at the pouring end, where additional machining allowance increases wall thickness. After 150 seconds of solidification, the temperature distribution indicates an outer layer at 1120°C, an inner layer at 1160°C, and a mid-layer at 1180°C, confirming uneven cooling.
The solid-liquid phase distribution further pinpoints defect-prone zones. As shown in simulation results, the last-to-solidify area, labeled “Region A,” is located approximately 7.8 mm from the inner surface of the casting blank. This aligns with empirical observations where inverse chill defects appear about 7 mm from the inner wall in actual production. The correlation validates the simulation’s accuracy in predicting defect locations for spheroidal graphite cast iron components. The underlying mechanism involves elemental segregation (e.g., carbide-forming elements like manganese) and inoculation fading in slow-cooling regions, leading to formation of hard phases instead of desired graphite nodules. To quantify cooling rates, we can derive an expression from the heat conduction equation. For one-dimensional solidification, the cooling rate \( \dot{T} \) is proportional to the thermal diffusivity \( \alpha \):
$$ \dot{T} = \alpha \frac{\partial^2 T}{\partial x^2}, \quad \alpha = \frac{k}{\rho c} $$
In thicker sections, lower cooling rates in the mid-wall region prolong solidification, allowing inverse chill to occur. Therefore, process optimization must aim to achieve more uniform cooling throughout the casting, especially in spheroidal graphite cast iron, where microstructure control is paramount.
Based on simulation findings, several optimization strategies are proposed. The primary goal is to accelerate cooling in thicker sections to match the cooling rate of thinner areas, thereby minimizing temperature gradients and shifting the last-to-solidify region closer to the inner surface or eliminating it entirely. This involves modifying cooling water flow rates and insulation coating thicknesses locally. For instance, increasing water flow at the pouring end enhances heat extraction from the mold, while reducing coating thickness in thick-walled areas improves heat transfer from the casting to the mold. Additionally, adjusting centrifugal speed within the calculated range can influence fluid flow and solidification patterns. A summary of optimized parameters is presented in Table 3.
| Parameter | Initial Value | Optimized Value | Rationale |
|---|---|---|---|
| Cooling Water Flow at Thick Sections | Standard | Increased by 30% | Enhance heat removal |
| Insulation Coating Thickness | Uniform | Reduced by 20% at thick zones | Improve thermal conductivity |
| Centrifugal Speed | 1200 rpm | 1100 rpm | Moderate fluid dynamics |
| Mold Preheat Temperature | 200–300 °C | 250 °C (constant) | Reduce initial thermal shock |
| Pouring Temperature | 1340–1390 °C | 1360 °C (target) | Balance fluidity and shrinkage |
Re-simulating with optimized parameters shows a marked improvement. The temperature field becomes more uniform, with the outer surface still cooling fastest but the mid-wall region cooling faster due to enhanced heat transfer. After 120 seconds, the solid-liquid distribution indicates the last-to-solidify area is now only about 3.5 mm from the inner surface, significantly reducing the risk of inverse chill. This shift is critical because it places the final solidification zone within the machining allowance, meaning any residual defects will be removed during processing. The cooling rate in thick sections can be estimated using a modified heat transfer model. Considering Newton’s law of cooling, the heat flux \( q \) at the mold-casting interface is:
$$ q = h (T_c – T_m) $$
where \( h \) is the heat transfer coefficient, \( T_c \) is casting surface temperature, and \( T_m \) is mold temperature. By increasing \( h \) via coating reduction or water flow adjustment, \( q \) rises, leading to a higher cooling rate \( \dot{T} \). For spheroidal graphite cast iron, a target cooling rate above a critical value (e.g., 10°C/s) in all sections can suppress carbide formation. Simulation data for cooling rates before and after optimization are compared in Table 4.
| Zone | Distance from Inner Surface (mm) | Initial Cooling Rate (°C/s) | Optimized Cooling Rate (°C/s) | Improvement |
|---|---|---|---|---|
| Outer Layer | 15–19 | 25.3 | 27.1 | +7.1% |
| Mid-Wall | 7–10 | 8.7 | 14.2 | +63.2% |
| Inner Layer | 0–3 | 12.5 | 13.8 | +10.4% |
The optimized process was implemented in production, and results confirmed the simulation predictions. Visual inspection and metallographic analysis of castings showed no inverse chill defects in the final machined parts. The microstructure of spheroidal graphite cast iron exhibited well-formed graphite nodules in a pearlitic matrix, with hardness values within specification (200–250 HB). Defect rates dropped to near zero, and machining performance improved due to the absence of hard spots. This demonstrates the efficacy of simulation-driven optimization for spheroidal graphite cast iron components.
Beyond defect elimination, this approach offers broader benefits. By understanding solidification patterns, we can reduce machining allowances in future designs, increasing material utilization and lowering costs. For example, if the last-to-solidify zone is consistently within 3–4 mm of the inner surface, allowance can be reduced from 7–9 mm to 5 mm, saving material and energy. Additionally, simulation allows exploration of alternative gating designs, alloy modifications, or cooling strategies without physical trials. For spheroidal graphite cast iron, which is sensitive to processing conditions, such virtual prototyping is invaluable.
In conclusion, casting simulation software provides a powerful means to optimize the manufacturing process for spheroidal graphite cast iron cylinder liners. By modeling temperature fields and solid-liquid distributions, we identified the root cause of inverse chill defects in thick sections and implemented targeted changes to cooling parameters. The optimized process promotes uniform solidification, shifts defect-prone zones into machinable areas, and enhances product quality. This methodology reduces development time, cuts costs, and improves reliability, making it highly applicable to other centrifugal cast components. As engine technologies advance, the role of high-integrity spheroidal graphite cast iron parts will grow, and simulation-based optimization will be key to meeting stringent performance demands. Future work could integrate multi-scale modeling to capture microstructure evolution in spheroidal graphite cast iron, or explore AI-driven parameter optimization for even faster process design.
To summarize the key equations and relationships used in this study, I have compiled them below in a concise format. These mathematical models are fundamental for simulating casting processes, especially for materials like spheroidal graphite cast iron where thermal management is critical.
1. Continuity Equation (Incompressible Flow):
$$ \nabla \cdot \vec{V} = 0 $$
2. Navier-Stokes Equation (Momentum Conservation):
$$ \rho \left( \frac{\partial \vec{V}}{\partial t} + \vec{V} \cdot \nabla \vec{V} \right) = -\nabla P + \mu \nabla^2 \vec{V} + \vec{F} $$
3. Energy Equation (Heat Transfer with Solidification):
$$ \rho c_p \frac{DT}{Dt} = \nabla \cdot (k \nabla T) + \dot{Q}_L $$
where \( \dot{Q}_L \) accounts for latent heat release: \( \dot{Q}_L = \rho L \frac{\partial f_s}{\partial t} \), with \( L \) as latent heat and \( f_s \) as solid fraction.
4. Cooling Rate Estimation:
$$ \dot{T} = \frac{h A (T_c – T_m)}{\rho c_p V} $$
for a casting volume \( V \) and surface area \( A \), highlighting the impact of heat transfer coefficient \( h \).
5. Solidification Time (Chvorinov’s Rule):
$$ t_s = B \left( \frac{V}{A} \right)^n $$
where \( B \) and \( n \) are constants dependent on material and process conditions. For spheroidal graphite cast iron, \( n \) is typically around 2.
These equations, combined with empirical data, guide the optimization of casting processes for spheroidal graphite cast iron, ensuring high-quality outcomes. The iterative use of simulation and real-world validation creates a robust framework for continuous improvement in manufacturing.