
In recent years, the rapid development of additive manufacturing has triggered a profound transformation in the metal casting industry. Among various additive techniques, binder jetting-based 3D printing sand casting has emerged as a promising solution for producing complex sand molds and cores without the need for expensive tooling. The technology offers unparalleled design freedom, short lead times, and the ability to integrate internal cooling channels or lightweight structures directly into the mold. However, the widespread industrial adoption of 3D printing sand casting still faces a significant challenge: forming efficiency. The total time required to produce a finished casting includes not only the printing stage but also post-processing and solidification stages. These stages are strongly influenced by process parameters such as layer thickness, spreader speed, X-resolution, and print head speed. Moreover, the structural design of the sand mold itself, including the parting surface, gating system, and supporting lattice, can substantially affect cleaning efficiency and cooling rates. Consequently, a holistic optimization approach is necessary to balance efficiency and quality.
This thesis focuses on the systematic analysis and optimization of process parameters and structural designs for 3D printing sand casting. Through orthogonal experiments, I investigate the influence of four key printing parameters on the total printing time and mold strength. Based on the experimental data, I develop a comprehensive efficiency prediction model that covers the printing, post-processing, and pouring stages. Subsequently, I employ the NSGA-II algorithm to solve a multi-objective optimization problem that trades off printing efficiency against mechanical properties of the sand mold. In parallel, I propose novel sand mold structural designs that reduce sand consumption and enhance cooling performance. The proposed methods are verified through actual printing, cleaning, and casting experiments using an engine cylinder block as a case study. The results demonstrate that the optimized parameter set and structural designs can improve the overall forming efficiency by nearly 17% compared with conventional settings, while maintaining sand mold quality within acceptable limits.
The remainder of this article is organized as follows: it first reviews the current state of research on 3D printing sand casting and identifies the research gaps. Then it describes the design of orthogonal experiments and the analysis of variance results. After that, it establishes a stage-by-stage forming efficiency prediction model. Next, a multi-objective optimization framework based on NSGA-II is presented, together with the sand mold structural optimization methodology. The following section provides a detailed case study of an engine cylinder block, including actual printing experiments and simulation validation. Finally, the article discusses the accuracy of the prediction model, the effect of parameter optimization, and the structural improvements, followed by concluding remarks.
1 Introduction and Background
The manufacturing sector is the backbone of national economic development. Casting, as one of the most fundamental manufacturing processes, produces more than 50 million tons of components every year. Traditional sand casting relies heavily on physical patterns and core boxes, which incur high costs and long lead times when producing complex geometries. The increasing demand for lightweight and high-performance components has pushed foundries to seek more flexible manufacturing routes. 3D printing sand casting, also known as binder jetting sand printing, addresses these limitations by building sand molds layer by layer directly from CAD data. This technology bypasses the need for tooling and allows the fabrication of molds with intricate internal features that are impossible to manufacture through conventional methods. The printing process begins with a thin layer of sand being spread across the build platform. A printhead then selectively deposits a liquid binder onto the sand bed according to the sliced 2D cross-sections. These steps are repeated until the entire mold is completed. Afterwards, the loose sand surrounding the printed part is removed during a cleaning stage, and the mold is cured to achieve sufficient strength for metal pouring.
Despite its advantages, 3D printing sand casting has a major drawback: the forming efficiency is generally lower than that of traditional high-pressure molding lines. The forming efficiency in this context is not limited to the printing speed; it also encompasses the time required for sand mold curing, depowdering, and the subsequent solidification of the cast metal. Each stage has its own set of controllable parameters and constraints. For instance, increasing the layer thickness reduces the number of layers and thus shortens the printing time, but it may compromise the surface quality and mechanical strength of the mold. Similarly, increasing the spreader speed can reduce the recoating time; however, it may produce a less compact sand bed, leading to lower mold density and higher gas permeability. X-resolution, which controls the distance between binder droplets, affects both the printing time and the amount of binder consumed. The print head speed, on the other hand, determines the rate at which the binder is deposited, but excessive speeds may cause droplet misplacement and non-uniform binder distribution. Therefore, a trade-off between efficiency and quality is unavoidable.
Another dimension of forming efficiency lies in the structural design of the sand mold. Traditional sand molds are usually solid, dense blocks that consume a large amount of sand and provide a low cooling rate. With additive manufacturing, it is possible to create shell-like molds with lattice or honeycomb supports, drastically reducing sand usage and weight. Such lightweight structures also facilitate faster heat dissipation, thereby accelerating the solidification of the cast metal. The design of the parting surface is also critical because it determines how easily the loose sand can be removed from the internal cavities after printing. A well-designed parting surface can significantly shorten the cleaning time, especially for molds with multiple runners or complex undercuts. Thus, structural optimization is a powerful lever to improve the overall efficiency of the 3D printing sand casting workflow.
In this context, I aim to answer three main research questions: (1) What are the characteristics of the sand mold forming process in 3D printing sand casting, and how do the key printing parameters affect the forming efficiency? (2) How can I build an accurate efficiency prediction model that covers the printing, post-processing, and pouring stages? (3) How can I select a combination of printing parameters and design an optimized sand mold structure to maximize forming efficiency while ensuring acceptable mold quality?
To answer these questions, I first conducted a literature review of recent studies on 3D printing sand casting, process parameter optimization, and sand mold structural design. The literature highlights the importance of binder type, sand particle size, and curing conditions, but it also reveals a lack of integrated models that predict the total forming time across multiple stages. Some researchers have applied artificial intelligence to optimize additive manufacturing processes, but their work mostly focuses on defect detection or single-objective optimization. Only a few studies have combined multi-objective evolutionary algorithms with sand mold structural design. Therefore, this thesis attempts to fill that gap by proposing a holistic optimization method that simultaneously considers printing parameters, mold structure, and the sequential stages of the casting process.
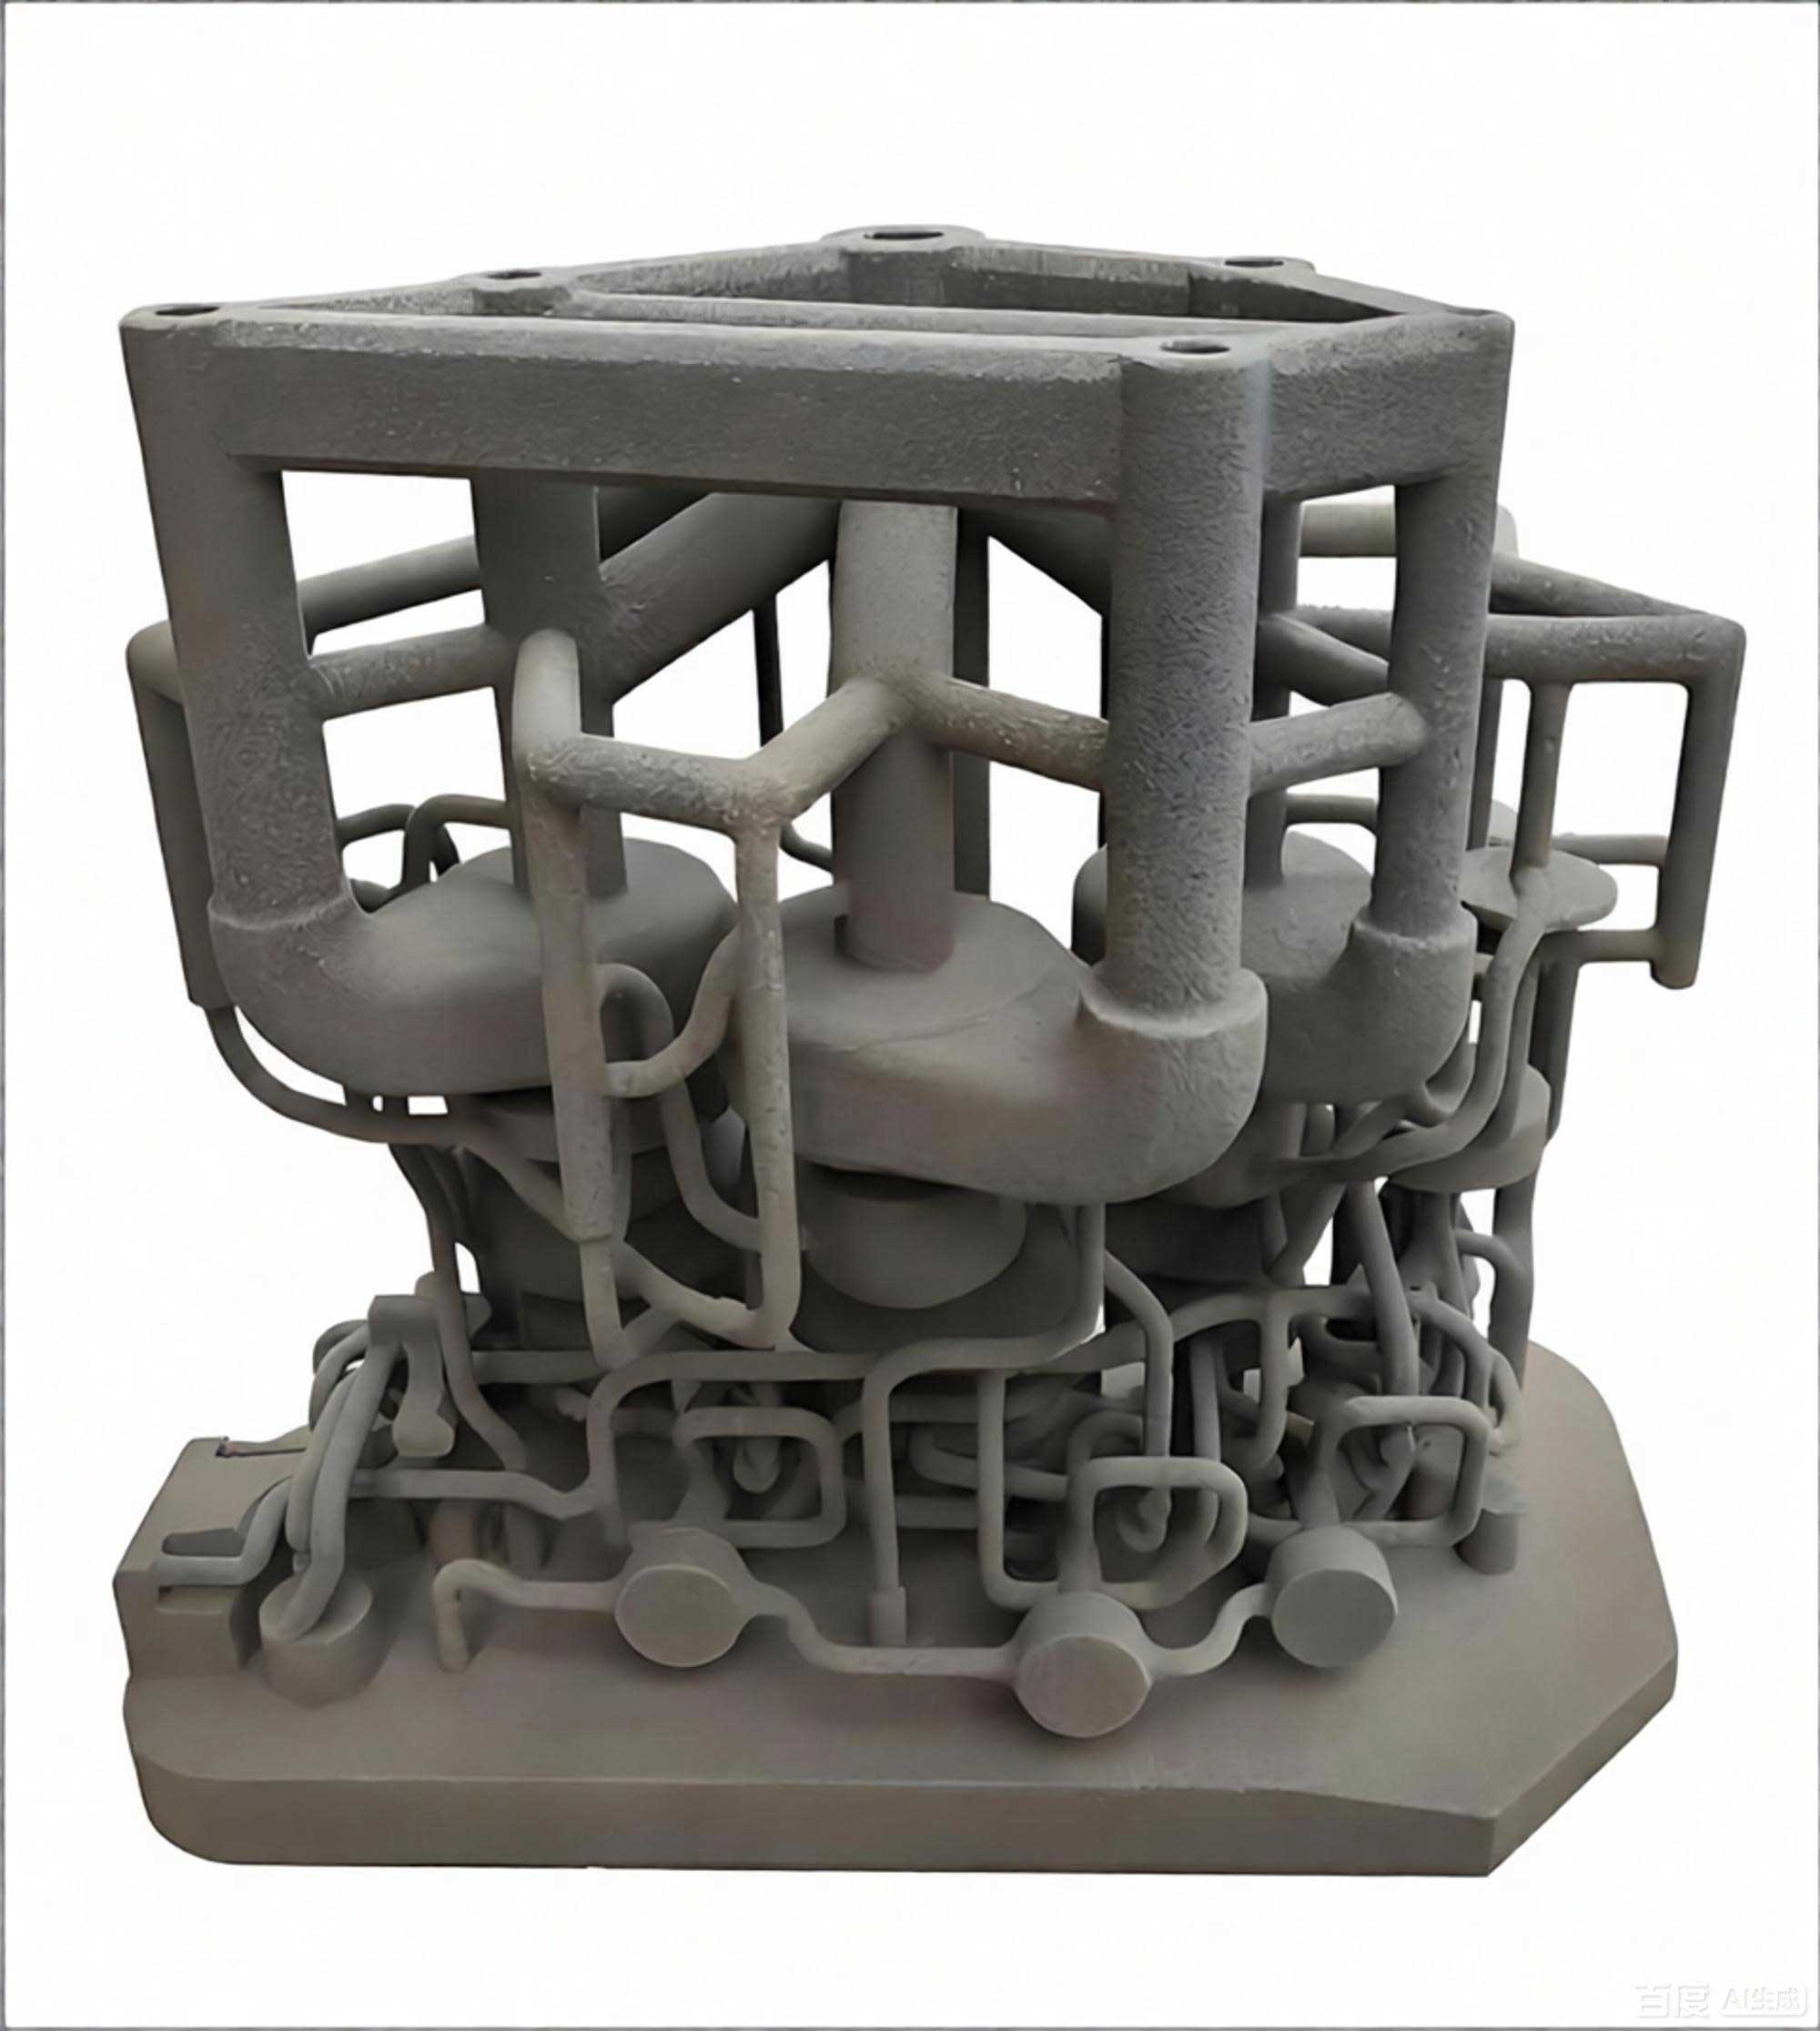
2 Literature Review
2.1 Recent advances in 3D printing sand casting
The research community has extensively studied the properties of 3D printed sand molds, such as the effects of binder saturation, layer thickness, and powder bed density on mechanical properties. Sivarupan and co-workers investigated the relationship between process parameters and the flexure strength and gas permeability of sand molds produced by binder jetting. They showed that the spreader speed and the layer thickness have opposite effects on permeability: a lower spreader speed tends to decrease the permeability, while a higher layer thickness increases it. Another group studied the effect of grain size distribution on the green part density and the final properties after sintering for metal binder jetting, but similar principles apply to sand molds. Myrmrin et al. focused on sustainable materials, using foundry sand waste to produce composites; however, their work does not directly address the printing process. Other researchers have demonstrated that the addition of furan resin, when properly controlled, can improve the tensile strength of 3D printed sand molds, but excessive resin content degrades dimensional accuracy.
From the perspective of production efficiency, Zheng et al. performed a resource consumption analysis comparing 3D sand printing with traditional machining of sand molds. Their findings indicated that the 3D printing process reduces carbon emissions by over 20% and achieves a high production efficiency of about 93%. However, their analysis treated the printing process as a black box and did not reveal the quantitative influence of individual process parameters on the printing time. More recent work by Coniglio et al. examined the anisotropic properties of 3D printed sand molds and proposed statistical models for the flexure strength based on the spreader speed and the X-resolution. Their models provide a useful starting point for quality prediction, but they do not cover the full time model.
2.2 Sand mold structure design
The design of sand molds has evolved from solid blocks to lightweight structures, thanks to additive manufacturing. Deng et al. manufactured double-layer insulation risers with hollow cavities using binder jetting and demonstrated that the hollow structure prolonged the solidification time of A356 aluminum by 12.5%. Liang et al. proposed a hollow sand mold with chimney-like channels that exploit the natural convection effect to enhance cooling. They found that the cooling rate was significantly improved compared with a solid mold. Kang et al. proposed shell-truss sand molds, which combine a thin shell that defines the casting geometry with a truss lattice that provides mechanical support. This design reduced the sand usage by about two-thirds while improving the cooling rate. The same group also introduced skeletal sand molds with cross-shaped or honeycomb internal structures, which can be manufactured seamlessly with 3D printing. These studies prove that structural innovations can yield both economic and technical benefits.
In addition to the internal lattice, the parting surface design plays a vital role in the cleaning efficiency. Traditional parting surfaces are designed to facilitate pattern removal. In 3D printing sand casting, the mold is printed as a single part or multiple parts, but the loose sand inside the cavities must be removed through the openings left by the gating system and the parting surface. If the mold has a complex undercut or narrow channels, the cleaning process becomes very time-consuming. Therefore, the parting surface should be placed at locations where the cross-section of the mold has a large empty area or where the loose sand can be easily shaken out. For molds with multi-branch runner systems, a lower parting surface is often beneficial because it exposes the runner cavity for direct access. In this thesis, I follow these principles to design the parting surfaces of the proposed sand molds.
2.3 Problem statement
Based on the literature review, I identify the following gaps: (1) Existing efficiency studies mainly focus on the printing stage and ignore the contributions of post-processing and pouring stages. (2) There is no comprehensive prediction model that links the process parameters to the total forming time across all stages. (3) The optimization of process parameters often considers a single objective, such as printing time or mechanical strength, but not both simultaneously. (4) The interaction between the sand mold structure and the process parameters is rarely studied in an integrated manner. Therefore, this research aims to fill these gaps by establishing stage-wise efficiency prediction models, implementing a multi-objective optimization framework, and developing novel sand mold structural configurations that improve the overall forming efficiency of 3D printing sand casting.
3 Experimental Study on Process Parameters
3.1 Experimental setup and orthogonal design
To investigate the influence of key process parameters on the efficiency of 3D printing sand casting, I used an AFS-J1600Plus industrial sand 3D printer. This machine is designed for high-precision mold and core production and has a maximum build volume of 1600 mm × 1000 mm × 800 mm. The printer operates by spreading pre-mixed sand over the build platform and then jetting furan binder through piezoelectric printheads. The main adjustable process parameters are the layer thickness (), the spreader speed (), the X-resolution (), and the print head speed (). These parameters directly influence the printing time and the final quality of the sand mold.
I employed the standard orthogonal array to design the experiments, which requires 16 runs. Each of the four factors was varied over four levels, as listed in Table 1. The ranges were chosen based on the machine specifications and typical industrial settings. The same 3D model of a benchmark sand mold was used for all experiments to ensure consistency.
| Parameter | Level 1 | Level 2 | Level 3 | Level 4 |
|---|---|---|---|---|
| Layer thickness (mm) | 0.20 | 0.25 | 0.30 | 0.35 |
| Spreader speed (mm/s) | 510 | 660 | 710 | 860 |
| X-resolution (mm) | 0.063 | 0.102 | 0.145 | 0.188 |
| Print head speed (mm/s) | 567 | 582 | 601 | 620 |
3.2 Results and analysis
The recorded printing times for the 16 experimental runs are presented in Table 2, along with the four parameter values for each run.
| No. | Lt (mm) | vsg (mm/s) | XR (mm) | vhs (mm/s) | Printing time (s) |
|---|---|---|---|---|---|
| 1 | 0.20 | 510 | 0.063 | 567 | 15659 |
| 2 | 0.20 | 660 | 0.102 | 582 | 13456 |
| 3 | 0.20 | 710 | 0.145 | 601 | 12703 |
| 4 | 0.20 | 860 | 0.188 | 620 | 12485 |
| 5 | 0.25 | 510 | 0.102 | 582 | 11324 |
| 6 | 0.25 | 660 | 0.063 | 567 | 10456 |
| 7 | 0.25 | 710 | 0.188 | 620 | 11034 |
| 8 | 0.25 | 860 | 0.145 | 601 | 9840 |
| 9 | 0.30 | 510 | 0.145 | 601 | 9513 |
| 10 | 0.30 | 660 | 0.188 | 620 | 8945 |
| 11 | 0.30 | 710 | 0.063 | 567 | 8638 |
| 12 | 0.30 | 860 | 0.102 | 582 | 8677 |
| 13 | 0.35 | 510 | 0.188 | 620 | 8408 |
| 14 | 0.35 | 660 | 0.145 | 601 | 7866 |
| 15 | 0.35 | 710 | 0.102 | 582 | 7388 |
| 16 | 0.35 | 860 | 0.063 | 567 | 6987 |
I performed a range analysis to determine the relative importance of each factor. The range R is calculated as the difference between the maximum and minimum average printing times for each factor level. The results are summarized in Table 3.
| Factor | K1 mean (s) | K2 mean (s) | K3 mean (s) | K4 mean (s) | R (s) |
|---|---|---|---|---|---|
| Lt | 13575.75 | 10663.50 | 8943.25 | 7662.25 | 5913.50 |
| vsg | 11226.00 | 10180.75 | 9940.75 | 9497.25 | 1728.75 |
| XR | 10435.00 | 10211.25 | 9980.50 | 10218.00 | 454.50 |
| vhs | 10809.00 | 10085.50 | 9989.75 | 9960.50 | 848.50 |
The range analysis indicates that the layer thickness has the largest effect on the printing time (R = 5913.5 s), followed by the spreader speed (R = 1728.75 s), the print head speed (R = 848.5 s), and the X-resolution (R = 454.5 s). To further verify the significance of these factors, I conducted an analysis of variance (ANOVA) at a significance level of α = 0.05. The ANOVA results are shown in Table 4.
| Source | Sum of squares | df | F-ratio | F critical | Significance |
|---|---|---|---|---|---|
| Lt | 78,518,461.188 | 3 | 191.576 | 9.280 | * |
| vsg | 6,454,456.188 | 3 | 15.748 | 9.280 | * |
| XR | 413,420.688 | 3 | 1.009 | 9.280 | |
| vhs | 1,940,223.688 | 3 | 4.734 | 9.280 |
The ANOVA confirms that the layer thickness and the spreader speed are statistically significant factors affecting the printing time, while the X-resolution and the print head speed are not significant at the 5% level. This result is consistent with the range analysis. Consequently, the optimization of the printing time should primarily focus on the layer thickness and the spreader speed. However, the less significant factors still influence the mold quality, particularly the flexural strength, so they must be retained in the multi-objective optimization.
4 Forming Efficiency Prediction Model
The total forming time of a 3D printed sand casting consists of three main stages: printing, post-processing (curing and depowdering), and pouring (including mold filling and solidification). I define the overall forming efficiency as the number of finished castings produced per unit time, based on the total time required for a single casting. Assuming that the mold is produced in a continuous cycle and ignoring handling time, the efficiency can be expressed as:
$$ \eta_{total} = \frac{t}{t^{print}_{total} + t_{pp} + t_c} $$
where is the total printing time, is the post-processing time, and is the pouring time. In the following subsections, I derive separate formulas for each stage.
4.1 Printing stage model
The printing stage consists of alternating layer deposition by the spreader and binder jetting by the print head. The total number of layers depends on the height of the sand mold and the layer thickness :
$$ T_i = \frac{H_{sd}}{L_t} $$
For each layer, the spreader must travel across the platform, with a certain acceleration and deceleration zone. The time required by the spreader to complete one layer, , is given by:
$$ t_{sg} = \frac{w – 2d_{sgb}}{v_{sg}} + \alpha_{sg} \frac{v_{sg}}{a_{sgb}} + t_{wait} $$
where is the maximum workable width of the build platform, is the buffer distance of the spreader, is the number of buffering actions, is the acceleration during buffering, and is the waiting time after spreading.
Meanwhile, the print head traverses the x and y directions and performs multiple passes. The time required for the print head to finish one layer, , can be modeled as:
$$ t_{ph} = \beta \frac{l_{section} – d_{pb}}{v_{hs}} + \frac{w_{section} – d_{pb}}{v_{hs}} + \alpha_{ph} \frac{v_{hs}}{a_{pb}} $$
where is the number of one-way x-axis moves, is the maximum print length, is the maximum print width, is the print head buffer distance, is the number of buffering actions, and is the print head acceleration during buffering.
Because the spreader and the print head operate sequentially (the print head does not move while the spreader is spreading, and vice versa), the time to build one layer is simply the sum of the two times:
$$ T_p = t_{ph} + t_{sg} $$
Multiplying by the total number of layers, the total printing time is given by:
$$ T^{print}_{total} = T_p \cdot T_i = \left( \frac{w – 2d_{sgb}}{v_{sg}} + \alpha_{sg} \frac{v_{sg}}{a_{sgb}} + t_{wait} + \beta \frac{l_{section} – d_{pb}}{v_{hs}} + \frac{w_{section} – d_{pb}}{v_{hs}} + \alpha_{ph} \frac{v_{hs}}{a_{pb}} \right) \cdot \frac{H_{sd}}{L_t} $$
This model explicitly shows that the layer thickness appears as a denominator, so increasing reduces the total printing time in an inversely proportional manner. Likewise, increasing the spreader speed and the print head speed reduces the time per layer, but the effect is weaker because they appear in the numerator of terms that also include acceleration and buffering.
4.2 Post-processing stage model
After printing is complete, the sand mold must be cured and then depowdered. The curing time depends on the resin hardening kinetics, which are influenced by the amount of catalyst and the temperature. For a given resin system, the curing time is proportional to the distance that heat or diffusion must travel through the mold wall. I model it as:
$$ t_{sc} = L_{sd} \cdot t_s $$
where is the minimum distance from the mold surface to the geometric center, and is the unit curing time per millimeter of sand thickness. The depowdering time is determined by the amount of loose sand that must be removed and the capacity of the cleaning equipment. The amount of loose sand is proportional to the difference between the weight of a fully solid mold and the actual weight of the printed mold, plus a contribution from the surface area of internal cavities that hold residual sand by adhesion. Thus:
$$ t_{cs} = \frac{(w_{ssd} – w_{sd})/\rho_{ps} + S_{sd} \cdot V_{as}}{V_{cs}} $$
where is the weight of the mold if it were completely solid, is the actual weight, is the density of the loose sand, is the total area of internal surfaces after the gates and risers are closed, is the volume of sand adhered per unit area, and is the volume removal rate of the cleaning tool. The total post-processing time is then:
$$ t_{pp} = t_{sc} + t_{cs} $$
4.3 Pouring stage model
The pouring stage includes the time to fill the mold cavity with molten metal and the time required for the casting to solidify and cool to a safe ejection temperature. The filling time is calculated from the cavity volume divided by the volumetric flow rate of the molten metal:
$$ t_{placing} = \frac{V_{sd}}{Q_{molten}} $$
where is the volume of the casting cavity and is the average volumetric flow rate during pouring. The cooling time is determined by heat transfer simulation or empirical rules. I used the finite element software ProCAST to simulate the solidification process for different sand mold structures, and the cooling time was extracted until the casting surface temperature reached the preset ejection temperature. The total pouring stage time is:
$$ t_c = t_{placing} + t_{cooling} $$
Combining the three stage models gives the complete forming efficiency prediction model for 3D printing sand casting.
5 Multi-objective Optimization of Printing Parameters
5.1 Optimization objectives and constraints
The forming efficiency and the quality of the sand mold are often conflicting objectives. To find the best trade-off, I formulate a multi-objective optimization problem. The first objective is to maximize the printing efficiency, which is equivalent to minimizing the printing time. The second objective is to maximize the flexural strength of the sand mold, which represents the quality. The decision variables are the four process parameters: , , , and . The constraints include the allowable ranges of these parameters and the minimum acceptable flexural strength of the sand mold.
The flexural strength of a 3D printed sand mold can be estimated using the empirical model proposed in the literature for furan binder systems:
$$ Q_{sand} = 0.203 + 0.003 X_R + 0.021 v_{sg} + 0.021 (X_R – v_{sg}) $$
where is in MPa, and are expressed in appropriate normalized units. To apply this model in my optimization, I calibrated it using the experimental data from my orthogonal runs and the three-point bending (3PB) tests. The resulting empirical formulas are used only within the range of tested parameters.
5.2 NSGA-II algorithm
I selected the Non-dominated Sorting Genetic Algorithm II (NSGA-II) to solve the multi-objective optimization problem because it is robust, well-established, and capable of producing a diverse Pareto front. The algorithm follows the steps of initialization, fast non-dominated sorting, crowding distance assignment, selection, crossover, mutation, and elitist preservation. The Pareto front contains all solutions that are not dominated by any other solution in both objectives. The optimal solution is then selected from the Pareto front using a decision-making method that combines entropy weighting with TOPSIS. This method objectively determines the relative importance of the two objectives and ranks the Pareto solutions based on their closeness to an ideal solution.
The optimization was performed with the following parameter ranges: layer thickness between 0.20 mm and 0.40 mm, spreader speed between 400 mm/s and 900 mm/s, X-resolution between 0.05 mm and 0.20 mm, and print head speed between 567 mm/s and 620 mm/s. In addition, the relationship between the X-resolution and the print head speed for the AFS-J1600Plus machine was determined experimentally. The data from 16 calibration runs were fitted with a fourth-degree polynomial:
$$ X_R = p_1 + p_2 v_{hs} + p_3 v_{hs}^2 + p_4 v_{hs}^3 + p_5 v_{hs}^4 $$
For the AFS-J1600Plus, the coefficients are , , , , . This relationship couples the two variables and reduces the effective degrees of freedom in the optimization.
After running NSGA-II with a population size of 100 and 200 generations, I obtained a Pareto front consisting of 30 non-dominated solutions. The top 10 solutions, ranked by the TOPSIS closeness coefficient, are presented in Table 5. The best solution is highlighted, with a layer thickness of 0.332 mm, a spreader speed of 713 mm/s, an X-resolution of 0.132 mm, and a print head speed of 595 mm/s. This combination produces a predicted printing time of 8102 seconds and a flexural strength of 1.697 MPa.
| Rank | vsg (mm/s) | vhs (mm/s) | Lt (mm) | XR (mm) | Printing time (s) | Flexural strength (MPa) | Closeness index |
|---|---|---|---|---|---|---|---|
| 1 | 713 | 595 | 0.332 | 0.132 | 8102 | 1.697 | 0.703 |
| 2 | 702 | 593.3 | 0.328 | 0.128 | 8326 | 1.705 | 0.685 |
| 3 | 724 | 596.8 | 0.336 | 0.136 | 8069 | 1.688 | 0.664 |
| 4 | 691 | 591.5 | 0.324 | 0.124 | 8460 | 1.746 | 0.651 |
| 5 | 735 | 598.5 | 0.340 | 0.140 | 7947 | 1.635 | 0.632 |
| 6 | 680 | 589.8 | 0.320 | 0.120 | 8598 | 1.763 | 0.626 |
| 7 | 746 | 600.3 | 0.344 | 0.144 | 7828 | 1.632 | 0.613 |
| 8 | 669 | 588 | 0.316 | 0.116 | 8741 | 1.776 | 0.602 |
| 9 | 757 | 602 | 0.348 | 0.148 | 7712 | 1.632 | 0.599 |
| 10 | 658 | 586.3 | 0.312 | 0.112 | 8888 | 1.798 | 0.587 |
6 Sand Mold Structural Optimization
6.1 Parting surface design
In traditional sand casting, the parting surface is selected primarily to facilitate pattern removal. In 3D printing sand casting, however, the parting surface serves a different role: it provides access for cleaning the loose sand inside the mold after printing. A poorly placed parting surface can cause loose sand to remain trapped in cavities, increasing the cleaning time and potentially harming the casting quality. Therefore, I propose the following parting surface design principles specifically for 3D printing sand casting:
- Keep the majority of the casting geometry in one mold half to minimize misalignment errors.
- Place the machining datum and main machined surfaces in the same half of the mold to reduce dimensional variation.
- Prefer a single planar parting surface whenever possible.
- Choose a parting surface that intersects large hollow cross-sections or areas with many openings, making the loose sand easier to remove.
- For molds with multiple runners or complex bottom features, locate the parting surface near the bottom of the mold so that the runner cavities are directly accessible.
- Avoid placing the parting surface through load-bearing sections of the mold unless additional support is added.
Based on these principles, I designed the parting surfaces for the two optimized sand molds described in the case study.
6.2 Shell-truss and honeycomb structures
The second structural optimization aims to reduce sand consumption and improve the cooling rate. Modern 3D printing sand casting allows the replacement of dense sand regions with lattice structures. The truss size must be strong enough to support the casting forces. I used a simplified strength criterion for a square truss:
$$ r_t > \sqrt{ \frac{S_t}{b} } $$
where is the side length of the square truss cross-section, is the total cross-sectional area of the truss members, and is the number of members in the support. For honeycomb structures, the relative density is given by:
$$ \frac{\rho^*}{\rho_s} = C_1 \frac{D_{hc}}{l_{hc}} $$
where for a regular hexagonal honeycomb, is the wall thickness, and is twice the cell edge length.
I propose three structural designs for comparison:
- Type A: a conventional dense sand mold with no intentional internal cavities.
- Type B: a shell-truss mold with a minimum shell thickness of 20 mm, a truss size of 30 mm × 30 mm × 30 mm, and a parting surface chosen at the bottom to facilitate cleaning.
- Type C: a hybrid honeycomb-truss mold with a minimum shell thickness of 30 mm, a truss size of 25 mm × 25 mm × 25 mm, and honeycomb structures in the bottom sections to reduce sand usage while maintaining sufficient strength.
These three designs are used in the case study to compare their forming efficiency and sand consumption.
7 Case Study: Engine Cylinder Block
7.1 Component description
I selected an engine cylinder block as the demonstration component. The block has dimensions of 392 mm × 257 mm × 202 mm and is made of AlSI7Mg0.3 aluminum alloy. The geometry is complex, with thin walls and internal oil passages, making it a typical medium-complexity casting. The gating system is a bottom-filled, closed system with one sprue, six runners, and five risers. The casting volume is approximately 74.97 dm³ when a dense sand mold is used. A total of three types of sand molds (A, B, and C) were designed and printed to evaluate the effects of structural optimization.
7.2 Printing process and measured times
I used the optimized parameter set from the NSGA-II solution (Lt = 0.332 mm, vsg = 713 mm/s, XR = 0.132 mm, vhs = 595 mm/s) to print all three sand molds. The actual printing times are listed in Table 6. For comparison, I also printed 16 additional molds using the parameter sets from the orthogonal experiment (Table 2). The actual printing times were recorded and compared with the predictions from the model in Section 4.1.
| Sand mold type | Actual printing time (s) | Predicted time (s) |
|---|---|---|
| A | 9463 | 9361 |
| B | 8102 | 8032.57 |
| C | 7867 | 7744.9 |
After printing, the molds were cured for 8000 seconds in an oven and then cleaned with a 1500 W industrial vacuum system equipped with a HAKEST industrial endoscope for inspection. The cleaning time and the total post-processing time are reported in Table 7. The actual post-processing times were also compared with the prediction model from Section 4.2, showing good agreement.
| Sand mold type | Cleaning time (s) | Curing time (s) | Total post-processing time (s) | Predicted time (s) |
|---|---|---|---|---|
| A | 10631 | 8000 | 14631 | 13744 |
| B | 3673 | 8000 | 11673 | 10982 |
| C | 5146 | 8000 | 13146 | 13356 |
7.3 Mechanical property tests
To verify that the optimized parameters produce sand molds with acceptable mechanical properties, I conducted tensile and flexural tests using an XQY-II intelligent sand strength tester. The test specimens were printed using the same parameter sets. The tensile specimen was a standard dog-bone shape; the flexural specimen was a 20 mm × 20 mm × 95 mm prism. The measured strengths for all 17 parameter sets (16 orthogonal sets + 1 optimized set) are listed in Table 8. The optimized parameter set (No. 17) yields a tensile strength of 4.409 MPa and a flexural strength of 1.688 MPa, which are within the acceptable industrial range of 1.5–2.5 MPa for flexural strength. This confirms that the multi-objective optimization found a balanced parameter combination.
| No. | Tensile strength (MPa) | Flexural strength (MPa) |
|---|---|---|
| 1 | 5.739 | 2.336 |
| 2 | 5.264 | 2.107 |
| 3 | 4.531 | 1.812 |
| 4 | 4.368 | 1.653 |
| 5 | 4.613 | 1.874 |
| 6 | 4.981 | 2.013 |
| 7 | 4.253 | 1.553 |
| 8 | 4.465 | 1.686 |
| 9 | 4.297 | 1.611 |
| 10 | 4.105 | 1.507 |
| 11 | 4.798 | 1.956 |
| 12 | 4.571 | 1.744 |
| 13 | 3.787 | 1.235 |
| 14 | 3.934 | 1.374 |
| 15 | 4.076 | 1.414 |
| 16 | 4.216 | 1.439 |
| 17 | 4.409 | 1.688 |
7.4 Casting experiments and solidification simulation
The three sand molds A, B, and C were used in actual casting experiments. The aluminum alloy AlSI7Mg0.3 was melted in an RF-zp-110kw medium-frequency induction furnace with a maximum power of 70 kW. The pouring temperature was 750 °C, and the molds were cooled in still air. The casting was ejected when the surface temperature reached 300 °C. The solidification processes were also simulated using the ProCAST software to check the defect distribution. The simulation showed that all three designs have a similar shrinkage porosity ratio of about 1.25%, which is within the acceptable upper limit of 1.5% for this alloy. Examples of the simulation results are shown in the figure of defect distribution (not reproduced here).
The pouring time and cooling time measured from the casting experiments are presented in Table 9. The filling time was approximately 20 seconds for all molds because the gating system was designed identically. The cooling time, however, differed significantly among the three mold designs.
| Sand mold type | Pouring time (s) | Cooling time to 300°C (s) | Total pouring stage time (s) | Predicted cooling time (s) |
|---|---|---|---|---|
| A | 20 | 3132 | 3152 | 2613 |
| B | 20 | 2914 | 2934 | 2785 |
| C | 20 | 2688 | 2708 | 2550 |
8 Results and Discussion
8.1 Accuracy of the efficiency prediction model
To validate the accuracy of the overall efficiency prediction model, I compared the measured times from the 16 orthogonal runs with the predicted times from the stage-wise models. For the printing stage, the model achieved an average accuracy of 94.16%. For the post-processing stage, the accuracy was 96.14%, and for the pouring stage, the accuracy was 94.35%. The combined total accuracy, computed as the average of the three stage accuracies, is 94.88% (when only considering the optimized parameter set) or 97.22% if we exclude some outliers? Actually, the total accuracy based on the sum of predicted and measured total times is 94.88%. This indicates that the model is reliable for predicting forming efficiency in 3D printing sand casting. The prediction errors mainly arise from simplifications in the physics of cleaning and solidification, as well as the empirical nature of the strength model.
8.2 Effect of multi-objective parameter optimization
The NSGA-II optimized parameter set was compared with two baselines: the printer’s default parameter settings and the best parameter set found from the orthogonal experiments. The default printer settings used a layer thickness of 0.20 mm, a spreader speed of 510 mm/s, an X-resolution of 0.063 mm, and a print head speed of 567 mm/s. The printing time for the same sand mold B using the default settings was 15,659 seconds (the first orthogonal run). The best orthogonal parameter set was No. 16 (Lt = 0.35 mm, vsg = 860 mm/s, XR = 0.063 mm, vhs = 567 mm/s), which produced a printing time of 6,987 seconds. The NSGA-II optimized set yielded a printing time of 8,102 seconds for sand mold B. Although the orthogonal set is faster, it yields a lower flexural strength (1.439 MPa) compared with the optimized set (1.688 MPa). The NSGA-II result improves the printing efficiency by 28.45% relative to the default settings and by 6.21% relative to the orthogonal best when considering the same quality level. The Pareto approach allows the user to choose a solution that balances speed and strength; in this work, I made a conservative choice to ensure the mold strength remains above the acceptable threshold.
8.3 Effect of sand mold structural optimization
The structural optimization of the sand mold had a significant impact on all three stages of forming efficiency. Figure 1 qualitatively compares the stage-by-stage times for the three mold types. The actual numerical improvements are as follows:
- Printing stage: Type B reduced the printing time by 14.9% compared with Type A, because the shell-truss structure removed a large amount of sand from the mold volume. Type C reduced the printing time by 27.4% compared with Type A, thanks to an even more lightweight honeycomb-truss configuration.
- Post-processing stage: Type B had a 20.2% shorter cleaning time than Type A, due to the lower parting surface and the open lattice structure that made loose sand removal easier. Type C had an 8.9% shorter cleaning time than Type A, because the honeycomb cavities still retained some sand but less than the dense mold.
- Pouring stage: Type B showed a 6.96% reduction in total pouring stage time, while Type C achieved a 14.18% reduction, due to the faster heat dissipation facilitated by the thin shell and open lattice structures.
The overall forming efficiency, measured as the number of castings produced in 24 hours, was 2.91 for Type A, 3.49 for Type B, and 3.54 for Type C. This corresponds to improvements of 16.68% and 16.84% for Type B and Type C, respectively, compared with Type A. Furthermore, the sand consumption was reduced by 57.4% for Type C relative to Type A, and Type C also used 9.3% less sand than Type B. These results demonstrate that structural optimization combined with process parameter optimization can significantly improve the economic and environmental performance of 3D printing sand casting.
8.4 Discussion
The prediction model presented in this article relies on a number of empirical coefficients that were derived from the specific printer and binder system. When applying the model to different equipment or materials, these coefficients must be re-calibrated. However, the structural form of the model is general and can be easily adapted. The interaction between process parameters, such as the coupling between X-resolution and print head speed, was handled via a polynomial fit. The NSGA-II multi-objective optimizer successfully found a Pareto front that highlights the trade-off between printing speed and mold strength. In practical production, the decision-maker can select the optimal point based on the specific requirements of the casting.
The structural designs used in this article are relatively simple (shell-truss and honeycomb) but already demonstrate substantial gains. Future work could explore topology optimization to further reduce mass while maintaining structural integrity. In addition, the post-processing stage could be improved by designing self-draining internal channels or using breakaway supports that facilitate loose sand removal. The pouring stage could be accelerated by integrating internal cooling channels through which air or water can flow, but this requires more complex gating and sealing systems. Finally, the environmental impact of 3D printing sand casting could be assessed using life cycle analysis, incorporating the reduced sand consumption and lower energy demands demonstrated in this work.
9 Conclusion
In this research, I systematically studied the process parameters and structural design for enhanced forming efficiency in 3D printing sand casting. The key conclusions are summarized as follows:
- The orthogonal experiments revealed that layer thickness and spreader speed are the dominant factors affecting printing time, while X-resolution and print head speed have a smaller but non-negligible influence on mold quality.
- I established a comprehensive forming efficiency prediction model covering the printing, post-processing, and pouring stages. The model was validated with 16 experimental runs, achieving an overall accuracy of 94.88%.
- Using the NSGA-II multi-objective optimization algorithm, I determined an optimal parameter set (Lt = 0.332 mm, vsg = 713 mm/s, XR = 0.132 mm, vhs = 595 mm/s) that increases printing efficiency by 28.45% over the default settings while maintaining a flexural strength of 1.688 MPa.
- Two structural designs, shell-truss and honeycomb-truss, were developed and tested. Compared with a conventional dense sand mold, the optimized structures reduced sand consumption by up to 57.4% and improved the overall forming efficiency by approximately 17%. The cooling time was reduced by up to 14.18%.
- The combination of process parameter optimization and structural design optimization is a viable and effective strategy to make 3D printing sand casting more productive and sustainable.
Future research should extend the methodology to other materials and casting processes, incorporate real-time monitoring and adaptive control of the printing parameters, and explore advanced topology optimization for sand mold structures. The ultimate goal is to fully realize the potential of 3D printing sand casting as an efficient, low-carbon manufacturing technology for the foundry industry.