
As an engineer specializing in foundry processes, I have extensively researched rapid sand casting techniques to address the challenges in manufacturing complex automotive components. The engine cylinder head, with its intricate geometry and high performance requirements, is a prime candidate for sand castings. Traditional methods often involve long lead times and high costs, but rapid sand casting offers a promising alternative for prototyping and small-batch production. In this article, I will share my insights on designing and optimizing a rapid sand casting process for an aluminum alloy cylinder head, emphasizing numerical simulation, gating system design, and material selection to enhance efficiency and quality. The goal is to produce high-integrity sand castings that meet stringent automotive standards.
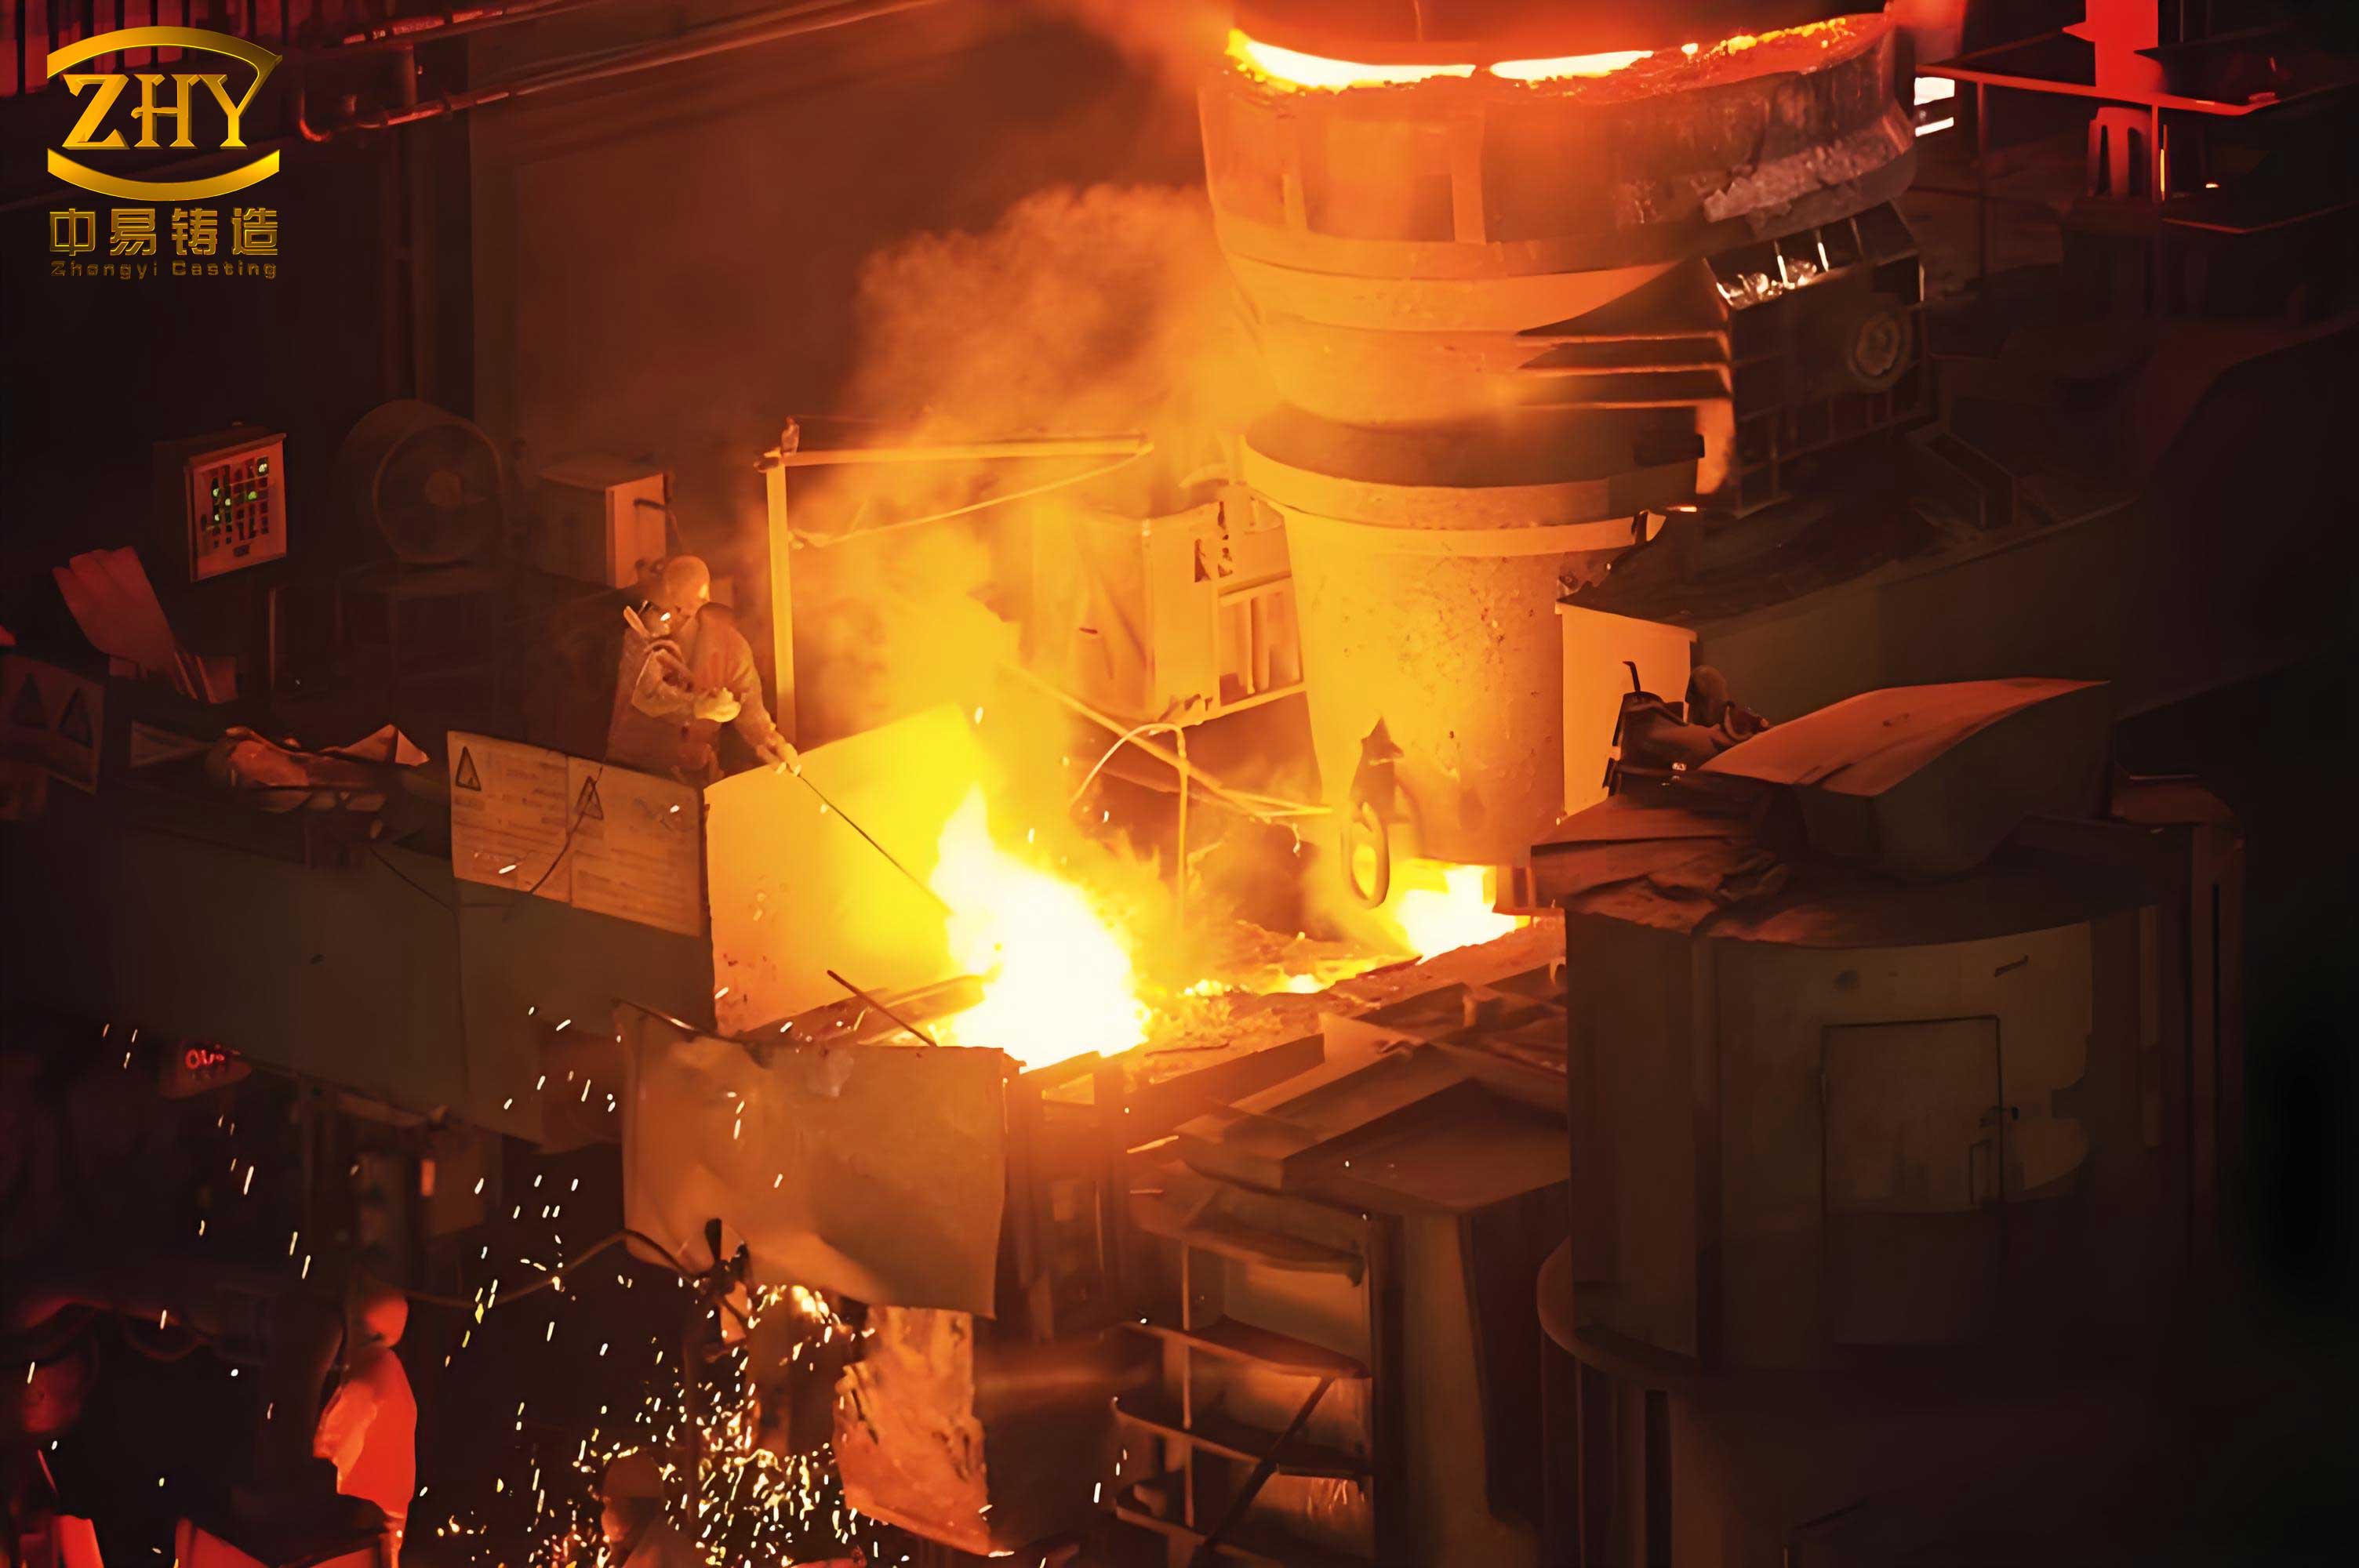
Sand castings are widely used in the automotive industry due to their flexibility and cost-effectiveness, especially for parts like cylinder heads that require complex internal passages. The cylinder head discussed here is made of ZL105 aluminum alloy, a common material for sand castings because of its good castability and mechanical properties. Its dimensions are 425 mm in length, 200 mm in width, and 135 mm in height, with a weight of approximately 12.5 kg. The minimum wall thickness is 4 mm, classifying it as a medium-sized thin-walled casting. The structure includes multiple irregular cavities, holes, bosses, and reinforcing ribs, which pose significant challenges in sand castings to avoid defects such as shrinkage porosity and misruns. A 3D model created using UG NX software facilitated the initial design phase, allowing for precise visualization and modification of the casting geometry.
The casting process design for sand castings begins with core assembly, which is critical for forming internal features. Cores for oil passages, water passages, intake ports, and exhaust ports were designed individually and assembled using positioning blocks and core prints to ensure accuracy. This step is vital in sand castings to maintain dimensional stability and prevent core shift during pouring. The cores were reinforced with chaplets to withstand the metallostatic pressure of the molten aluminum. The following table summarizes the core types and their functions in the sand casting process.
| Core Type | Function | Material | Key Features |
|---|---|---|---|
| Oil Passage Cores | Form internal oil galleries | Phenolic urethane resin sand | Long and slender, require reinforcement |
| Water Passage Core | Create cooling water jackets | Phenolic urethane resin sand | Complex geometry with thin sections |
| Intake Port Cores | Shape intake manifold passages | Phenolic urethane resin sand | Precision positioning for airflow optimization |
| Exhaust Port Cores | Form exhaust gas channels | Phenolic urethane resin sand | High-temperature resistance requirements |
For the gating system in sand castings, I proposed two schemes: a top-pouring scheme (Scheme 1) and a bottom-pouring scheme (Scheme 2). Scheme 1 involves four ingates on the top side of the casting, which allows for rapid filling but may lead to turbulence and oxide inclusion. Scheme 2 uses a single side-bottom ingate, promoting smoother filling and reduced turbulence, which is often preferred for sand castings of complex shapes. The gating system was designed as an open type, with the sprue serving as the choke section. The total ingate area was calculated using fundamental fluid dynamics principles for sand castings. The formula for ingate area is derived from the Bernoulli equation and continuity equation:
$$ A_{\text{ingate}} = \frac{G_L}{\rho \mu t \sqrt{2g h_p}} $$
where \(A_{\text{ingate}}\) is the total cross-sectional area of the ingates (mm²), \(G_L\) is the total mass of aluminum alloy flowing through the ingates (kg), \(\rho\) is the density of the aluminum alloy (taken as 2.7 g/cm³ for ZL105 alloy), \(\mu\) is the flow loss coefficient (typically 0.6 to 0.8 for sand castings), \(t\) is the pouring time (s), \(g\) is the gravitational acceleration (9.81 m/s²), and \(h_p\) is the average static head (mm). The pouring time \(t\) is estimated based on the casting weight and wall thickness using empirical relations for sand castings:
$$ t = k \sqrt[3]{\delta G_L} $$
where \(\delta\) is the average wall thickness (mm) and \(k\) is a coefficient depending on casting complexity (usually 1.5 to 2.0 for thin-walled sand castings). For this cylinder head, with \(\delta = 4\) mm and \(G_L = 12.5\) kg, assuming \(k = 1.8\), the pouring time is calculated as:
$$ t = 1.8 \times \sqrt[3]{4 \times 12.5} = 1.8 \times \sqrt[3]{50} \approx 6.7 \, \text{s} $$
The average static head \(h_p\) depends on the gating design and is given by:
$$ h_p = \frac{H – \frac{C}{2}}{1 + \left(\frac{A_{\text{sprue}}}{A_{\text{runner}}}\right)^2} $$
where \(H\) is the height of the sprue (mm), \(C\) is the height of the casting (mm), and \(A_{\text{sprue}}\) and \(A_{\text{runner}}\) are the cross-sectional areas of the sprue and runner, respectively. For sand castings, the cross-sectional areas are typically sized in ratios to control flow velocity. I adopted a ratio of \(\Sigma A_{\text{sprue}} : \Sigma A_{\text{runner}} : \Sigma A_{\text{ingate}} = 1:2:4\) for both schemes, which is common in open gating systems for aluminum sand castings. The ingates were designed as flat sections to minimize heat loss, and the runners as trapezoidal sections to enhance flow stability. The table below compares key parameters of the two gating schemes for sand castings.
| Parameter | Scheme 1 (Top-Pouring) | Scheme 2 (Bottom-Pouring) |
|---|---|---|
| Number of Ingates | 4 | 1 |
| Ingate Configuration | Flat, located on top side | Flat, located on side-bottom |
| Runner Design | Trapezoidal cross-section | Trapezoidal cross-section |
| Calculated Ingate Area (mm²) | Approx. 480 | Approx. 120 |
| Pouring Temperature Range | 690–720°C | 690–720°C |
| Estimated Pouring Rate | 0.75–1.5 kg/s | 0.22 m/s (velocity) |
Risers were incorporated to compensate for solidification shrinkage in sand castings. Two open risers were placed on the top of the casting, positioned over thick sections to ensure adequate feeding. The riser volume was determined using the modulus method, which compares the cooling rates of the casting and riser. The riser modulus \(M_r\) should be greater than the casting modulus \(M_c\) to promote directional solidification:
$$ M_r = \frac{V_r}{A_r} > M_c = \frac{V_c}{A_c} $$
where \(V_r\) and \(A_r\) are the volume and surface area of the riser, and \(V_c\) and \(A_c\) are the volume and surface area of the casting region being fed. For sand castings, a safety factor of 1.2 is often applied, so \(M_r \geq 1.2 M_c\). Based on the cylinder head geometry, risers with diameters of 40 mm and heights of 60 mm were designed, providing sufficient feed metal to minimize shrinkage defects in sand castings.
Numerical simulation is a powerful tool for optimizing sand castings, as it predicts fluid flow, temperature distribution, and defect formation without physical trials. I used ProCAST software to simulate both gating schemes. The material properties and boundary conditions were defined to reflect real-world sand castings. The alloy was ZL105 aluminum with thermophysical properties from the software database, and the mold and cores were modeled as phenolic urethane resin sand with appropriate thermal conductivity and permeability. The initial conditions included a pouring temperature range of 690–720°C, a pouring rate of 0.75–1.5 kg/s for Scheme 1 and 0.22 m/s for Scheme 2, and an initial mold temperature of 20–30°C. The simulation focused on filling patterns, solidification sequences, and defect prediction for sand castings.
For Scheme 1, the filling simulation showed rapid mold filling within 2.5 s, but with significant turbulence and air entrapment near the ingates. The temperature field analysis revealed that after filling, the top regions cooled quickly, while the bottom remained hotter, leading to an unfavorable temperature gradient. The solidification time varied from 120 s at the risers to over 300 s at thick sections, indicating poor feeding. Defect prediction using the Niyama criterion highlighted concentrated shrinkage cavities in the lower thick areas and scattered microporosity in thin walls. The Niyama criterion \(N_y\) is given by:
$$ N_y = \frac{G}{\sqrt{T}} $$
where \(G\) is the temperature gradient (°C/mm) and \(T\) is the cooling rate (°C/s). Regions with \(N_y\) below a threshold (typically 1.0 °C¹/²·s¹/² for aluminum sand castings) are prone to shrinkage porosity. In Scheme 1, many areas had \(N_y < 0.8\), confirming defect risks. The table below summarizes the simulation outcomes for Scheme 1 sand castings.
| Aspect | Result | Implication for Sand Castings |
|---|---|---|
| Filling Time | 2.5 s | Fast but turbulent, may cause oxide inclusions |
| Temperature Gradient | Inverse gradient (top cools first) | Poor directional solidification, leading to shrinkage |
| Solidification Time | 120–300 s | Non-uniform, thick sections solidify last |
| Defect Prediction | Concentrated shrinkage cavities in lower thick areas | High reject rate in sand castings |
| Niyama Criterion | Low values (< 0.8) in multiple regions | High risk of porosity in sand castings |
In contrast, Scheme 2 exhibited superior performance in sand castings. The filling simulation demonstrated a smooth, progressive fill from the bottom ingate, taking 4.8 s to complete with minimal turbulence. The temperature field showed a favorable gradient from the bottom to the top, with the risers remaining hot longest. Solidification was directional, starting from the thin walls and moving toward the risers, completing in about 220 s overall. Defect prediction indicated only uniformly dispersed microporosity, with no major shrinkage cavities. The Niyama criterion values were mostly above 1.2, indicating sound sand castings. The optimal parameters were identified as a pouring temperature of 690°C and a pouring velocity of 0.22 m/s, which balanced filling and solidification for high-quality sand castings. The comparative analysis underscores the advantages of bottom-pouring schemes for complex sand castings like cylinder heads.
| Aspect | Result | Implication for Sand Castings |
|---|---|---|
| Filling Time | 4.8 s | Smooth and controlled, reducing defect risks |
| Temperature Gradient | Positive gradient (bottom to top) | Promotes directional solidification and feeding |
| Solidification Time | Approx. 220 s | Uniform, with risers solidifying last |
| Defect Prediction | Uniformly dispersed microporosity only | Acceptable for most sand casting applications |
| Niyama Criterion | Values > 1.2 in critical regions | Low porosity risk in sand castings |
| Optimal Parameters | 690°C, 0.22 m/s | Recommended for production sand castings |
The selection of molding materials is crucial for rapid sand castings, as it affects surface finish, dimensional accuracy, and production speed. I chose phenolic urethane resin sand due to its fast curing and good collapsibility. To optimize the resin content, I conducted an orthogonal experiment with two factors: Component I (the resin part) and Component II (the catalyst). Each factor was tested at four levels: 2.5 g, 5 g, 7.5 g, and 10 g per 400 g of base silica sand (40–70 mesh). The tensile strength of the sand cores was measured after curing for 40 minutes, as this property directly impacts the robustness of sand castings during handling and pouring. The experimental design and results are presented in the table below.
| Experiment No. | Component I (g) | Component II (g) | Tensile Strength (MPa) | Observations for Sand Castings |
|---|---|---|---|---|
| 1 | 2.5 | 2.5 | 0.6 | Inadequate strength, core breakage likely |
| 2 | 5.0 | 2.5 | 0.9 | Moderate strength, suitable for simple sand castings |
| 3 | 7.5 | 2.5 | 1.1 | Good strength, ideal for complex sand castings |
| 4 | 10.0 | 2.5 | 1.3 | High strength, but may hinder collapsibility |
| 5 | 2.5 | 5.0 | 0.7 | Low strength, not recommended for sand castings |
| 6 | 5.0 | 5.0 | 1.0 | Adequate strength for most sand castings |
| 7 | 7.5 | 5.0 | 1.2 | Excellent strength, optimal for rapid sand castings |
| 8 | 10.0 | 5.0 | 1.4 | Very high strength, but cost-ineffective |
| 9 | 2.5 | 7.5 | 0.8 | Marginal strength, limited to low-stress sand castings |
| 10 | 5.0 | 7.5 | 1.1 | Good balance for sand castings |
| 11 | 7.5 | 7.5 | 1.3 | High strength, suitable for critical sand castings |
| 12 | 10.0 | 7.5 | 1.5 | Excessive strength, may cause veining in sand castings |
| 13 | 2.5 | 10.0 | 0.9 | Moderate strength, but catalyst waste |
| 14 | 5.0 | 10.0 | 1.2 | Strong cores for sand castings |
| 15 | 7.5 | 10.0 | 1.4 | Very strong, but high cost for sand castings |
| 16 | 10.0 | 10.0 | 1.6 | Maximum strength, overkill for most sand castings |
The data showed that tensile strength increases with resin content, but beyond certain levels, the benefits diminish for sand castings. A statistical analysis using regression modeling revealed the relationship between resin components and tensile strength. The response surface can be approximated by:
$$ \sigma_t = \alpha_0 + \alpha_1 C_I + \alpha_2 C_{II} + \alpha_3 C_I C_{II} + \alpha_4 C_I^2 + \alpha_5 C_{II}^2 $$
where \(\sigma_t\) is the tensile strength (MPa), \(C_I\) and \(C_{II}\) are the masses of Component I and Component II (g), and \(\alpha_i\) are coefficients determined from the data. For rapid sand castings, a tensile strength of 1.0 to 1.2 MPa is sufficient to withstand handling stresses while allowing easy shakeout. Based on the experiment, I recommend a composition with Component I at 0.8–1.0% of the base sand weight and Component II at 1.0–1.2%, giving a 1:1 ratio approximately. This yields a tensile strength around 1.1 MPa, ideal for cost-effective and reliable sand castings.
To validate the optimized process, I produced the cylinder head using Scheme 2 with the recommended resin sand. The cores were assembled in the mold, coated with a refractory wash to improve surface finish, and poured at 690°C with a controlled pouring rate of 0.22 m/s. After cooling and shakeout, the casting was inspected for defects. Dimensional checks confirmed that the intake and exhaust ports met positional tolerances, and non-destructive testing (such as X-ray radiography) revealed only minor, uniformly dispersed porosity, consistent with the simulation predictions. The cylinder head underwent mechanical testing, including tensile and pressure tests, and satisfied the performance criteria for engine applications. This successful production demonstrates the efficacy of rapid sand castings for complex components, reducing development time from months to weeks compared to traditional methods.
In summary, rapid sand casting is a versatile and efficient process for manufacturing engine cylinder heads and similar intricate parts. Through systematic design and optimization—encompassing gating scheme evaluation via numerical simulation, core design for accuracy, and material selection for strength—I achieved high-quality sand castings with minimal defects. The bottom-pouring scheme with a single side ingate proved superior, offering controlled filling and directional solidification. The use of phenolic urethane resin sand with optimized resin content ensures robust molds and cores for sand castings. This approach not only accelerates prototyping but also reduces costs, making it invaluable for automotive innovation. Future work could explore advanced simulation techniques or alternative bonding agents to further enhance sand castings. As sand castings continue to evolve, they remain a cornerstone of modern foundry practice, bridging the gap between design complexity and manufacturing feasibility.