
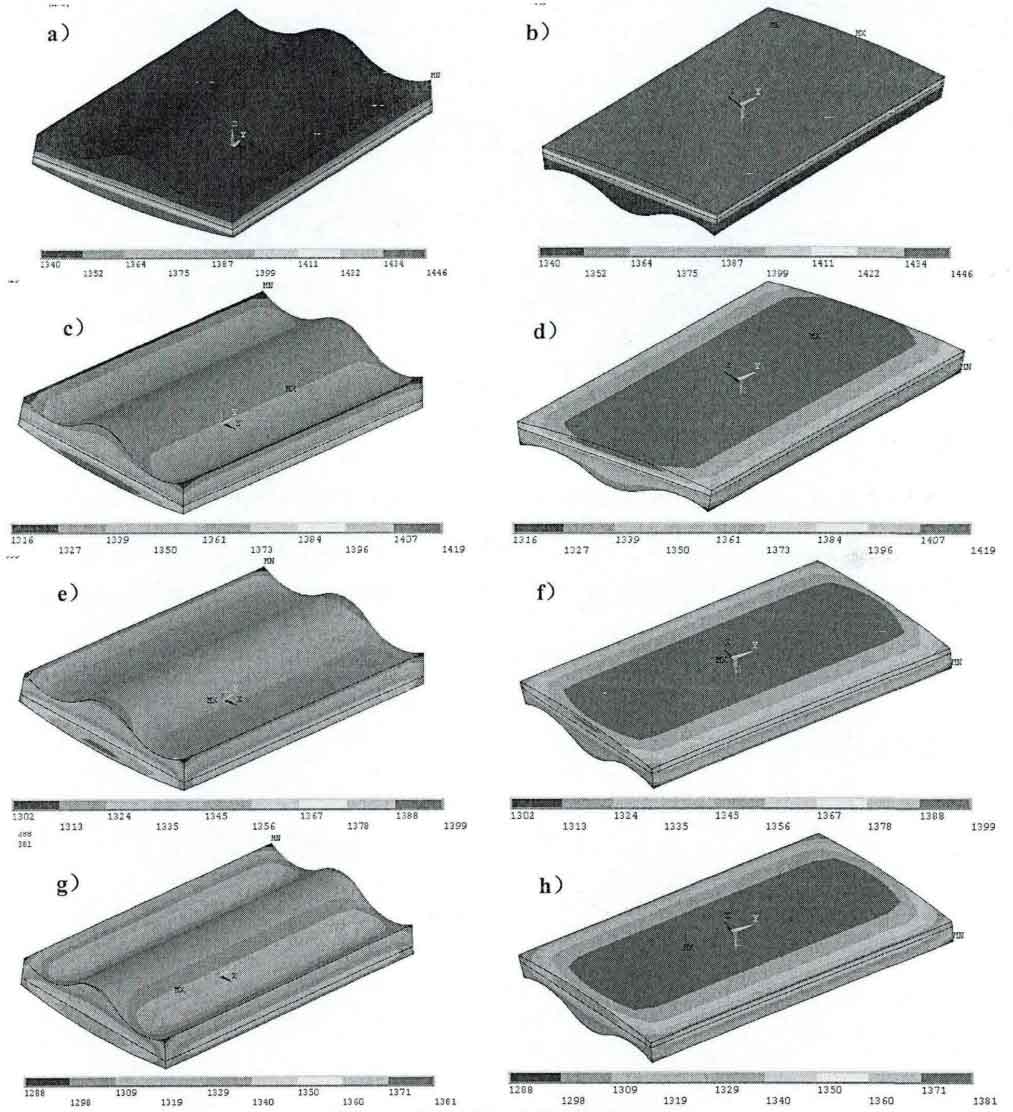
The following figure shows the temperature field distribution of the bimetal casting lining plate at different times during solidification. The color cloud chart shows that the carbon steel layer and the high chromium cast iron layer transfer heat to the outside at the same time, and the high temperature carbon steel layer also transfers heat to the low temperature high chromium cast iron layer. There is a uniform temperature gradient near the interface.
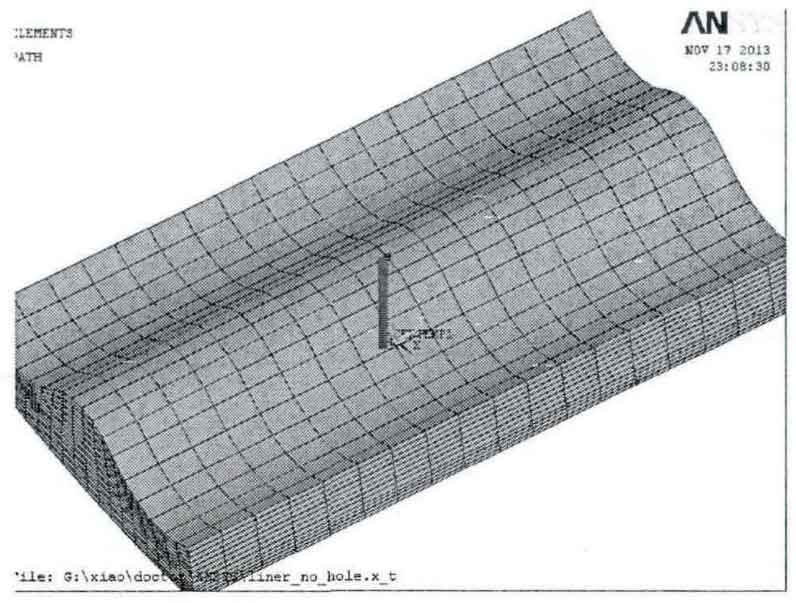
Select nodes No. 787 and 2623 to define the path, as shown in the figure below. The red straight line at the center of the casting lining plate through the high chromium cast iron layer and carbon steel layer is the key path defined in this analysis.
As shown in the figure below, the temperature distribution of the critical path at different times of 5S, 30s, 55s and 90s can be obtained. It can be seen that the metal temperature on both sides decreases gradually with time, but near the composite interface, it can be seen that the high-temperature carbon steel poured later will transfer heat to the high chromium cast iron poured first, which also provides the necessary temperature conditions for the formation of metallurgical bonding near the interface. This is also consistent with the previous color cloud chart. In addition, because the thermal conductivity of cast iron is higher than that of dry sand mold, the temperature peak shifts to the high chromium cast iron layer.
