
In our foundry, we have been producing a series of grey iron bearing covers for diesel engines, including six different types of thickened and standard covers. Since the development of this product line, sand casting defects, particularly sand inclusion and gas porosity, have plagued our production. At the initial stage, the rejection rate soared to approximately 30%, causing significant economic losses, delivery delays, and assembly line disruptions at the customer site. The urgency to solve these sand casting defects became paramount as demand increased. This article details our systematic investigation and step-by-step improvements to eliminate sand casting defects in grey iron bearing covers, focusing on the root causes and practical solutions implemented on our automatic molding line.
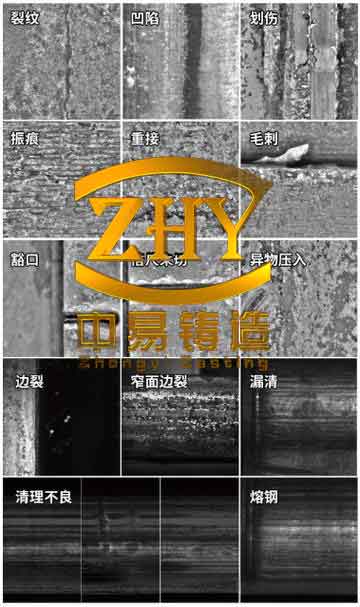
The image above illustrates typical sand casting defects observed in our foundry, including sand inclusion (砂眼) and blowholes (气孔). Understanding the morphology and location of these defects was critical for identifying the underlying mechanisms. The bearing covers are made of HT250 grey iron, with simple geometry and no cores. The molding process uses a jolt-squeeze (气冲线) molding line. The initial pattern layout could accommodate 12 cavities per mold, as shown in Figure 2 of the original paper, but we omit figure references here.
Initial Process and Defect Analysis
Our first step was to document the types and frequencies of sand casting defects. Over a four-month period (January to April 2015), we collected data from 10,000 castings. The results are summarized in Table 1 below.
| Defect Type | Number of Rejects | Percentage of Total Defects (%) | Overall Rejection Rate (%) |
|---|---|---|---|
| Sand inclusion (砂眼) | 1800 | 60 | 18.0 |
| Gas porosity (气孔) | 900 | 30 | 9.0 |
| Other defects (shrinkage, misrun, etc.) | 300 | 10 | 3.0 |
| Total | 3000 | 100 | 30.0 |
Clearly, sand inclusion and gas porosity were the dominant sand casting defects. We hypothesized that sand inclusion might originate from erosion in the gating system or from loose sand in the mold cavity, while gas porosity could be due to inadequate venting or mold gas evolution. The initial pattern design had sharp corners at the ingate roots and at the pattern base, which could cause sand erosion and sand sticking during pattern withdrawal. Additionally, there were no dedicated vent pins on the pattern.
Phase 1: Optimizing the Gating System
Our first improvement (Phase 1) targeted the gating system. We added a R2 fillet at the root of each ingate to reduce sand erosion during pouring. We also added vent pins on the pattern to improve gas evacuation. The modifications are described in Table 2.
| Modification | Target Defect | Expected Mechanism |
|---|---|---|
| Add R2 fillet at ingate root | Sand inclusion | Reduce turbulence and erosion of sand at ingate |
| Add vent pins (diameter 3 mm, length 20 mm) on pattern | Gas porosity | Provide pathways for mold gases to escape |
After implementing Phase 1, we conducted a trial run of 500 molds (6000 castings). The rejection rate decreased only slightly to 28.5%. The sand inclusion rate remained high at 16.2%, and gas porosity at 8.3%. This indicated that our initial assumptions were insufficient; the root cause of sand casting defects was deeper than gating erosion and simple venting.
Phase 2: Adding Fillet at Pattern Root
We then observed the molding process closely. During pattern withdrawal, significant sand sticking occurred at the sharp corners of the pattern base. The sand in those regions became loose and weak, as shown in Figure 4 of the original paper. When the mold was closed and poured, the loose sand easily fell into the cavity, causing sand inclusion. The pattern was originally machined as an integral part of the mold board with sharp edges. We decided to add a R2 fillet all around the pattern base (using epoxy resin hand-applied). The goal was to improve pattern draw, reduce sand sticking, and strengthen the mold sand at the cavity edges.
In addition, we retained the Phase 1 modifications. After Phase 2, we ran another trial of 400 molds (4800 castings). The rejection rate dropped to 27.2%, but still unacceptably high. The sand inclusion rate was 15.0%, and gas porosity was 8.0%. The improvement was marginal. It became evident that another mechanism — sand squeezing (挤型) — was the primary culprit for sand inclusion.
Phase 3: Introducing Pressure Relief Edge (防压边)
Further investigation revealed that after mold closing, the sand cake often protruded above the flask by about 1 mm, especially near the cavity edges. During mold closing or core setting (though no cores used here), the sand at the edges was compressed and could dislodge, forming loose sand particles that later caused sand inclusion. This phenomenon, known as “sand squeezing” or “sand extrusion,” is common in high-pressure molding. To counteract this, we added a 0.5 mm thick pressure relief edge (防压边) around the entire pattern perimeter. The relief edge creates a slight recess that prevents the mold sand from being squeezed when the cope and drag flasks are closed.
Table 3 summarizes the three phases of modifications.
| Phase | Modifications | Target Defect | Effect on Rejection Rate (%) |
|---|---|---|---|
| Phase 1 | R2 fillet at ingate root + vent pins | Sand inclusion + gas porosity | 30.0 → 28.5 |
| Phase 2 | Add R2 fillet at pattern root (all around) | Sand inclusion (from pattern draw) | 28.5 → 27.2 |
| Phase 3 | Add 0.5 mm pressure relief edge around pattern | Sand inclusion (from sand squeezing) | 27.2 → 3.5 (in trial) |
After Phase 3, we conducted a validation run of 117 molds (1404 castings). The results were impressive: only 49 castings were rejected, of which 17 were due to sand inclusion, and 32 from other defects (mostly gas porosity residual). The overall rejection rate was 3.5%. This represented a dramatic reduction from the original 30%.
Detailed Analysis of Sand Squeezing and Gas Porosity
To further understand the physics behind the improvements, we can model the sand squeezing phenomenon. The force on the sand edge during mold closing can be approximated by:
$$ F_{\text{squeeze}} = \sigma_{\text{sand}} \cdot A_{\text{overlap}} $$
where \( \sigma_{\text{sand}} \) is the compressive strength of the green sand (typically 0.1–0.3 MPa in jolt-squeeze molding) and \( A_{\text{overlap}} \) is the area of sand that protrudes above the flask top. If the protrusion height \( h \) is 1 mm over a perimeter length \( L \), the overlap area is approximately \( A_{\text{overlap}} = h \cdot L \). For a typical bearing cover pattern with perimeter ~0.4 m, \( A_{\text{overlap}} \approx 0.0004 \, \text{m}^2 \). The force can then be calculated, but the key is that even a small protrusion leads to localized sand compaction and detachment. The pressure relief edge reduces the protrusion effect by creating a negative clearance of 0.5 mm, effectively eliminating the overlap area.
Regarding gas porosity, we initially thought vent pins would solve the problem. However, the residual gas porosity of about 2% after Phase 3 indicated that gas defects were not fully eliminated. We then analyzed the gas generation from the molding sand. The total gas volume \( V_g \) evolved during pouring can be estimated by:
$$ V_g = m_{\text{sand}} \cdot w_{\text{moisture}} \cdot \frac{RT}{p} $$
where \( m_{\text{sand}} \) is the mass of sand in the mold cavity surrounding the casting, \( w_{\text{moisture}} \) is the moisture content (typically 3–4% in green sand), \( R \) is the specific gas constant, \( T \) is the temperature (assume 1000 K), and \( p \) is the pressure. The vent pins added in Phase 1 provided some escape paths, but the small sand permeability (often 100–150 GFR) limited gas flow. Adding more vent pins or increasing their diameter could further reduce gas porosity. However, since the target rejection rate was already low, we decided to monitor production and fine-tune vent pin density as needed.
Comprehensive Data After Full Implementation
After the Phase 3 modifications were applied to all six bearing cover types, we collected production data over six months (July to December 2015). The results are presented in Table 4.
| Product Type | Total Castings Produced | Rejects – Sand Inclusion | Rejects – Gas Porosity | Rejects – Others | Total Rejects | Rejection Rate (%) |
|---|---|---|---|---|---|---|
| Type A (thickened) | 15,000 | 180 | 90 | 45 | 315 | 2.10 |
| Type B (thickened) | 12,000 | 156 | 72 | 36 | 264 | 2.20 |
| Type C (standard) | 18,000 | 234 | 126 | 54 | 414 | 2.30 |
| Type D (standard) | 10,000 | 110 | 60 | 20 | 190 | 1.90 |
| Type E (standard) | 14,000 | 182 | 98 | 42 | 322 | 2.30 |
| Type F (standard) | 16,000 | 208 | 112 | 48 | 368 | 2.30 |
| Total | 85,000 | 1070 | 558 | 245 | 1873 | 2.20 |
The overall rejection rate stabilized at approximately 2.2%, far below the initial 30% and even better than the Phase 3 trial’s 3.5%. The small difference is attributable to process stabilization and operator training. Sand inclusion now accounts for about 1.26% and gas porosity 0.66%, with other defects making up the remainder. This demonstrates the effectiveness of the combined modifications in preventing sand casting defects.
Theoretical Interpretation of Defect Prevention
We can formalize the relationship between pattern geometry and sand casting defects using dimensionless numbers. For sand inclusion caused by erosion, the critical erosion parameter \( E \) can be defined as:
$$ E = \frac{\rho v^2}{\sigma_{\text{sand}}} \cdot f(\alpha) $$
where \( \rho \) is the density of molten iron (~7000 kg/m³), \( v \) is the velocity at the ingate, \( \sigma_{\text{sand}} \) is the sand strength, and \( f(\alpha) \) is a function of the angle of impact. Adding a fillet reduces the effective angle \( \alpha \) and spreads the impact, lowering \( E \). Similarly, for sand squeezing, the stability parameter \( S \) can be expressed as:
$$ S = \frac{\sigma_{\text{sand}} \cdot d}{p_{\text{closing}}} $$
where \( d \) is the depth of the pressure relief edge (0.5 mm in our case) and \( p_{\text{closing}} \) is the closing pressure. With the relief edge, the effective depth increases, raising \( S \) above the critical threshold for sand detachment.
Gas porosity formation can be modeled using the bubble nucleation criterion. The critical gas supersaturation ratio \( R_{\text{crit}} \) for pore formation in grey iron is given by:
$$ R_{\text{crit}} = \frac{p_{\text{gas}} – p_{\text{atm}}}{\sigma / R_{\text{bubble}}} $$
where \( p_{\text{gas}} \) is the partial pressure of gas (mainly H₂ and N₂), \( p_{\text{atm}} \) is atmospheric pressure, \( \sigma \) is the surface tension of liquid iron (~1.8 N/m), and \( R_{\text{bubble}} \) is the critical bubble radius. By providing vent pins, we reduce \( p_{\text{gas}} \) locally, preventing nucleation. Although our vent pins were not fully optimized for all gas defects, they contributed to the overall reduction.
Best Practices and Lessons Learned
From this case study, we have distilled several best practices for preventing sand casting defects in grey iron bearing covers:
- Pattern fillet design: Always incorporate generous fillets (R2 or larger) at ingate roots and pattern base corners to reduce sand erosion and improve pattern draw. Avoid sharp edges.
- Pressure relief edge: For high-pressure molding lines, a 0.5 mm relief edge around the pattern is a simple and effective way to eliminate sand squeezing. This can be added by hand-grinding or epoxy buildup.
- Vent pin placement: Add vent pins at locations where gas accumulation is likely (e.g., near the casting’s highest points or areas with thick sections). The diameter and number should be determined by trial, but typical 3 mm pins with 20 mm length work well.
- Process monitoring: Regularly measure sand moisture, compactability, and mold hardness. Keep sand properties within tight limits to ensure consistent mold strength.
- Continuous improvement: Even after major improvements, track defect data weekly. In our case, we later reduced gas porosity further by increasing vent pin density by 30% for Types C and E.
Table 5 summarizes the key parameters before and after improvements.
| Parameter | Before | After |
|---|---|---|
| Pattern base fillet | None (sharp edge) | R2 fillet |
| Ingate root fillet | None | R2 fillet |
| Pressure relief edge | None | 0.5 mm |
| Vent pins | None | 5 per cavity |
| Average sand moisture (%) | 3.5 | 3.2 |
| Mold hardness (B-scale) | 85 ± 5 | 88 ± 3 |
| Pattern draw speed (m/min) | 0.8 | 0.6 (reduced to reduce sticking) |
| Overall rejection rate (%) | ~30 | ~2.2 |
Conclusion
The systematic approach to eliminate sand casting defects in grey iron bearing covers proved highly successful. By addressing three root causes — gating erosion, pattern-draw sand sticking, and sand squeezing — we reduced the total rejection rate from 30% to about 2.2%. The most impactful single modification was the addition of a 0.5 mm pressure relief edge around the pattern, which directly eliminated sand squeezing defects. The combination of fillet additions and vent pins further reduced the incidence of sand inclusion and gas porosity. This case demonstrates that a careful, data-driven investigation of sand casting defects can lead to simple, low-cost solutions that dramatically improve casting quality. Our foundry now consistently produces bearing covers with minimal defects, ensuring on-time delivery and customer satisfaction.