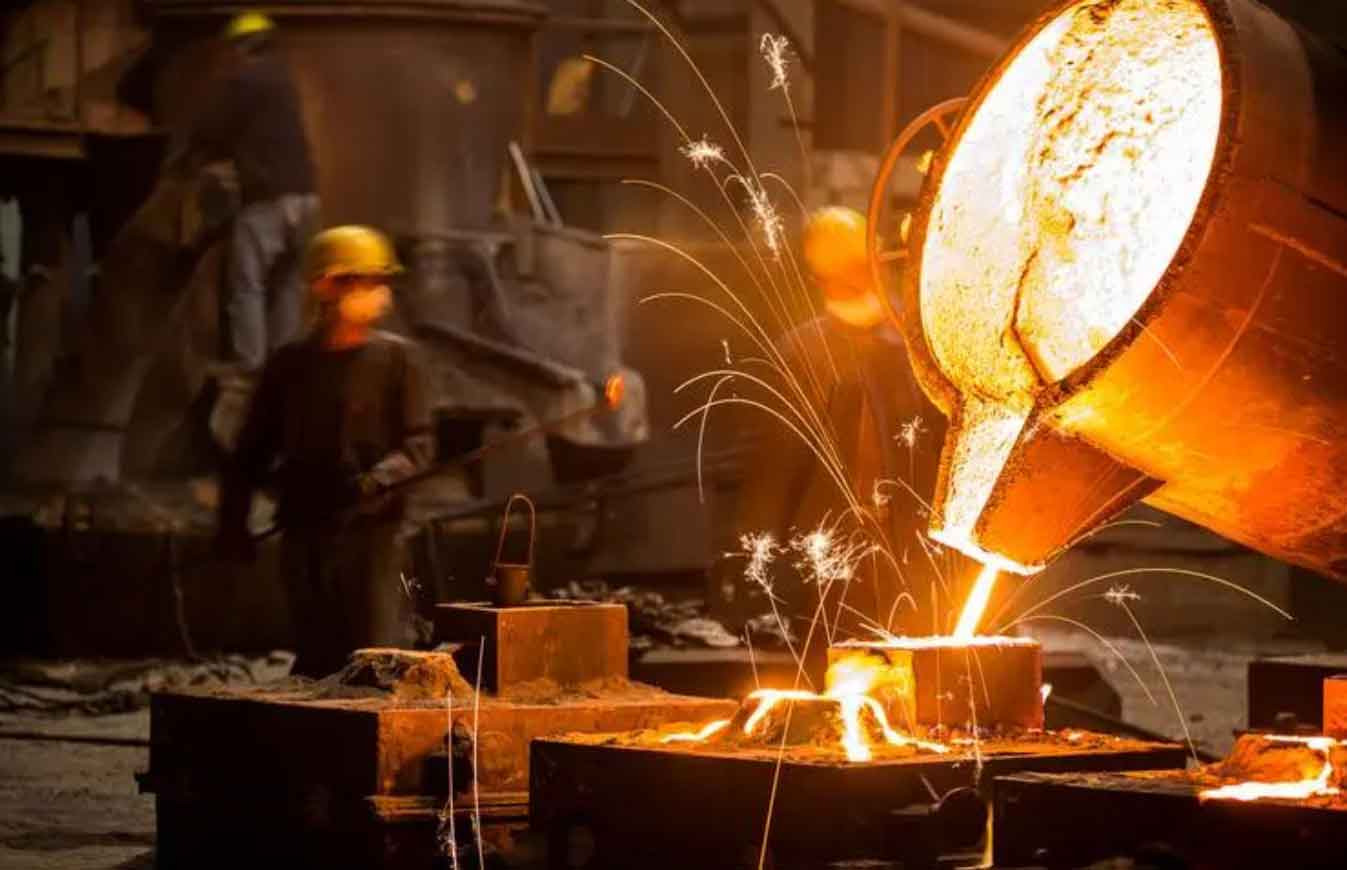
With increasing industrialization, global CO₂ emissions reached 36.7 billion tons in 2022, where manufacturing sectors like sand casting contribute significantly. This study proposes a hybrid carbon emission quantification model for individual sand-cast components, combining input-output (IO) and process analysis (PA) methodologies under life cycle assessment (LCA) principles. We establish a systematic framework to allocate emissions across material consumption, energy usage, and waste treatment phases while validating the model through a wind turbine locking disk case study.

1. Carbon Emission Sources in Sand Casting
Sand casting emissions originate from three subsystems:
- Material-related emissions: Resin sand, metal alloys, coatings
- Energy consumption: Melting, molding, transportation
- Waste treatment: Dust collection, slag disposal
The process boundary spans four stages:
$$ \text{Total Emissions } C_d = C_{M,d} + C_{E,d} + C_{U,d} $$
Where \( C_{M,d} \), \( C_{E,d} \), and \( C_{U,d} \) represent material, energy, and waste emissions for casting \( d \).
2. Mathematical Modeling
2.1 Material Emission Calculation
Resin sand consumption dominates molding-stage emissions:
$$ C_{VR,d}^1 = M_d R^1 (1-\eta) f_b $$
| Parameter | Description | Unit |
|---|---|---|
| \( M_d \) | Casting weight | kg |
| \( R^1 \) | Sand-metal ratio | – |
| \( \eta \) | Sand recycling rate | % |
| \( f_b \) | Resin sand emission factor | kgCO₂/kg |
2.2 Energy Emission Model
Melting furnace electricity constitutes 60-75% of energy emissions:
$$ C_{E,d}^2 = M_d(1+MIR)E_n f_e + \sum_{m=1}^{m_0} \frac{p_m s_m}{v_m M_d} f_e $$
| Equipment | Power (kW) | Efficiency |
|---|---|---|
| Induction furnace | 500-800 | 85-92% |
| Sand mixer | 10-15 | 6.3 kg/s |
| Crane | 20-25 | 16 m/min |
3. Case Study: Wind Turbine Locking Disk
A 6,932 kg QT500-14 ductile iron locking disk was analyzed with the following parameters:
$$ R^1 = \frac{\rho_b V_x}{\rho_m V_d} = \frac{1.48 \times 19.8}{7.08 \times 0.98} = 8.25 $$
| Material | Ratio (%) | Emission Factor |
|---|---|---|
| Steel scrap | 58.19 | 8.2 kgCO₂/kg |
| Pig iron | 24.69 | 2.13 kgCO₂/kg |
| Carburizer | 2.20 | 4.2 kgCO₂/kg |
Emission distribution results:
| Category | Emission (kgCO₂) | Percentage |
|---|---|---|
| Material | 44,791.79 | 91.3% |
| Energy | 4,234.82 | 8.6% |
| Waste | 14.55 | 0.1% |
4. Emission Reduction Strategies
Key measures for sand casting decarbonization:
- Optimize sand-metal ratio through mold design
- Increase recycled metal content (>70%)
- Adopt high-efficiency melting technologies
$$ \Delta C = M_d \left[ \Delta R^1(1-\eta)f_b + \Delta R_g^2 f_g \right] $$
Where \( \Delta R^1 \) and \( \Delta R_g^2 \) represent optimized process parameters.
5. Conclusion
This study establishes a practical carbon accounting framework for sand casting processes, enabling emission source identification and process optimization. The hybrid IO-PA model provides granular insights while maintaining computational efficiency, serving as a foundation for low-carbon foundry operations.
