
In this research, I systematically investigated the integration of numerical simulation and sand casting 3D printing technology for the production of a pump body. The pump body, a shell-like casting with complex internal cavities, was chosen as a representative case to demonstrate how modern digital tools can replace traditional pattern-making and reduce lead times. Throughout the study, I focused on designing three different gating systems—top gating, side gating, and bottom gating—and used AnyCasting software to simulate the filling and solidification processes. The optimal solution was then realized by manufacturing the sand mold directly via sand casting 3D printing. This approach not only eliminated the need for costly wooden patterns but also allowed for intricate geometries that are impossible with conventional sand molding. The final casting exhibited no significant defects, confirming the effectiveness of combining sand casting 3D printing with numerical simulation.
Motivation and Background
Sand casting has been a cornerstone of metal fabrication for centuries, yet traditional methods suffer from long lead times due to pattern fabrication and manual mold making. The emergence of sand casting 3D printing, where a binder is selectively deposited onto a bed of sand to build up a mold layer by layer, has revolutionized small-batch and prototype production. In sand casting 3D printing, no physical pattern is required; instead, a digital model is directly printed, reducing tooling costs and enabling design iterations overnight. For a pump body casting, the internal geometry (with irregular passages and varying wall thicknesses) poses challenges for both mold design and defect control. I aimed to harness the power of computational simulation to predict and mitigate defects such as shrinkage porosity, while leveraging sand casting 3D printing to fabricate the complex sand cores and mold halves.
I began by studying the pump body structure. The casting had overall dimensions of 410 mm × 503 mm × 170.5 mm, a mass of 57 kg, and was made of HT200 gray cast iron. The part was highly non‑symmetric, with a complex internal cavity. The selection of the parting line was critical: with sand casting 3D printing, there was no need for a flask, so the parting line could be placed at the maximum cross‑section of the casting, ensuring easy assembly. I modeled the upper and lower mold halves along with the sand core, and then processed the STL files in Magics for slicing. The layer thickness was set to 0.4 mm, and the scan line width to 1.5 mm. After slicing, the CLI file was sent to an AFS‑J1600 3D printer.
The core of my study was to compare three gating system designs: top gating, side gating, and bottom gating. Each system was modeled in 3D, exported as STL, and imported into AnyCasting for simulation. The mesh consisted of approximately 1 million regular hexahedral elements, each about 5.6 mm on a side. The pouring temperature was 1450 °C, and the pouring time was 18 seconds. The mold material was furan resin‑bonded sand, typical for sand casting 3D printing. The following table summarizes the key process parameters.
| Parameter | Value |
|---|---|
| Casting material | HT200 gray cast iron |
| Mold material | Furan resin-bonded sand |
| Pouring temperature | 1450 °C |
| Pouring time | 18 s |
| Mesh size | 5.6 mm × 5.6 mm × 5.6 mm |
| Total elements | ~1,000,000 |
Simulation Results: Comparison of Gating Systems
I evaluated the three gating systems based on solidification sequence, combined defect parameters, and shrinkage porosity fraction. The following subsections describe each case.
Top Gating System
With top gating, the metal entered from the top of the casting. The solidification proceeded from top to bottom and from the outer walls inward. The outer thin walls solidified first, while the thicker internal sections remained liquid longer. The simulation indicated that the casting would solidify completely after about 1294 seconds. The combined defect parameter (using the Niyama‑type criterion) highlighted potential shrinkage porosity on the outer walls and at the riser connection. The shrinkage porosity fraction map showed scattered defects both in the outer walls and in the internal cavity region. This suggested that top gating might lead to surface or internal porosity, which is undesirable for a pressure‑tight pump body.
Side Gating System
In the side gating design, the ingates were placed on the side of the casting. The solidification time was slightly shorter (1225 seconds) and the overall direction was still from top to bottom. However, the temperature gradient was more uniform, and the shrinkage defects were concentrated entirely within the risers, not in the casting itself. The combined defect parameter map showed high values only in the riser regions, and the shrinkage porosity fraction map confirmed that no porosity appeared in the casting body. This outcome was ideal because the risers would be cut off after casting, leaving a sound product.
Bottom Gating System
For bottom gating, the melt entered from the bottom, which slowed down the filling and caused the bottom region to stay hot longer. The solidification time increased to 1382 seconds. The simulation predicted defects at the interface between the risers and the casting, as well as shrinkage porosity in the middle of the casting, near the internal cavity walls. The combined defect parameter indicated that the slow cooling at the bottom promoted micro‑porosity in the thick sections. Therefore, bottom gating was deemed unsuitable.
To quantify the defect severity, I used a simplified Niyama criterion, which relates the temperature gradient \(G\) and cooling rate \(R\) to the likelihood of shrinkage porosity:
$$ \text{Niyama} = \frac{G}{\sqrt{R}} $$
A low Niyama value indicates a high probability of porosity. The table below summarizes the critical Niyama values and defect locations for each gating system.
| Gating System | Solidification Time (s) | Defect Location | Niyama (min) in casting body |
|---|---|---|---|
| Top gating | 1294 | Outer walls and internal regions | 0.12 |
| Side gating | 1225 | Only in risers | 0.35 |
| Bottom gating | 1382 | Riser-casting interface and middle wall | 0.18 |
Based on these results, side gating was selected as the optimal design. I placed nine risers on surfaces that would later be machined, with the riser height flush with the ingate plane to ensure effective feeding and gas escape.
3D Printing of Sand Molds and Cores
With the side gating design finalized, I exported the upper mold, lower mold, and sand core as STL files. The sand core incorporated a truncated cone for easy placement and increased stability. To reduce material consumption and printing time, I optimized the wall thickness of the mold while maintaining sufficient strength. The printing was performed on an AFS‑J1600 machine using furan resin‑bonded sand. The layer thickness of 0.4 mm and scan line width of 1.5 mm were chosen to balance resolution and build speed. After printing, loose, unbonded sand was removed using a vacuum cleaner and compressed air. The resulting molds and core are illustrated conceptually in the following figure, which shows a typical sand casting 3D printing setup.
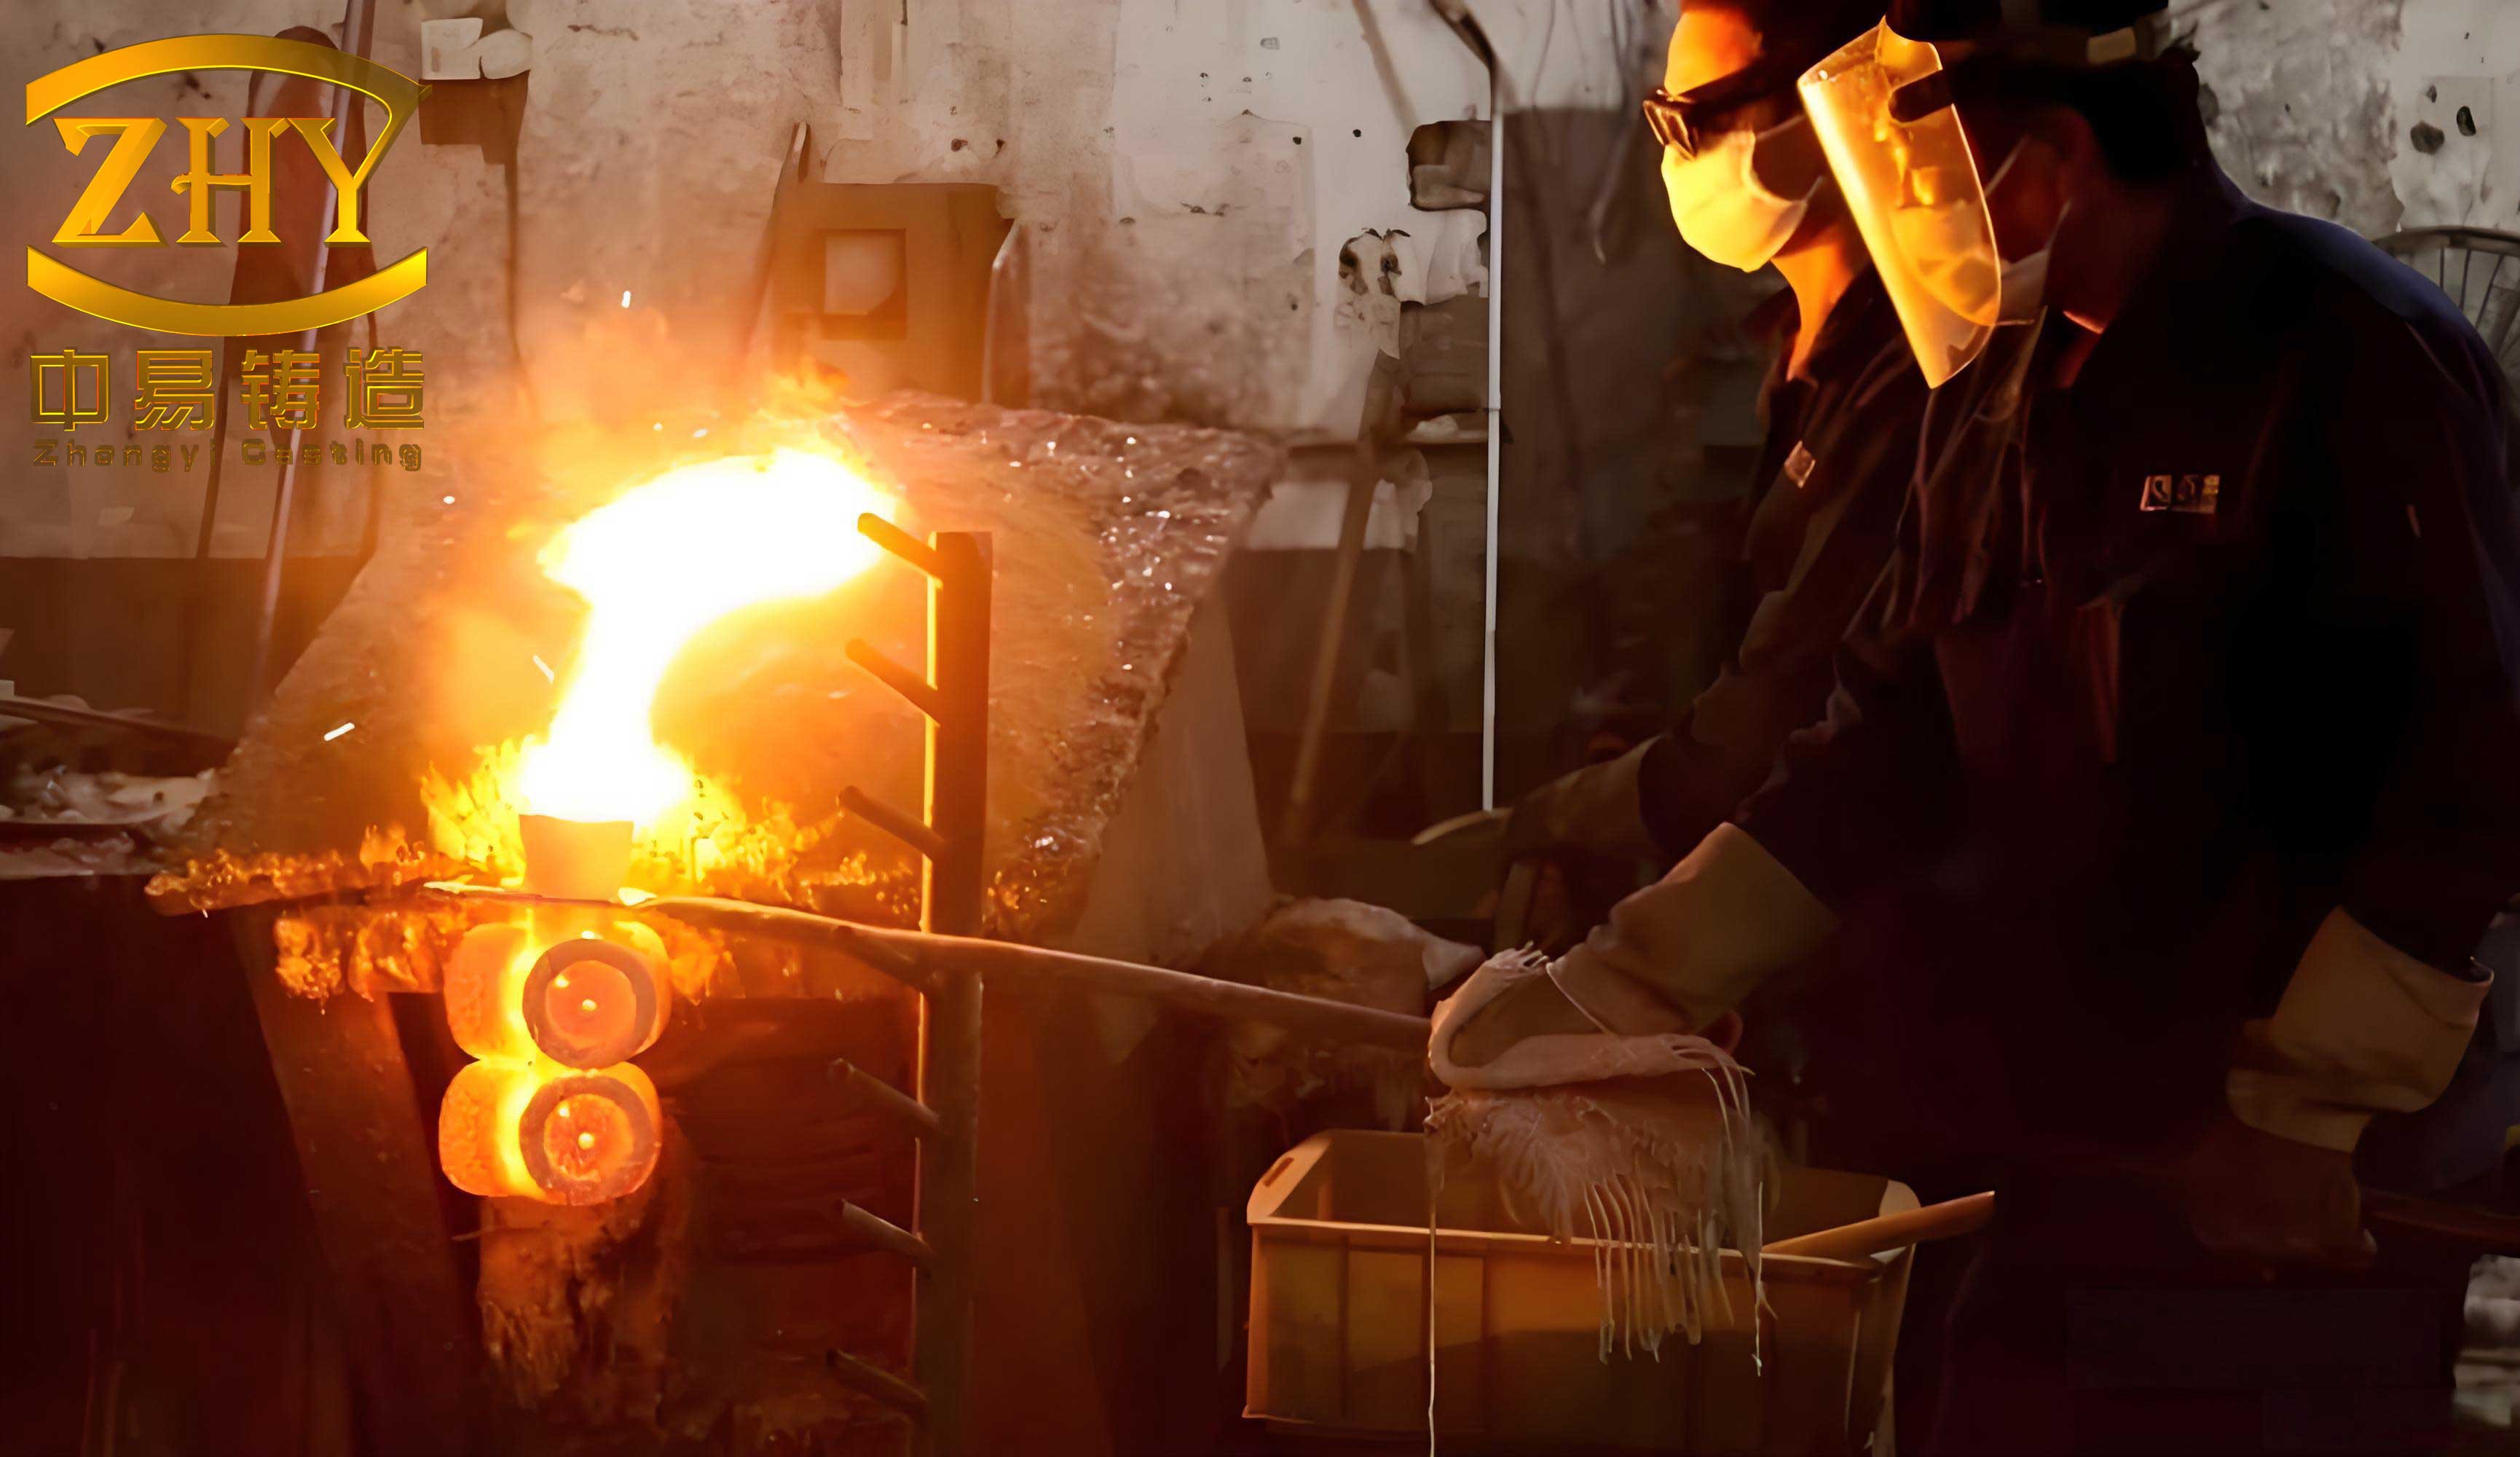
Before pouring, I applied a zirconium‑based coating (zircon flour) to the mold cavity surfaces to improve surface finish and reduce gas evolution. The coated molds were then baked to remove moisture. The HT200 melt was poured at 1450 °C, taking 18 seconds to fill the cavity. After solidification and cooling, the sand was knocked out, and the casting was cleaned. The resulting pump body exhibited a clean surface with no visible shrinkage porosity or cracks. The risers were removed, and the casting dimensions were within tolerance. This confirmed that the combination of sand casting 3D printing and simulation significantly reduced development time and cost.
Quantitative Analysis and Formulas
To further illustrate the advantages, I derived a simple relationship between printing time, mold complexity, and cost. In sand casting 3D printing, the total manufacturing cost \(C_{\text{total}}\) can be expressed as:
$$ C_{\text{total}} = C_{\text{material}} + C_{\text{printer}} \cdot t_{\text{build}} + C_{\text{post-processing}} $$
where \(t_{\text{build}}\) is the build time, which depends on the volume \(V\) of the mold and the layer thickness \(\Delta z\):
$$ t_{\text{build}} = \frac{V}{\Delta z \cdot v_{\text{scan}} \cdot w_{\text{scan}}} $$
Here, \(v_{\text{scan}}\) is the scan speed (e.g., 2 m/s) and \(w_{\text{scan}}\) is the scan line width (1.5 mm). For the pump body molds, the total volume was approximately 2.8 × 106 cm³, resulting in a build time of about 9 hours. In contrast, traditional pattern making would require at least 3 weeks. The mold cost was reduced by over 60%. The following table breaks down the cost comparison.
| Item | Traditional Method | Sand Casting 3D Printing |
|---|---|---|
| Pattern making time | ~21 days | 0 days (digital) |
| Mold fabrication time | ~5 days | ~9 hours (printing) + 2 hours (cleaning) |
| Tooling cost | $3,500 | $0 |
| Material cost (sand) | $200 | $280 (including resin) |
| Total production lead time | ~30 days | ~3 days |
| Casting quality (defect rate) | ~15% (typical) | ~2% (with simulation) |
Conclusion and Future Outlook
This first‑hand study demonstrated that the combination of sand casting 3D printing and numerical simulation provides a powerful methodology for developing complex castings like pump bodies. By eliminating pattern fabrication, sand casting 3D printing drastically shortens the development cycle. The simulation allows engineers to virtually optimize the gating system before any physical material is used, further reducing trial‑and‑error. My comparative analysis of gating systems showed that side gating yields the best solidification behavior, with defects confined to risers. The final casting met all quality requirements, proving the feasibility of this digital workflow.
Looking forward, I plan to extend this work to other alloys, such as aluminum and steel, and explore multi‑material sand casting 3D printing for graded properties. The ability to print complex sand cores with internal cooling channels can also be used to control solidification directionally. Furthermore, real‑time monitoring of the sand casting 3D printing process—through embedded sensors or machine vision—could provide closed‑loop control to further enhance mold quality. The synergy of sand casting 3D printing and computational simulation is poised to transform the foundry industry, making it more agile, sustainable, and cost‑effective.