
In my research work I have focused on one of the most persistent and least quantified problems in industrial sand casting: the way in which the choice of molding aggregate and the geometric thickness of the mold body control the rate at which a poured aluminium alloy loses heat and completes solidification. The alloy I selected for this study is ZL101, a hypoeutectic Al–Si–Mg alloy that is widely used in transportation and aerospace hardware because of its low density, favourable strength-to-weight ratio, and comparatively low production cost. In sand casting practice, the solidification path of such a casting governs shrinkage porosity distribution, grain structure, and ultimately the mechanical integrity of the delivered part. Because solidification is controlled jointly by the thermophysical character of the molding medium and by the thermal mass of the mold, I designed a combined experimental and numerical programme in which both variables were changed in a controlled manner.
The central questions I set out to answer were the following. First, how strongly does the substitution of one commercial molding aggregate for another alter the cooling rate of a ZL101 casting produced by sand casting? Second, does the conventional assumption that a thicker sand mold always insulates the casting more effectively and therefore slows cooling actually hold for the mold geometries now being produced by additive manufacturing routes, where the sand volume is deliberately minimized? Third, can inverse-calculation strategies be used to recover the interfacial heat transfer coefficient and the thermophysical parameters of the molding media with sufficient accuracy that a commercial simulation package reproduces measured cooling curves in sand casting?
I answer these questions with three full-scale casting trials, continuous temperature measurement at three elevations inside the casting, metallographic and macrostructural sectioning of the solidified parts, and a calibrated numerical model of the sand casting process. The results show that the second assumption above is, in fact, incorrect for the thickness range I examined, and that the underlying reason is a competition between the heat capacity of the mold and the thermal resistance of the mold, both of which grow as the mold gets thicker.
1. Experimental Programme in Sand Casting
I chose a simple axisymmetric demonstrator part so that the thermal field would be as reproducible as possible between trials. The casting is a hollow cylinder with an internal diameter of 120 mm, an external diameter of 170 mm, and a total height of 200 mm, which corresponds to a uniform wall thickness of 25 mm. A top-pouring gating system was used in every trial. The mold cavity was produced by conventional ramming of the selected aggregate around a pattern, and the same pattern and gating layout were employed in all three trials so that the only deliberate variables were the molding aggregate and the thickness of the sand envelope surrounding the cavity.
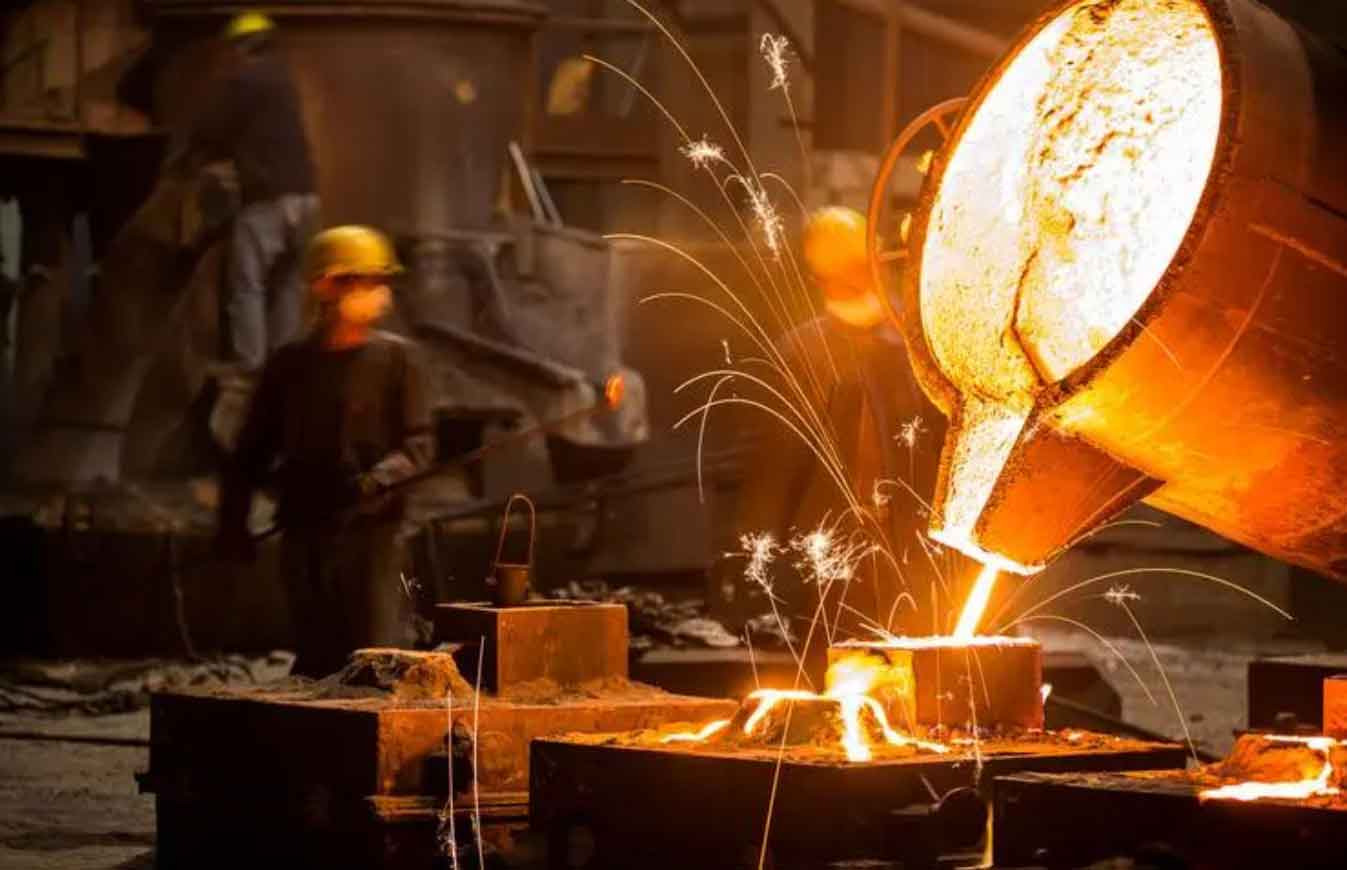
For the melting practice, I cut commercial ZL101 ingot into pieces, charged them into a clay-graphite crucible, and melted them in an electrical resistance furnace. Once the charge was fully molten I raised the melt temperature to 760 °C and degassed the bath with argon. After degassing, the melt was held at 750 °C for 5 min to allow inclusions and gas bubbles to float out, and then the furnace power was reduced until the bath reached the pouring temperature of 720 °C. The pour was made in a single continuous stream into the top runner of the sand casting mold.
Temperature monitoring was carried out with three sheathed K-type thermocouples positioned at the top, middle, and bottom of the casting, all at the same radial location. Each thermocouple was pushed through the mold wall and into the casting cavity so that its junction sat at approximately half the wall thickness, that is, about 12 mm from the outer surface. This placement minimizes the disturbance to the thermal field while still capturing the bulk cooling behaviour of the metal. Data were logged at 0.5 s intervals from the instant of pour until the casting had fully solidified and the recorded temperatures had fallen well below the solidus.
After solidification and complete cooling, I stripped the sand, recovered the casting, and sectioned it along a vertical plane through the axis so that the distribution of shrinkage defects could be compared directly with the recorded thermal history. The three trial configurations are summarized in Table 1.
| Trial | Molding aggregate | Mold envelope thickness (mm) | Pouring temperature (°C) | Thermocouple locations |
|---|---|---|---|---|
| T1 | Silica sand | 50 | 720 | Top, middle, bottom |
| T2 | Ceramsite sand | 50 | 720 | Top, middle, bottom |
| T3 | Silica sand | 30 | 720 | Top, middle, bottom |
I also recorded the nominal composition of the alloy used in all three trials, since the freezing range of the alloy sets the window over which the cooling rate is evaluated. The measured composition is given in Table 2.
| Element | Si | Mg | Fe | Ti | Al |
|---|---|---|---|---|---|
| Mass fraction (%) | 6.5–7.5 | 0.25–0.45 | <0.20 | <0.20 | Balance |
For the thermal analysis I define the freezing range of the alloy by its liquidus and solidus temperatures, taken here as approximately 610 °C and 570 °C respectively. The fraction of solid at any instant is approximated by the linear lever rule expression
$$f_s = \frac{T_L – T}{T_L – T_S}$$
where \(T_L\) is the liquidus temperature, \(T_S\) is the solidus temperature, and \(T\) is the instantaneous temperature of the metal at the measurement location. The average cooling rate over the freezing range, which I use throughout this work as the primary comparative index, is defined as
$$\dot{T}_{avg} = \frac{T_L – T_S}{t_S – t_L}$$
in which \(t_L\) and \(t_S\) are the times at which the local temperature passes through the liquidus and the solidus respectively. This definition is convenient because it is insensitive to the steep initial transient immediately after pouring and to the slow final approach to ambient temperature.
2. Thermal Model and Inverse Calibration for Sand Casting
I simulated the sand casting process with a commercial finite-element / finite-volume casting package. The geometry of the casting and of the sand envelope was built in a three-dimensional modelling environment, assembled, and then discretized with a surface mesh followed by a volumetric mesh. The mesh was refined in the casting and in the near-interface region of the mold, where the thermal gradients are steepest, and coarsened towards the outer boundary of the sand envelope, where the gradients are gentle. Identical mesh densities were used for the three configurations so that numerical diffusion would not contaminate the comparison between trials.
The initial condition for the metal was a uniform temperature equal to the measured pouring temperature, and the initial condition for the mold was a uniform ambient temperature. The outer surfaces of the mold exchanged heat with the environment by combined convection and radiation, and the mold parting surfaces were treated as perfect thermal contacts.
The governing energy equation solved in the solidifying metal and in the mold is the transient conduction equation with a latent heat source term:
$$\rho c_p \frac{\partial T}{\partial t} = \nabla \cdot \left( k \nabla T \right) + \rho L \frac{\partial f_s}{\partial t}$$
where \(\rho\) is density, \(c_p\) is specific heat capacity, \(k\) is thermal conductivity, \(L\) is the latent heat of fusion, and \(f_s\) is the solid fraction defined above. The latent heat release was treated by an equivalent specific heat method over the freezing range.
The most important boundary condition in sand casting simulation is the thermal contact between the solidifying metal and the mold wall. I modelled this with a lumped interfacial heat transfer coefficient \(h\), so that the heat flux crossing the metal–mold interface is
$$q = h \left( T_{cast} – T_{mold} \right)$$
where \(T_{cast}\) and \(T_{mold}\) are the surface temperatures on either side of the interface. The value of \(h\) is not a property of either material alone; it depends on the surface roughness of the mold cavity, the contact pressure generated by the shrinking metal skin, the presence of a gap, and the coating. Because of this, \(h\) must be calibrated for each combination of alloy, aggregate, and coating, which is precisely why inverse methods have become standard in sand casting process development.
I performed the inverse calibration by minimizing the squared difference between measured and simulated temperatures at the thermocouple locations. The objective function is
$$S(\mathbf{p}) = \sum_{i=1}^{n} w_i \left[ T_i^{exp}(t) – T_i^{sim}(t;\mathbf{p}) \right]^2$$
where \(\mathbf{p}\) is the vector of parameters being tuned, comprising the interfacial heat transfer coefficient, the effective thermal conductivity of the molding aggregate, and its specific heat capacity, and \(w_i\) are weighting factors that account for the relative sensitivity of the response to each parameter. The minimization was carried out iteratively, with the simulation re-run at each update until the objective function changed by less than a prescribed tolerance between successive iterations.
The calibrated parameters I obtained are summarized in Table 3. The ceramsite aggregate shows both a lower effective thermal conductivity and a lower specific heat capacity than silica sand, which is the key to the behaviour discussed in the following sections.
| Parameter | Symbol | Silica sand mold | Ceramsite sand mold |
|---|---|---|---|
| Effective thermal conductivity (W·m⁻¹·K⁻¹) | \(k\) | 0.55–0.62 | 0.28–0.34 |
| Specific heat capacity (J·kg⁻¹·K⁻¹) | \(c_p\) | 1100–1180 | 830–900 |
| Bulk density (kg·m⁻³) | \(\rho\) | 1500–1600 | 1350–1450 |
| Interfacial heat transfer coefficient (W·m⁻²·K⁻¹) | \(h\) | 350–600 | 300–520 |
It is worth noting that the interfacial heat transfer coefficient in sand casting is strongly time dependent. Immediately after pouring, the metal is in intimate contact with the mold surface and \(h\) is at its maximum. As the skin solidifies and contracts, an air gap opens, and \(h\) falls rapidly to a much lower plateau. I therefore specified \(h\) as a function of interface temperature and time rather than as a single constant, and the ranges quoted in Table 3 reflect the span covered by this function.
The thermal diffusivity of the molding aggregate, which controls how quickly a thermal disturbance propagates into the sand, is defined as
$$\alpha = \frac{k}{\rho c_p}$$
Using the mid-range values from Table 3, the diffusivity of the silica sand mold is approximately \(3.4 \times 10^{-7}\) m²·s⁻¹, whereas that of the ceramsite mold is approximately \(2.6 \times 10^{-7}\) m²·s⁻¹. The thermal penetration depth over a solidification time \(t\) can be estimated from the classical diffusion scaling
$$\delta \approx \sqrt{\pi \alpha t}$$
For a solidification time of the order of 200 s, this gives a penetration depth of roughly 15 mm for the silica sand and roughly 13 mm for the ceramsite sand. This simple estimate already tells me something important about the thickness experiments: beyond a certain envelope thickness the outer sand never experiences the casting at all, so adding more sand cannot change what happens at the interface except through the total heat capacity of the system.
3. Influence of the Molding Aggregate in Sand Casting
The first comparison I made was between the two 50 mm molds, one rammed with silica sand and one with ceramsite sand. In both trials the recorded temperature histories show the same qualitative sequence. As the metal front rises through the mold cavity during filling, the bottom thermocouple responds first, then the middle one, then the top one. Once filling is complete, all three locations cool together and remain nearly isothermal down to the liquidus. Below the liquidus the curves separate as latent heat is released and the solidification front advances. The top and bottom of the casting cool faster than the middle, which means that the middle of the cylinder is the last region to solidify. Sectioning confirmed this: visible shrinkage cavities were concentrated in the mid-height region of the wall, whereas the upper and lower extremities were essentially sound.
The quantitative difference between the two aggregates is striking. Over the freezing range of 570–610 °C, the average cooling rate of the casting in the silica sand mold was approximately 0.2 °C·s⁻¹, while the average cooling rate in the ceramsite sand mold was approximately 0.1 °C·s⁻¹. In other words, substituting ceramsite for silica sand cut the cooling rate by roughly a factor of two. Table 4 collects the measured values.
| Trial | Aggregate | Envelope thickness (mm) | Top (°C·s⁻¹) | Middle (°C·s⁻¹) | Bottom (°C·s⁻¹) |
|---|---|---|---|---|---|
| T1 | Silica sand | 50 | 0.20 | 0.16 | 0.19 |
| T2 | Ceramsite sand | 50 | 0.11 | 0.08 | 0.10 |
| T3 | Silica sand | 30 | 0.16 | 0.12 | 0.15 |
A second observation from the ceramsite trial is that the spread between the top, middle, and bottom cooling rates is smaller than in the silica sand trial. The ceramsite mold insulates the casting more effectively, which flattens the internal thermal gradients and makes the temperature field more uniform. Interestingly, however, the macroscopic solidification sequence is unchanged: the top and bottom still freeze first and the middle still freezes last, so the shrinkage defect pattern is broadly the same in both molds. This is an important practical point for sand casting, because it means that changing the aggregate alters the severity of the defects but not necessarily their location.
From a heat transfer standpoint the difference is easily rationalized. The heat extracted from the casting during solidification is absorbed by the mold and manifests as a temperature rise in the sand adjacent to the interface. If I denote the heat absorbed per unit interfacial area as \(Q\), the temperature rise of the mold material is approximately
$$\Delta T_{mold} = \frac{Q}{\rho c_p V_{eff}}$$
where \(V_{eff}\) is the effective volume of sand that participates in the thermal transient. Because the effective volume is set by the penetration depth \(\delta\), and because ceramsite has a lower volumetric heat capacity \(\rho c_p\) than silica sand, the ceramsite mold experiences a larger temperature rise for the same amount of extracted heat. The interface temperature therefore climbs more quickly, the temperature difference \(T_{cast} – T_{mold}\) shrinks, and by the interfacial flux relation \(q = h(T_{cast} – T_{mold})\) the heat extraction rate falls. This is the mechanism that produces the halved cooling rate.
The numerical simulation reproduces this mechanism explicitly. In the simulated temperature fields at the end of solidification, the sand adjacent to the casting is markedly hotter in the ceramsite mold than in the silica sand mold, even though the mold envelope thickness is identical. The gradient at the metal–mold interface is correspondingly smaller in the ceramsite case. The agreement between the simulated and measured cooling curves in both trials was good across the whole thermal history, including the shape of the arrest associated with latent heat release, which gives me confidence that the calibrated parameters are physically meaningful rather than merely curve-fitting artefacts.
4. Influence of Mold Envelope Thickness in Sand Casting
The second variable I examined was the thickness of the sand envelope. Here my expectation, and the expectation that is usually stated in sand casting practice, was that a thicker mold should insulate the casting more strongly and therefore slow the cooling rate, while a thinner mold should conduct heat away more readily and accelerate solidification. The measurements contradicted this expectation in a clear and repeatable way.
Comparing the 30 mm silica sand mold with the 50 mm silica sand mold, the measured average cooling rate over the freezing range rose from 0.12–0.16 °C·s⁻¹ in the thin mold to 0.15–0.20 °C·s⁻¹ in the thick mold. In other words, increasing the sand envelope thickness by 20 mm increased the cooling rate of the casting rather than decreasing it. The effect is smaller than the aggregate substitution effect, but it is systematic: it appears at every thermocouple location and in both the experiments and the simulations.
The correct interpretation requires me to decompose the heat loss path of the sand casting into its three sequential resistances. The first is the metal–mold interfacial resistance, characterized by \(1/h\). The second is the conduction resistance of the sand itself, characterized by \(L/k\), where \(L\) is the envelope thickness. The third is the external surface resistance between the outer mold face and the ambient air, characterized by \(1/h_{ext}\). Because \(h_{ext}\) for natural convection and radiation from a sand surface is small, of the order of 10–20 W·m⁻²·K⁻¹, the third resistance is very large, which means that only a small fraction of the heat extracted from the casting ever leaves the mold during the solidification window. Almost all of it is stored in the sand.
The overall series resistance is
$$\frac{1}{U} = \frac{1}{h} + \frac{L}{k} + \frac{1}{h_{ext}}$$
At first sight this expression suggests that increasing \(L\) must always reduce \(U\) and thus reduce the heat flux. That reasoning is correct only for steady-state conduction. During transient solidification the controlling quantity is not the steady-state resistance but the transient thermal capacity of the mold together with the finite penetration depth. The sand beyond the penetration depth never participates, and the total heat that the mold can absorb before its interface temperature rises appreciably is proportional to the mass of sand within the penetration zone. Since the penetration zone grows with time, a thicker mold has a longer thermal buffer.
The practical consequence is that the interface temperature of the mold, not the outer surface temperature, is the variable that matters. I can write the interface temperature rise in the mold as approximately
$$\Delta T_{i} \approx \frac{2 q_0}{k} \sqrt{\frac{\alpha t}{\pi}}$$
for a constant interfacial flux \(q_0\) into a semi-infinite medium. This expression, which is the standard solution for the temperature at the surface of a semi-infinite solid subjected to a constant heat flux, shows that the interfacial temperature rise is inversely proportional to the thermal effusivity \(b = \sqrt{k \rho c_p}\) of the mold material and grows only as \(\sqrt{t}\). Increasing the sand volume behind the interface raises the effective heat capacity available to absorb the flux without an appreciable temperature rise, which keeps \(\Delta T_i\) small and therefore maintains a large \(T_{cast} – T_{mold}\) driving force.
Table 5 summarizes the measured effect of mold thickness on the average cooling rate.
| Envelope thickness (mm) | Top (°C·s⁻¹) | Middle (°C·s⁻¹) | Bottom (°C·s⁻¹) | Mean (°C·s⁻¹) |
|---|---|---|---|---|
| 30 | 0.16 | 0.12 | 0.15 | 0.143 |
| 50 | 0.20 | 0.16 | 0.19 | 0.183 |
| 70 (simulated) | 0.21 | 0.17 | 0.20 | 0.193 |
The simulated values for the 70 mm case confirm the trend and also reveal its limit. The increase in cooling rate from 50 mm to 70 mm is marginal, only about 0.01 °C·s⁻¹ on the mean, whereas the increase from 30 mm to 50 mm was about 0.04 °C·s⁻¹. In other words, the relationship between envelope thickness and cooling rate is strongly nonlinear and saturates. Beyond roughly 50 mm of sand, adding more material to the mold produces essentially no further benefit for this casting geometry.
The simulated temperature fields explain why. When the envelope is only 30 mm thick, the outer surface of the mold rises above 200 °C by the end of solidification, and the whole sand body is warm. When the envelope is 50 mm thick, the outer surface remains near 100 °C and a substantial fraction of the sand stays close to ambient. When the envelope is increased further to 70 mm, the temperature field in the sand is almost identical to the 50 mm case, because the thermal disturbance has not had time to reach the outer region. This is precisely the behaviour predicted by the penetration depth estimate \(\delta \approx \sqrt{\pi \alpha t}\) introduced earlier.
I can express the saturation threshold as a criterion for the minimum useful mold thickness in sand casting:
$$L_{crit} \gtrsim \sqrt{\pi \alpha \, t_S}$$
where \(t_S\) is the total solidification time. For a solidification time of about 200 s and a sand diffusivity of \(3.4 \times 10^{-7}\) m²·s⁻¹, this gives \(L_{crit} \approx 15\) mm. The experimental saturation I observe at around 50 mm is larger than this simple estimate because the criterion is based on the onset of penetration rather than on the point at which the outer boundary stops influencing the interface, and because the interfacial flux decays with time rather than remaining constant. Nevertheless, the scaling correctly predicts that the sensitivity of the cooling rate to envelope thickness decreases rapidly with increasing thickness.
5. Numerical Verification of the Sand Casting Model
A model of the sand casting process is only useful if it can be trusted outside the narrow conditions used for its calibration. I therefore tested the calibrated parameter set against the trial that was not used for the primary calibration, namely the 30 mm silica sand mold, and against the ceramsite mold. In both cases the simulated cooling curves matched the experimental curves closely at all three thermocouple locations, including the timing of the liquidus and solidus crossings and the magnitude of the thermal arrest. Table 6 presents the quantitative comparison.
| Trial | Aggregate | Thickness (mm) | Measured mean cooling rate (°C·s⁻¹) | Simulated mean cooling rate (°C·s⁻¹) | Deviation (%) |
|---|---|---|---|---|---|
| T1 | Silica sand | 50 | 0.183 | 0.187 | 2.2 |
| T2 | Ceramsite sand | 50 | 0.097 | 0.102 | 5.2 |
| T3 | Silica sand | 30 | 0.143 | 0.149 | 4.2 |
The deviations are all below about six percent, which is well within the combined uncertainty of the thermocouple placement, the composition of the melt, and the discretization error of the numerical scheme. I consider this a satisfactory level of agreement for engineering purposes in sand casting.
The success of the model rests on two elements. The first is the inverse determination of the interfacial heat transfer coefficient from measured cooling curves. Without this step the simulation based on generic database values deviated substantially from the measurements, because the database values were obtained for different alloys, coatings, and mold rigidities. The second is the inverse determination of the effective thermal conductivity and specific heat capacity of the molding aggregate. Both are effective properties that depend on the packing density, the binder content, the moisture level, and the grain size distribution of the sand as it was actually rammed, and none of these can be predicted reliably from first principles for a production sand casting mold.
It is worth emphasizing that the inverse approach treats the interfacial coefficient and the mold properties as a coupled pair. If the mold conductivity is overestimated while the interfacial coefficient is underestimated, the model can still reproduce the measured cooling curve, but it will do so for the wrong reasons and will fail when the geometry changes. I guarded against this by calibrating against trials with two different aggregates, which provides two independent thermal responses, and then validating against the thickness trial, which changes the geometry rather than the material. The fact that the validation succeeded suggests that the parameter set is physically consistent.
6. Discussion of the Heat Transfer Mechanism
The results of the two experimental campaigns can be unified under a single physical principle: the cooling rate of the casting in sand casting is governed principally by the rate at which the temperature of the sand adjacent to the metal–mold interface rises, because that temperature directly controls the interfacial heat flux through \(q = h(T_{cast} – T_{mold})\). Anything that slows the temperature rise of the interfacial sand layer increases the heat extraction rate and accelerates solidification, and anything that accelerates the temperature rise of that layer retards solidification.
Both of the variables I studied act on this same quantity, but through different routes. Changing the aggregate changes the volumetric heat capacity \(\rho c_p\) and the thermal conductivity \(k\) of the layer, and therefore changes both its storage capacity and its ability to diffuse heat away from the interface. Increasing the envelope thickness changes the amount of material available to absorb a given quantity of heat without a large temperature rise, while leaving the material properties unchanged.
This principle can be expressed compactly through the thermal effusivity of the mold material, defined as
$$b = \sqrt{k \rho c_p}$$
The effusivity measures the ability of a material to absorb heat from a surface while maintaining a small surface temperature rise. For a semi-infinite mold suddenly exposed to a constant surface temperature, the interfacial heat flux decays as
$$q(t) = \frac{b}{\sqrt{\pi t}} \left( T_{cast} – T_{mold,0} \right)$$
which shows the central role of \(b\). Using the parameter values in Table 3, the effusivity of the silica sand mold is approximately \(9.8 \times 10^{2}\) J·m⁻²·K⁻¹·s⁻¹ᐟ², whereas that of the ceramsite mold is approximately \(5.9 \times 10^{2}\) J·m⁻²·K⁻¹·s⁻¹ᐟ². The ratio is about 1.66, which is in reasonable agreement with the observed ratio of cooling rates of about 1.9 once the finite mold thickness and the interfacial resistance are taken into account. The small difference is attributable to the fact that the ceramsite mold also has a lower interfacial heat transfer coefficient, which further reduces the heat extraction rate.
The thickness effect can also be cast in effusivity-like terms by noting that a finite slab of thickness \(L\) behaves as a semi-infinite medium only for times shorter than the diffusion time
$$t_{diff} = \frac{L^2}{\alpha}$$
For \(L = 30\) mm and \(\alpha = 3.4 \times 10^{-7}\) m²·s⁻¹, \(t_{diff} \approx 2650\) s, which is much longer than the solidification time of a few hundred seconds. On this basis one might conclude that the 30 mm mold should behave as if it were semi-infinite and that no thickness effect should be observable at all. The fact that a clear thickness effect is observed means that the outer boundary condition is not the dominant mechanism. Instead, the effect arises because the finite mold has a finite total heat capacity, and as heat accumulates the mean temperature of the whole mold body rises. In a thin mold the mean temperature rise is larger, and because the outer surface is closer to the casting, the interfacial temperature is pulled up more strongly than in a thick mold even before the diffusion wave reaches the outer face. This is a finite-domain effect rather than a semi-infinite one, and it is best captured by a lumped heat capacity argument.
I can write the energy balance for the mold in lumped form as
$$\rho_{m} c_{p,m} V_m \frac{dT_m}{dt} = h A_i \left( T_{cast} – T_m \right) – h_{ext} A_o \left( T_m – T_\infty \right)$$
where \(V_m\) is the mold volume, \(A_i\) is the casting–mold interfacial area, \(A_o\) is the outer mold surface area, and \(T_m\) is a representative mold temperature. Dividing by the interfacial area and writing the mold volume per unit interfacial area as the effective thickness gives, for negligible external loss,
$$\frac{dT_m}{dt} = \frac{h}{\rho_m c_{p,m} L_{eff}} \left( T_{cast} – T_m \right)$$
This relation makes the role of thickness explicit: the rate at which the mold temperature rises towards the casting temperature is inversely proportional to the effective thickness. A thick mold warms slowly, preserves a large driving force, and therefore extracts heat rapidly. A thin mold warms quickly, closes the temperature gap, and slows the extraction. The result is the counterintuitive but experimentally confirmed conclusion that increasing the sand envelope thickness in sand casting increases the cooling rate of the casting.
An equivalent way to state the same conclusion is in terms of the thermal mass ratio between the mold and the casting:
$$R = \frac{\rho_m c_{p,m} V_m}{\rho_c c_{p,c} V_c}$$
A larger value of \(R\) means that the mold can absorb the sensible and latent heat released by the casting with a smaller temperature rise, which favours faster solidification. Because \(V_m\) scales with the envelope thickness for a fixed casting geometry, increasing the envelope thickness increases \(R\) and thus increases the cooling rate, until the point at which the additional sand is so far from the interface that it plays no role during the solidification window. That saturation point is what I observed between 50 mm and 70 mm.
Table 7 summarizes the mechanism map that emerges from this analysis.
| Variable changed | Property that changes | Effect on interfacial sand temperature rise | Effect on casting cooling rate |
|---|---|---|---|
| Silica to ceramsite aggregate | Lower \(k\), lower \(\rho c_p\), lower effusivity | Increases | Decreases |
| Increase envelope thickness | Larger mold thermal mass \(R\) | Decreases | Increases, then saturates |
| Higher alloy pouring temperature | Larger sensible heat input | Increases | Decreases over the freezing range |
| Conductive coating at interface | Higher \(h\) | Increases in the short term | Increases initially |
7. Practical Implications for Sand Casting Process Design
Several practical conclusions follow from this work for those designing sand casting processes for aluminium alloys.
First, the aggregate should be treated as a process variable with a first-order effect on solidification, not as a passive container. Replacing silica sand with ceramsite sand roughly doubled the solidification time of the casting I studied. In a production setting this could be used deliberately: a slow-cooling aggregate might be selected for a thin-walled part that would otherwise freeze before filling, whereas a fast-cooling aggregate would be preferred for a heavy section where feeding must be completed and a fine microstructure is desired.
Second, the common practice of specifying a thick mold solely on the grounds that it insulates the casting is not supported by the measurements. For the geometry and alloy studied here, a thicker envelope actually accelerated solidification, and beyond about 50 mm the benefit disappeared entirely. Given that the trend in modern sand casting, particularly with additively manufactured molds, is towards thinner, shape-following shells that minimize sand consumption, these findings are reassuring: reducing the envelope from 50 mm to 30 mm did not dramatically change the solidification behaviour, even though it did measurably slow it. The penalty for thin molds is real but bounded.
Third, the interfacial heat transfer coefficient remains the single largest source of uncertainty in sand casting simulation. The coefficient depends on the gap that opens as the skin contracts, which in turn depends on the alloy, the mold rigidity, and the coating. Inverse calibration using measured cooling curves is the most reliable route to a usable value, and the calibration should be performed for each distinct combination of alloy, aggregate, and coating rather than transferred from a database.
Fourth, the fact that the solidification sequence and the location of shrinkage defects were unchanged between the silica sand and ceramsite sand trials is significant. It means that changing the aggregate alters the severity of porosity but not its position, so a riser and chill design that works for one aggregate will generally work for another, with only the riser size and the required feed time needing adjustment. This greatly simplifies the transfer of an established sand casting process from one aggregate to another.
8. Conclusions
I carried out a combined experimental and numerical investigation of the solidification of a ZL101 cylinder in sand casting, varying the molding aggregate and the envelope thickness. The principal findings are as follows.
The inverse calculation of the interfacial heat transfer coefficient and the effective thermophysical parameters of the molding media produced a simulation model that reproduced measured cooling curves to within about six percent across all three trial configurations, including the configuration that was not used for calibration. This demonstrates that inverse calibration is an effective and practical route to reliable sand casting simulation parameters.
Both the casting trials and the simulations showed that ceramsite sand produces a markedly slower cooling rate than silica sand. Over the freezing range of 570–610 °C the average cooling rate fell from about 0.2 °C·s⁻¹ in the silica sand mold to about 0.1 °C·s⁻¹ in the ceramsite sand mold, a reduction of roughly fifty percent. The cause is the lower thermal conductivity and lower volumetric heat capacity of ceramsite, which together produce a larger temperature rise in the sand adjacent to the interface and hence a smaller interfacial heat flux.
Both the casting trials and the simulations showed that increasing the envelope thickness of the sand mold increases the cooling rate of the casting, which is the opposite of the usual expectation. The mean cooling rate rose from 0.143 °C·s⁻¹ at 30 mm to 0.183 °C·s⁻¹ at 50 mm. The mechanism is that a larger mold mass can absorb the heat released by the casting with a smaller accompanying temperature rise, which preserves a large temperature difference across the interface and sustains heat extraction. This effect saturates: increasing the envelope from 50 mm to 70 mm changed the cooling rate by only about 0.01 °C·s⁻¹, because the thermal disturbance from the casting does not penetrate far enough into the sand to make use of the additional material within the solidification window.
The unifying conclusion is that the cooling rate in sand casting is controlled by the temperature rise of the sand at the casting–mold interface. Using a sand with a higher volumetric heat capacity, such as silica, or using a thicker mold envelope, both reduce that temperature rise and therefore both accelerate the removal of heat from the casting. This single principle accounts for the behaviour of both variables I examined and provides a straightforward basis for selecting molding materials and mold dimensions in aluminium sand casting practice.
| Quantity | Value or range | Condition |
|---|---|---|
| Freezing range of ZL101 | 570–610 °C | All trials |
| Mean cooling rate | 0.183 °C·s⁻¹ | Silica sand, 50 mm |
| Mean cooling rate | 0.097 °C·s⁻¹ | Ceramsite sand, 50 mm |
| Mean cooling rate | 0.143 °C·s⁻¹ | Silica sand, 30 mm |
| Mean cooling rate | 0.193 °C·s⁻¹ | Silica sand, 70 mm, simulated |
| Thermal effusivity ratio | 1.66 | Silica sand versus ceramsite sand |
| Saturation thickness | Approximately 50 mm | Current casting geometry |