Construct a second-order aluminum alloy sleeve response surface model and verify the model. The results are shown in Table 5. The R ^ 2 is 0.9772, and the R ^ 2adj is 0.9505, indicating that the predicted model has a good consistency with the actual value. The coefficient of variation is 0.53%, indicating a low deviation between the predicted value and the experimental value, and a good reliability of the model.
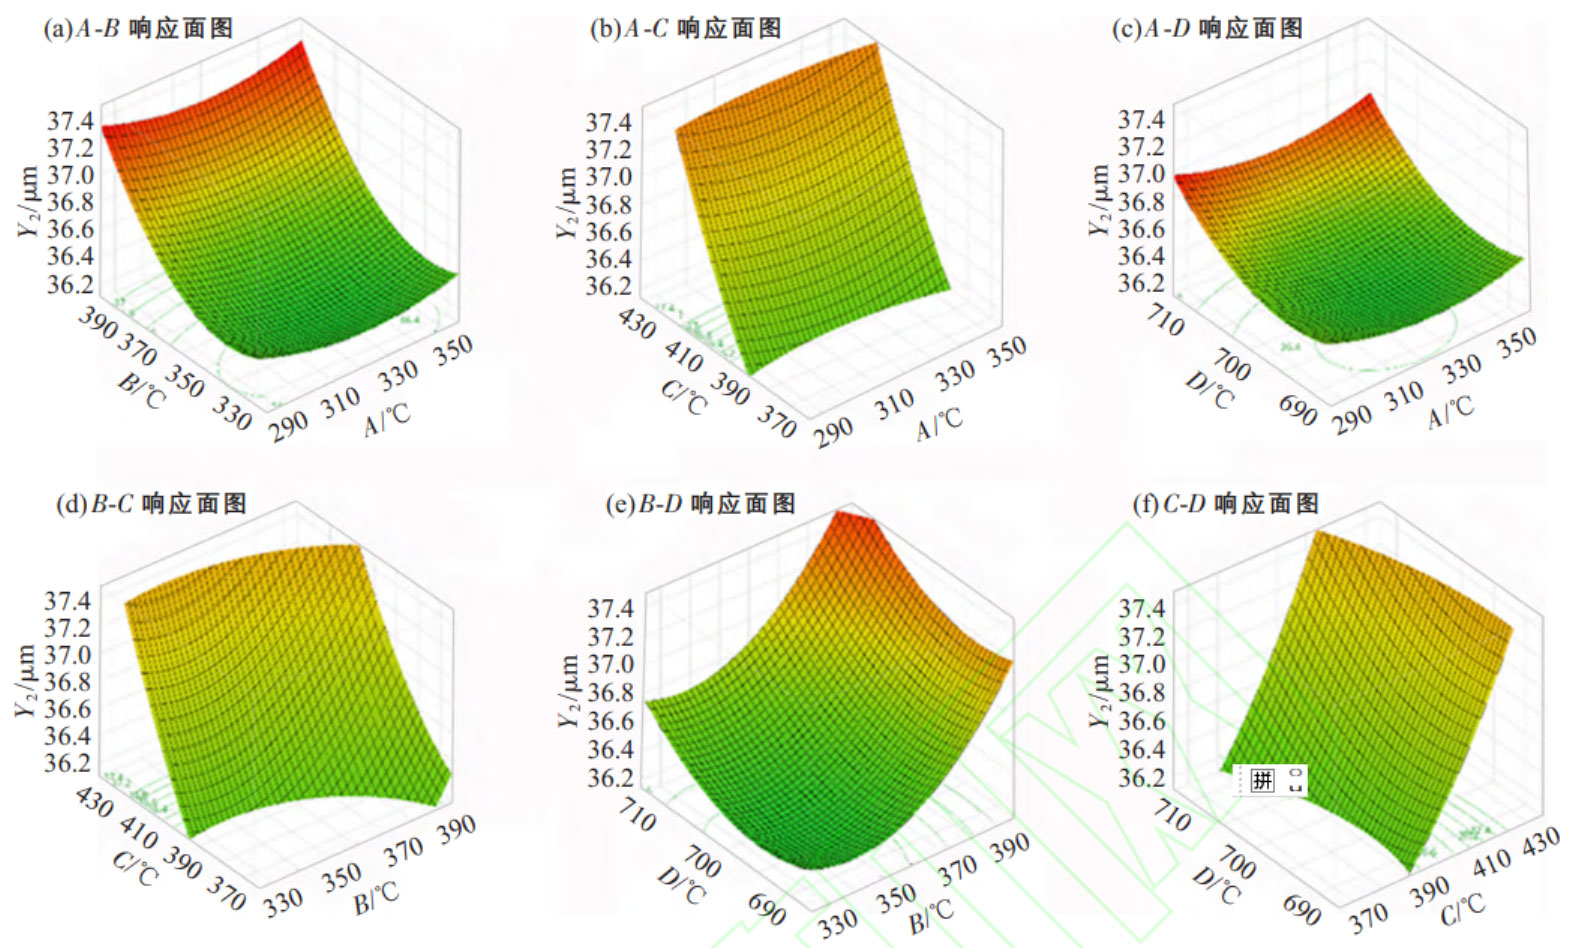
For SDAS, the preheating temperature of the side mold and the lower mold are highly significant factors, the pouring temperature is a significant factor, and the preheating temperature of the upper mold is not significant. The order of influence from large to small is: lower mold preheating temperature C>side mold preheating temperature B>pouring temperature D>upper mold preheating temperature A.

The figure shows the impact of the dual factor interaction on the response indicator Y2 (SDAS). The size of SDAS decreases with the decrease of preheating temperature of the side mold and the lower mold, slightly decreases with the decrease of pouring temperature, and remains basically unchanged with the change of preheating temperature of the upper mold. Among them, the preheating temperature of the lower mold has the most significant impact. The maximum value of SDAS mainly occurs at the bottom of the sleeve and is the final solidification position, which is in contact with the lower mold. As the mold temperature increases, it is equivalent to a longer holding time, which will slowly lower the alloy temperature to the liquid phase temperature, which is beneficial for the growth of dendrites and increases the value of SDAS. The final response regression prediction model is as follows:

