1. Test scheme design
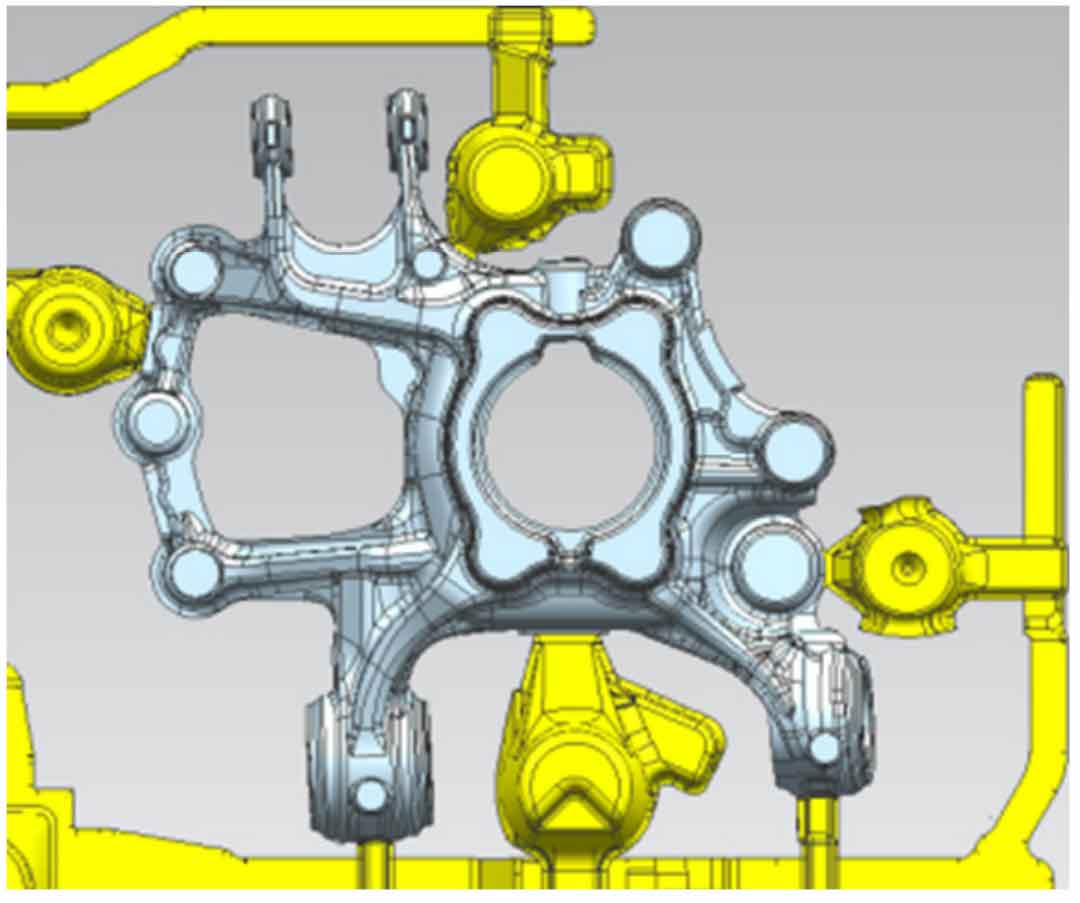
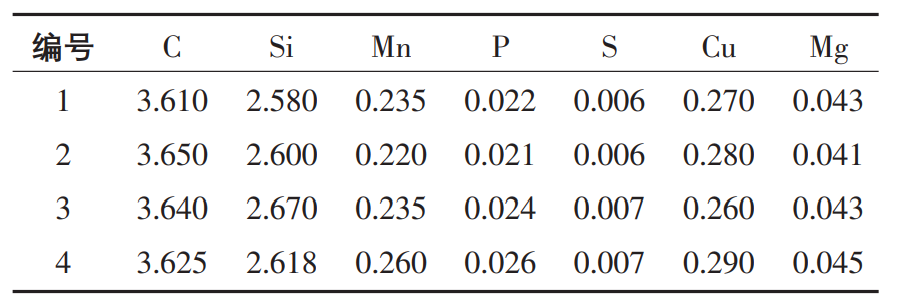
Select specific nodular cast iron and specific process as the test object (as shown in Figure 1), and the chemical composition is shown in Table 1. Under the condition of fixed nodular cast iron process, due to the complex shape of nodular cast iron, the cooling conditions at different positions will be different. Therefore, it is assumed that the hardness values at different positions of the same nodular cast iron will be different due to the influence of cooling rate, So as to design the test scheme.
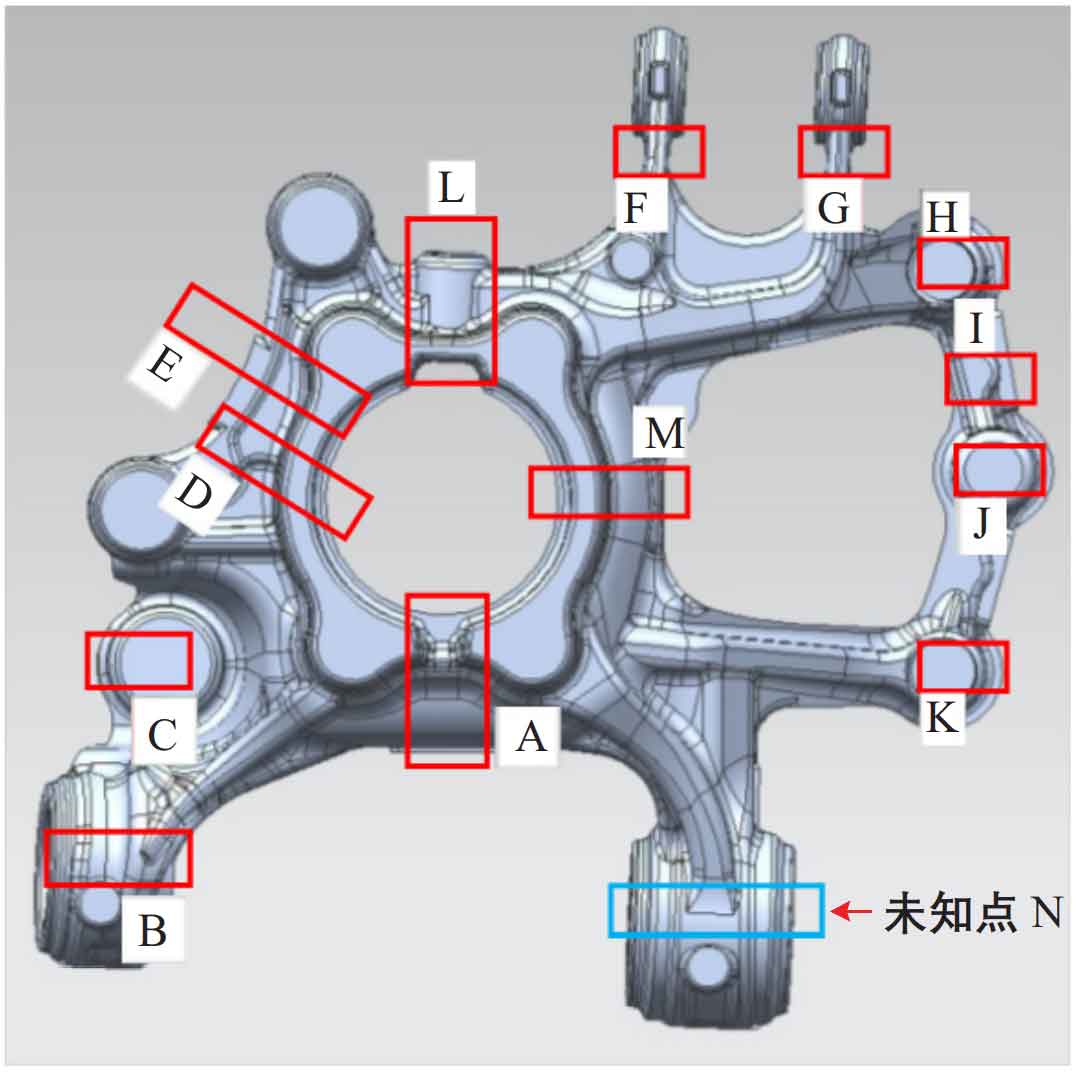
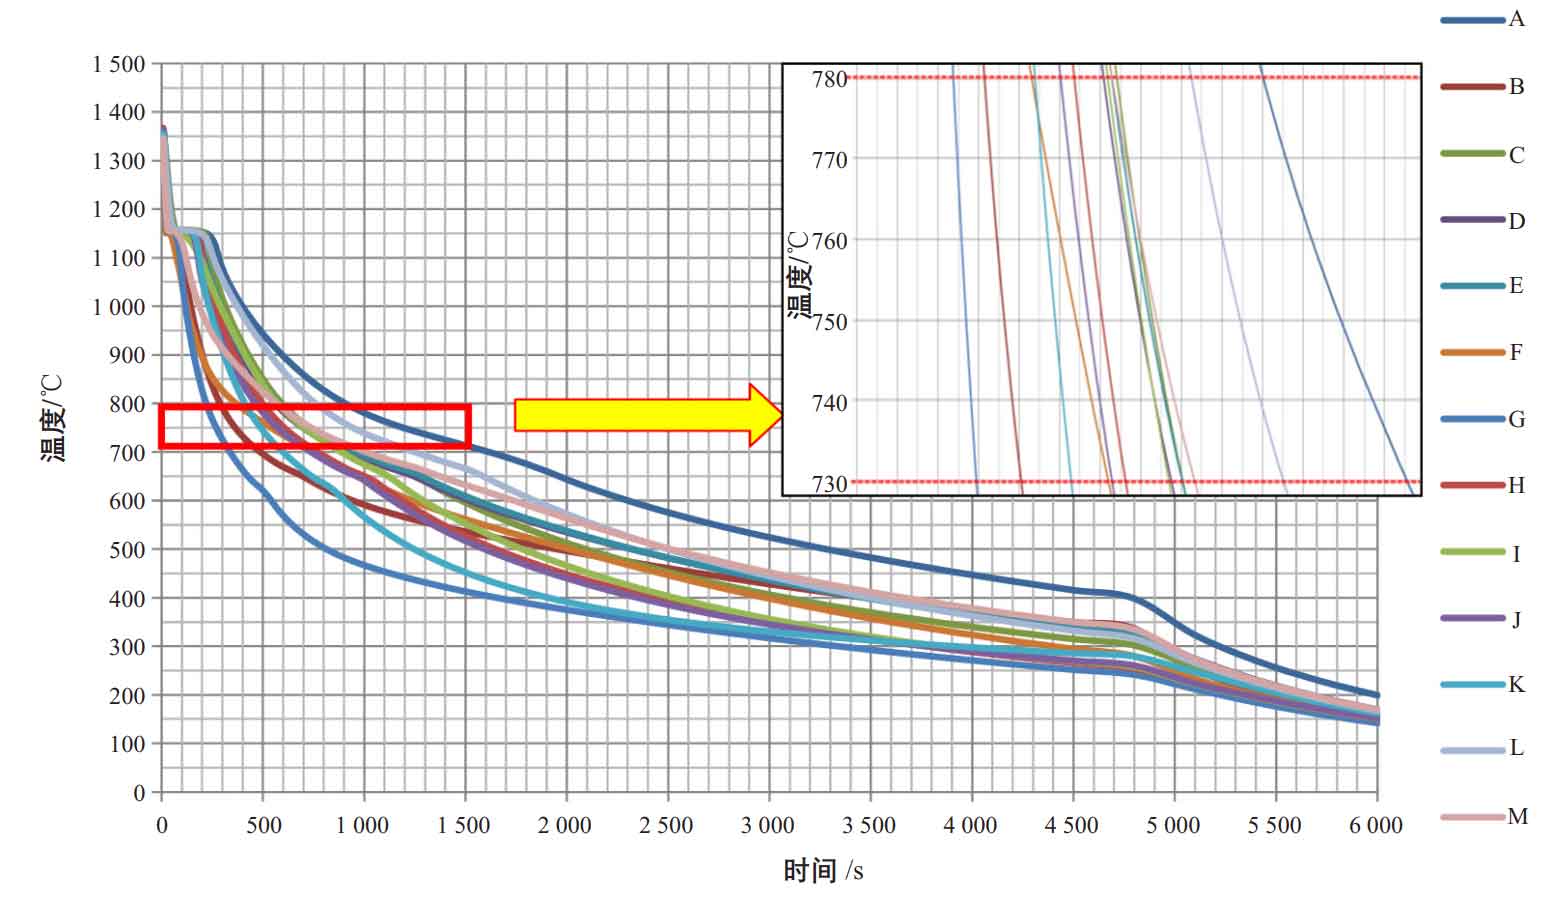
The first stage: select a ~ m points as the observation points for experimental verification. Firstly, use magma software to collect the cooling curve data of all nodular cast iron under specific process conditions, and analyze the cooling rate in the range of 730 ~ 780 ℃ (eutectoid transformation temperature). Secondly, detect the relationship between the hardness data of all observation points and the hardness of the real object, and find out the relevant laws. Then, the unknown point n is selected as the prediction object, and the accuracy of prediction is confirmed by measuring the hardness value of point n.
The second stage: adjust the production process to change the cooling rate of point n, confirm the cooling rate through magma software, predict the hardness value of point n under different processes, and verify the hardness accuracy through actual samples.
2. Simulation results
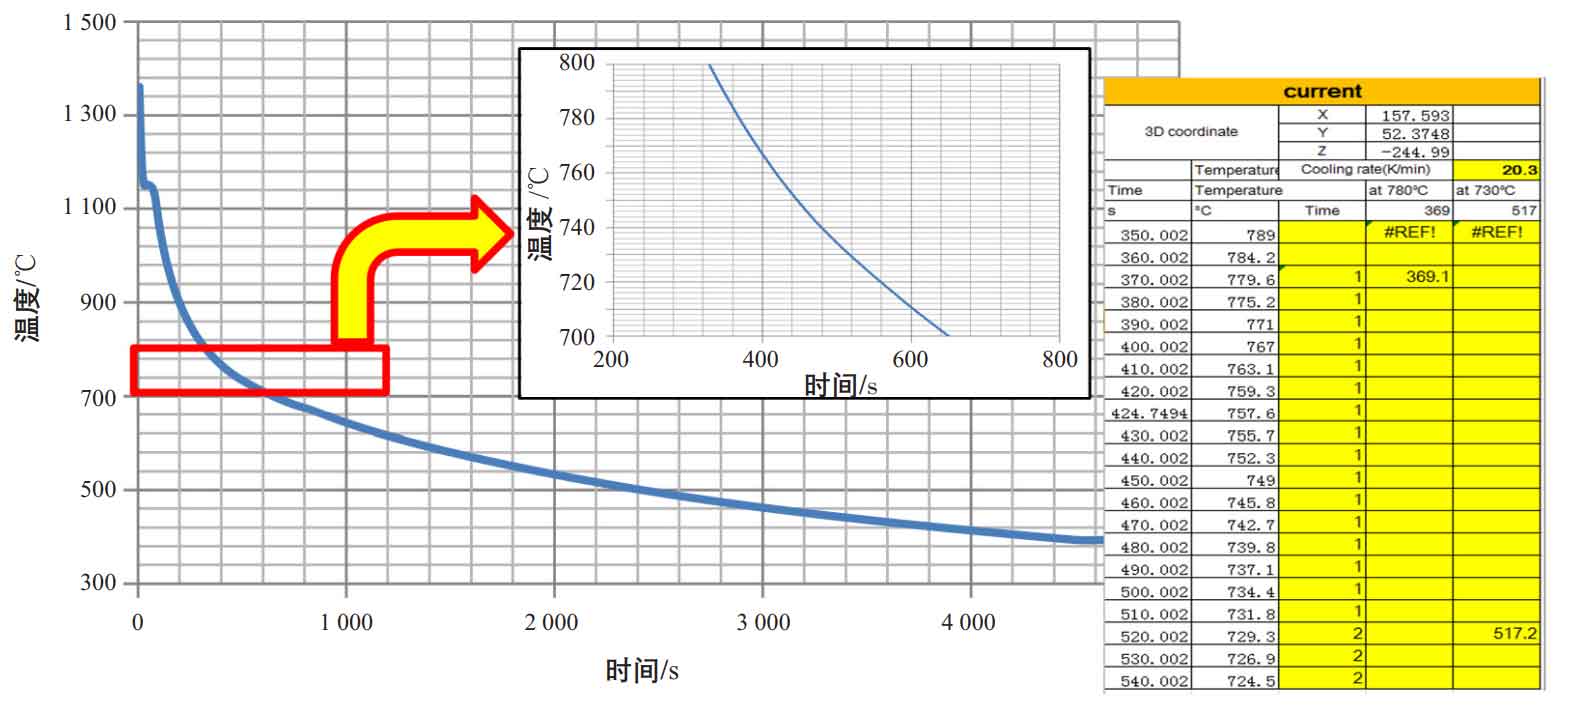
(1) The cooling curve data (as shown in Figure 2) is analyzed by magma software to ensure that the data accuracy is within the range of 0 ~ 3000 s. The temperature value is output every 10 s, and the cooling rate vcooling of 13 points a ~ m between 730 ~ 780 ℃ is calculated= Δ T/ Δ t(℃/min)。
(2) Collect the hardness value of the simulation analysis of the corresponding points and the measured hardness value of nodular cast iron. In order to reduce the measurement error, record the thickness of the sampled hardness block at the same time, and summarize the relevant data, as shown in Table 2.
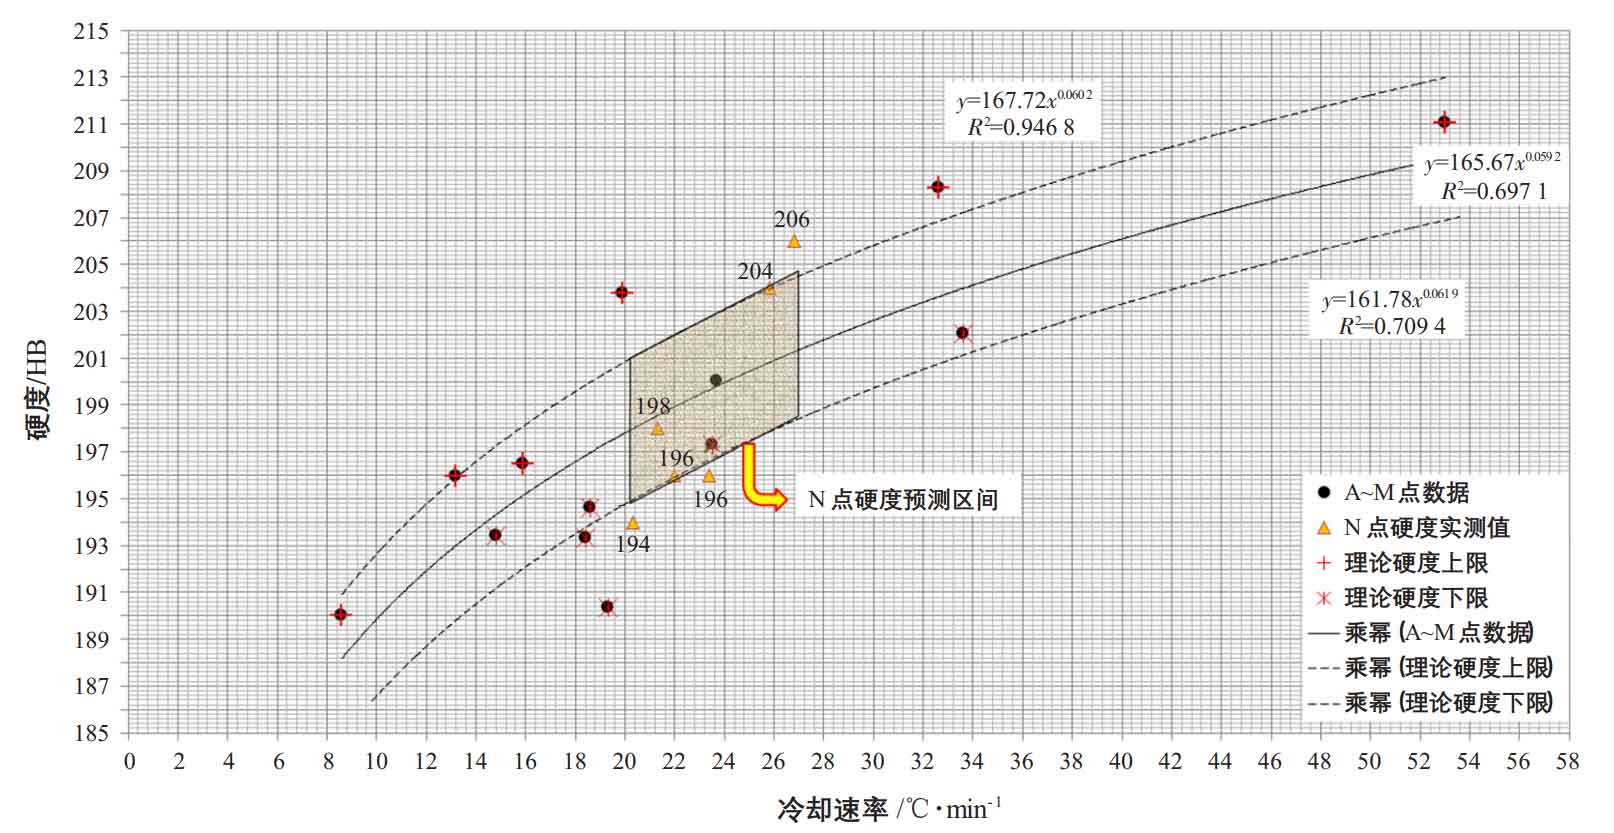
(3) Comparing the hardness and cooling rate at different positions, the relationship curve between cooling rate and hardness is obtained. There is a strong correlation between them (R2 = 0.69), and the correlation function is y = 165.67×0 059 2。 Fit the point above the fitting curve again as the hardness upper limit curve, y = 167.72×0 060 2 curve. After re fitting the points below the fitting curve, the lower limit curve of hardness is obtained, y = 161.78×0 061 9, the area between them is the hardness range corresponding to different cooling rates predicted by theory. Figure 3 shows the hardness cooling rate regression curve.
3. N-point hardness prediction
Figure 4 shows the original process cooling curve of point n, from which the eutectoid cooling rate VN = 20.3 ℃ / min, the predicted hardness range is 195 ~ 201 Hb, corresponding to the measured hardness value of 194 Hb.
4. N-point hardness prediction of different process schemes
By adjusting the process scheme of nodular cast iron and carrying out simulation analysis, the cooling rate of N-point eutectoid transformation under different conditions of nodular cast iron is obtained. The original scheme and five comparison schemes are simulated, as shown in Table 3. The modified process scheme basically adopts the same chemical composition as the original scheme to eliminate the influence of alloy composition on materials (as shown in Table 4). Scheme 1 cancels the iron feeding at point n to reduce the initial solidification temperature at point n; Scheme 2 and scheme 3 refine the runner Y1 and bypass the N-point, in order to reduce the influence of the runner on the temperature field near the N-point and reduce the thermal insulation effect; In scheme 4, the cold rib is added to speed up the cooling speed of point n; Scheme 5 is a combination of scheme 2 and scheme 4 to further accelerate the cooling rate of point n. Through the actual measurement, the deviation between the hardness value and the prediction range is small. At the same time, it also verifies the feasibility of calculating the cooling rate by magma simulation software to guide and improve the hardness and mechanical properties of nodular cast iron.

