
In the realm of metal casting, the quality assurance of grey iron castings has become increasingly stringent. Buyers now often mandate rigorous testing, shifting from batch sampling to individual casting inspection. A critical aspect of this evaluation is the use of attached test blocks, which are designed to mirror the cooling conditions and, consequently, the properties of the casting itself. However, a factor frequently overlooked by both manufacturers and purchasers is the specific location from which these test blocks are taken. Through my extensive work in foundry process optimization, I have observed that the mechanical properties indicated by an attached test block are not intrinsic to the material alone but are profoundly influenced by its position on the casting. This article delves into a detailed investigation of how positional variations, primarily driven by differences in section thickness and cooling rate, affect the microstructure and resultant tensile strength and hardness of grey iron castings.
The fundamental premise is that grey iron castings solidify under varying thermal gradients. Sections with different wall thicknesses cool at different rates, a process governed by the principles of heat transfer. The cooling rate, in turn, dictates the undercooling experienced by the iron and the kinetics of graphite formation and matrix phase transformation. A faster cooling rate, typical in thinner sections, promotes a finer microstructure and a higher proportion of the strong, hard pearlite phase. Conversely, slower cooling in thicker sections allows for coarser graphite flakes and a greater fraction of the softer ferrite matrix. This variability means that a single casting can exhibit a range of properties, and an attached test block will only be representative of the local conditions from which it is cast.
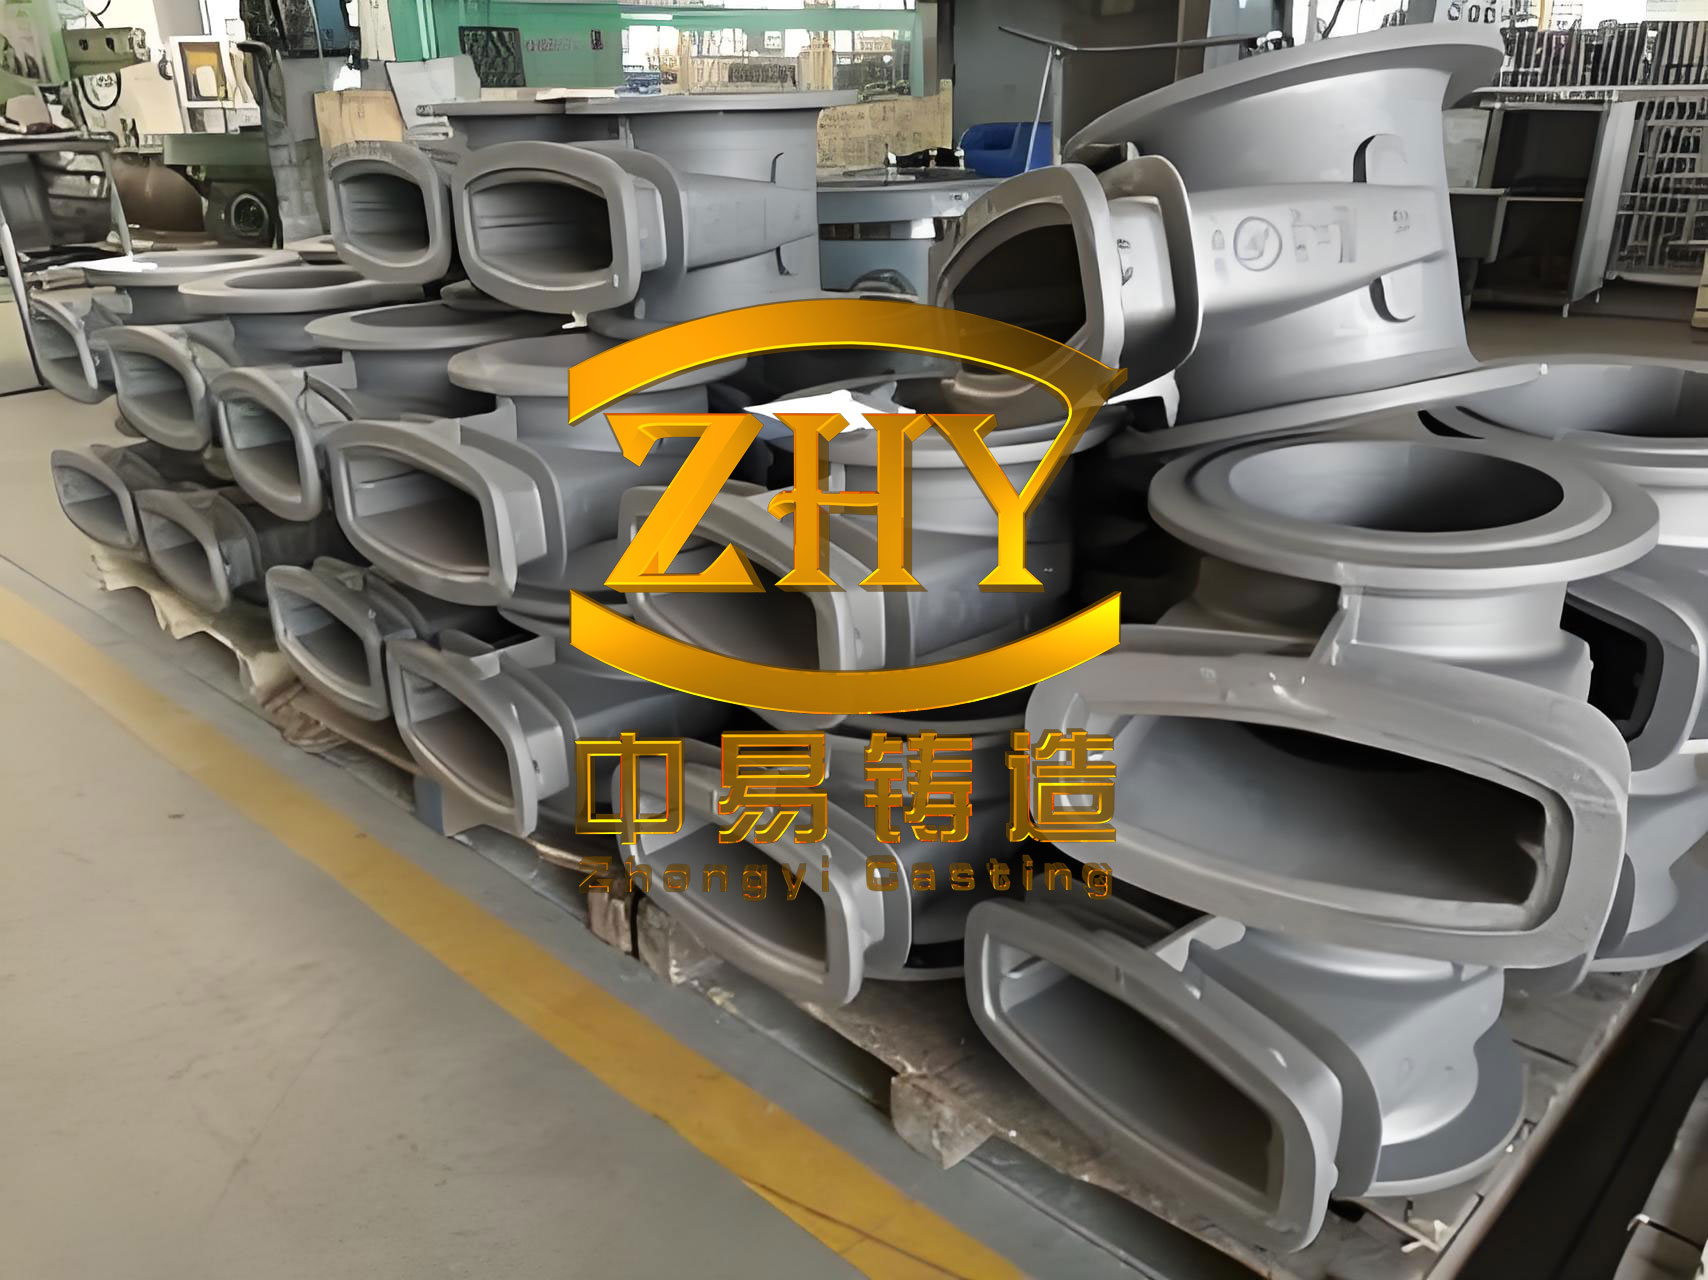
To quantify this effect, I conducted a study on a series of large compressor body grey iron castings, each weighing approximately 10 tons with a specified grade of HT250. The chemical composition was carefully controlled to prevent issues like graphite flotation and shrinkage porosity, common in heavy-section grey iron castings. The final melt chemistry is summarized in Table 1.
| Element | C | Si | Mn | P | S |
|---|---|---|---|---|---|
| Content | 3.10 | 1.80 | 0.85 | 0.035 | 0.073 |
The casting process parameters were standardized. The melting was performed in a coreless induction furnace, allowing for precise temperature control. A “high-temperature tapping, low-temperature pouring” strategy was employed: the molten iron was tapped at 1430°C and poured at 1368°C to minimize casting defects. Inoculation was carried out using 0.4% FeSi75 alloy added in-stream during tapping to enhance graphite nucleation and reduce chilling tendency.
The castings featured non-uniform wall thickness. For this experiment, attached test blocks (of standard geometry per relevant specifications) were integrated at three distinct locations on each of three identical castings. The locations corresponded to nominal wall thicknesses of 45 mm, 80 mm, and 150 mm, representing thin, medium, and thick sections, respectively. Two test blocks were placed at each thickness location per casting to ensure statistical reliability. The coding scheme is detailed in Table 2.
| Wall Thickness (mm) | 45 | 80 | 150 |
|---|---|---|---|
| Test Block Identifiers | A1, A2 | B1, B2 | C1, C2 |
After shakeout and cleaning, the test blocks were separated from the grey iron castings and prepared for metallographic examination and mechanical testing. The microstructure, particularly the pearlite content, was analyzed using optical microscopy. The mechanical properties assessed were tensile strength (Rm) and Brinell hardness (HBW). The results are consolidated in Table 3.
| Test Block ID | Wall Thickness (mm) | Tensile Strength, Rm (MPa) | Brinell Hardness, HBW | Estimated Pearlite Content (%) |
|---|---|---|---|---|
| A1 | 45 | 235 | 178 | 55-65 |
| A2 | 45 | 242 | 185 | 55-65 |
| B1 | 80 | 199 | 162 | 40-50 |
| B2 | 80 | 193 | 161 | 40-50 |
| C1 | 150 | 152 | 135 | 20-30 |
| C2 | 150 | 147 | 129 | 20-30 |
The data reveals a clear and consistent trend: both tensile strength and hardness decrease significantly as the wall thickness of the test block location increases. This is a direct consequence of the changing microstructure. The pearlite content, the primary strengthening phase in grey iron castings, drops from approximately 60% in the 45 mm sections to around 25% in the 150 mm sections. This relationship can be modeled. The strength of grey iron is often empirically related to its microstructure. A simplified linear rule of mixtures can be applied, where the tensile strength (Rm) is a function of the volume fractions of its constituents:
$$ R_m = V_{\alpha} \cdot \sigma_{\alpha} + V_{P} \cdot \sigma_{P} + V_{G} \cdot \sigma_{G} $$
where \( V_{\alpha} \), \( V_{P} \), and \( V_{G} \) are the volume fractions of ferrite, pearlite, and graphite, respectively, and \( \sigma_{\alpha} \), \( \sigma_{P} \), and \( \sigma_{G} \) are their respective characteristic strength contributions. Since graphite contributes negligibly to tensile strength and can be considered a void, and ferrite is relatively soft, the equation simplifies to emphasize the dominant role of pearlite. Therefore, we can posit:
$$ R_m \propto V_{P} $$
The cooling rate (\( \dot{T} \)) is the key driver for \( V_{P} \). For a given chemistry, the transformation kinetics during the eutectoid reaction can be described using concepts from time-temperature-transformation (TTT) diagrams. The time \( t \) to achieve a certain fraction transformed at a constant temperature is inversely related to the undercooling below the eutectoid temperature \( T_e \). Under continuous cooling conditions, the cooling rate affects the temperature at which transformation occurs. A widely used approximation for the dependence of pearlite interlamellar spacing \( S \) on undercooling \( \Delta T \) is given by the Zener-Hillert equation:
$$ S = \frac{k_1}{\Delta T} $$
where \( k_1 \) is a constant. Finer pearlite (smaller S) results from higher undercooling (faster cooling) and confers higher strength according to a Hall-Petch type relationship for the pearlitic ferrite/cementite composite. Furthermore, the volume fraction of pearlite that forms is a function of the cooling rate through the eutectoid range. For many grey iron castings, the empirical relationship can be captured by a sigmoidal function, but for a first-order analysis in the range of practical cooling rates, a linear approximation between critical rates can be useful. Let us define a normalized cooling intensity parameter \( \phi \) for a section of thickness \( d \), using a simplified lumped-capacitance model (Biot number < 0.1 for thin sections). The characteristic cooling rate can be approximated as:
$$ \dot{T} \approx \frac{T_p – T_{\infty}}{\tau} $$
where \( T_p \) is the pouring temperature, \( T_{\infty} \) is the ambient/mold temperature, and \( \tau \) is a characteristic time constant proportional to the square of the section thickness for conductive cooling in a sand mold: \( \tau \propto d^2 / \alpha \), with \( \alpha \) being the thermal diffusivity. Therefore,
$$ \dot{T} \propto \frac{1}{d^2} $$
This inverse-square relationship with thickness explains the dramatic property gradient. Combining these, we can derive a predictive formula for the tensile strength as a function of wall thickness for these specific grey iron castings. Performing a regression analysis on the average strength data from Table 3 yields a power-law fit. The average tensile strengths are: 238.5 MPa (45mm), 196 MPa (80mm), and 149.5 MPa (150mm). Fitting these to a model \( R_m = R_{m0} + \beta \cdot d^{n} \) gives a better fit with an inverse relationship. A simpler empirical correlation is:
$$ R_m(d) \approx 280 – 85 \cdot \log_{10}(d) \quad \text{(MPa, for d in mm)} $$
This logarithmic fit captures the tapering effect of property decline with increasing thickness. The hardness shows a similar trend, as hardness and tensile strength are often correlated for metallic materials. For pearlitic grey iron castings, an approximate relation is \( R_m \approx 3.45 \times HB \) for HB in MPa, but here HB is in Brinell units (kgf/mm²). The measured data gives a ratio \( R_m/HBW \) ranging from about 1.32 for thin sections to 1.14 for thick sections, indicating that the proportionality constant itself may vary with microstructure.
The implications for quality control of grey iron castings are substantial. If a purchasing specification calls for a minimum tensile strength of, say, 200 MPa based on an attached test block, a test block from a 45 mm section might pass easily, while one from a 150 mm section of the same casting would fail, even though the chemical composition and overall processing are identical. This is not a material failure but a consequence of non-representative sampling. Therefore, it is imperative that the location for attaching the test block is specified in the contractual agreement between the foundry and the buyer. The location should be chosen to represent the most critically stressed section of the casting or, alternatively, the section with the slowest cooling rate to ensure a conservative assessment of the casting’s capability. For complex grey iron castings with varying sections, multiple test blocks at different locations might be warranted for a comprehensive evaluation.
To further generalize the findings, I have constructed a more comprehensive model that integrates chemistry, cooling rate, and microstructure. The tendency to form pearlite versus ferrite can be estimated using the carbon equivalent (CE) and a cooling parameter. For grey iron, CE = %C + 0.33(%Si) + 0.33(%P). The critical cooling rate \( \dot{T}_{crit} \) to avoid excessive ferrite or to achieve a target pearlite fraction can be derived from fundamental transformation kinetics. The rate of nucleation \( I \) and growth \( G \) of pearlite colonies depend on undercooling as:
$$ I = I_0 \exp\left(-\frac{Q_I}{k_B T}\right) \exp\left(-\frac{\Delta G^*}{k_B T}\right) $$
$$ G = G_0 \exp\left(-\frac{Q_G}{k_B T}\right) \left(1 – \exp\left(-\frac{\Delta G_v}{k_B T}\right)\right) $$
where \( Q_I \) and \( Q_G \) are activation energies, \( \Delta G^* \) is the critical nucleation energy barrier, \( \Delta G_v \) is the volume free energy change, \( k_B \) is Boltzmann’s constant, and \( T \) is the absolute temperature. The overall transformation rate follows the Johnson-Mehl-Avrami-Kolmogorov (JMAK) equation:
$$ f = 1 – \exp(-K t^n) $$
where \( f \) is the transformed fraction (pearlite), \( K \) is a rate constant dependent on \( I \) and \( G \), \( t \) is time, and \( n \) is an exponent. For continuous cooling, this is integrated over the cooling path. A practical simplification for foundry use is to correlate the pearlite content to a “solidification modulus” (Volume/Surface Area ratio) and the chemical composition. Table 4 proposes a predictive matrix for different classes of grey iron castings.
| Section Modulus (Volume/Surface Area) [mm] | Carbon Equivalent (CE) ~3.5 | Carbon Equivalent (CE) ~3.8 | Carbon Equivalent (CE) ~4.1 |
|---|---|---|---|
| ~10 (Thin wall) | High Strength (250-300 MPa) | Medium-High Strength (220-270 MPa) | Medium Strength (200-240 MPa) |
| ~25 (Medium wall) | Medium-High Strength (230-270 MPa) | Medium Strength (190-230 MPa) | Medium-Low Strength (170-210 MPa) |
| ~50 (Thick wall) | Medium Strength (190-230 MPa) | Medium-Low Strength (160-200 MPa) | Low Strength (140-180 MPa) |
Note: Strength ranges are indicative for inoculated grey iron castings. Actual values depend on specific inoculation practice and pouring temperature.
The thermal history can be modeled more precisely using numerical simulation (e.g., Finite Element Analysis). The heat conduction equation governs the process:
$$ \rho c_p \frac{\partial T}{\partial t} = \nabla \cdot (k \nabla T) + \dot{q}_{latent} $$
where \( \rho \) is density, \( c_p \) is specific heat, \( k \) is thermal conductivity, and \( \dot{q}_{latent} \) is the latent heat release rate due to solidification and phase transformations. Solving this for a given casting geometry provides temperature vs. time curves (\( T(t) \)) at every point, including the locations of attached test blocks. From these curves, one can extract critical parameters like the local cooling rate through the eutectoid temperature (e.g., 723°C). I have found that a parameter like the time spent between 800°C and 600°C (\( \Delta t_{8/5} \)) correlates well with the final pearlite fraction for many grey iron castings. A shorter \( \Delta t_{8/5} \) indicates faster cooling and higher pearlite content.
To illustrate the application of these principles in process control, consider the challenge of ensuring consistent properties in heavy-section grey iron castings. The slower cooling in thick sections not only reduces pearlite but can also lead to coarser graphite, further reducing strength. The combined effect of graphite size and matrix structure can be described by a modified Griffith-Orowan equation for fracture strength, where the critical flaw size is related to the graphite flake length. If we denote the average graphite flake length as \( l_g \), which increases with slower cooling, an empirical relationship for the tensile strength can be:
$$ R_m = \frac{A}{\sqrt{l_g}} + B \cdot V_P $$
where A and B are material constants. This underscores that both microstructural features must be controlled. Therefore, for thick-section grey iron castings, specific inoculants designed for long-lasting nucleation potency (e.g., containing bismuth or rare earth elements) might be employed alongside adjustments to the chemistry (e.g., slightly lower carbon equivalent, increased pearlite-promoting elements like tin or copper) to counteract the natural softening effect of slow cooling. The efficiency of inoculation itself is temperature-dependent, which ties back to the thermal history of the specific location in the mold.
In conclusion, the mechanical properties derived from attached test blocks are not absolute indicators of the quality of grey iron castings but are relative to their specific thermal environment during solidification and cooling. The position of the test block, defined by the local wall thickness and its associated cooling rate, is a dominant variable that can cause significant scatter in test results, even within a single, nominally homogeneous casting. The data and models presented establish a quantitative framework linking cooling kinetics, microstructure (pearlite volume fraction), and final properties. For anyone involved in the specification, production, or procurement of grey iron castings, it is crucial to explicitly define the attachment location of test blocks in technical agreements. This practice eliminates ambiguity, ensures that performance requirements are aligned with the actual service conditions of the casting, and fosters a more scientific approach to quality assessment in the foundry industry. Future work could involve developing standardized positioning guidelines based on casting geometry and finite element thermal simulation to predict the most representative or most critical test location for any given grey iron casting design.