
The development of high-silicon ferritic ductile iron represents a significant advancement in cast iron technology, offering a superior combination of strength, ductility, and machinability compared to conventional ferritic-pearlitic grades like QT450-10. This enhanced performance profile makes it highly attractive for demanding applications across various industries, including heavy machinery, transportation, and energy. A critical factor in realizing the full potential of this material is the precise control of its silicon content and the manufacturing process used. The lost foam casting process, characterized by the vaporization of a foam pattern within unbonded sand under a vacuum, presents unique thermal conditions that influence solidification and microstructure development. This article provides a comprehensive, first-person analysis of the influence of silicon content on the microstructure and mechanical properties of ductile iron produced via the lost foam casting process, integrating experimental data with theoretical explanations of the underlying mechanisms.
The lost foam casting process introduces distinct thermal dynamics compared to conventional green sand casting. The decomposition of the expandable polystyrene (EPS) pattern during metal pouring consumes a substantial amount of heat (the heat of vaporization). This endothermic reaction cools the metal front, affecting the temperature gradient and solidification rate. Consequently, parameters like pouring temperature and vacuum level become more critical. An excessively low temperature can lead to cold shuts and non-metallic inclusions due to incomplete pattern gas evacuation, while an excessively high temperature may degrade nodularization efficiency and promote carbide formation. Furthermore, silicon is a powerful graphitizer and significantly alters the eutectic and eutectoid transformation temperatures. In the context of the lost foam casting process, understanding the interplay between silicon content and these unique thermal conditions is essential for achieving a fully ferritic matrix with optimal graphite morphology.
To systematically investigate this relationship, a series of experiments were designed. The base composition was a ductile iron equivalent to QT450-10, with three additional high-silicon variants. A key principle in the design was to maintain a relatively constant carbon equivalent (CE) to isolate the effect of silicon. The carbon equivalent is calculated using the formula:
$$ \omega(CE)\% = \omega(C)\% + \frac{1}{3}\left[\omega(Si)\% + \omega(P)\%\right] $$
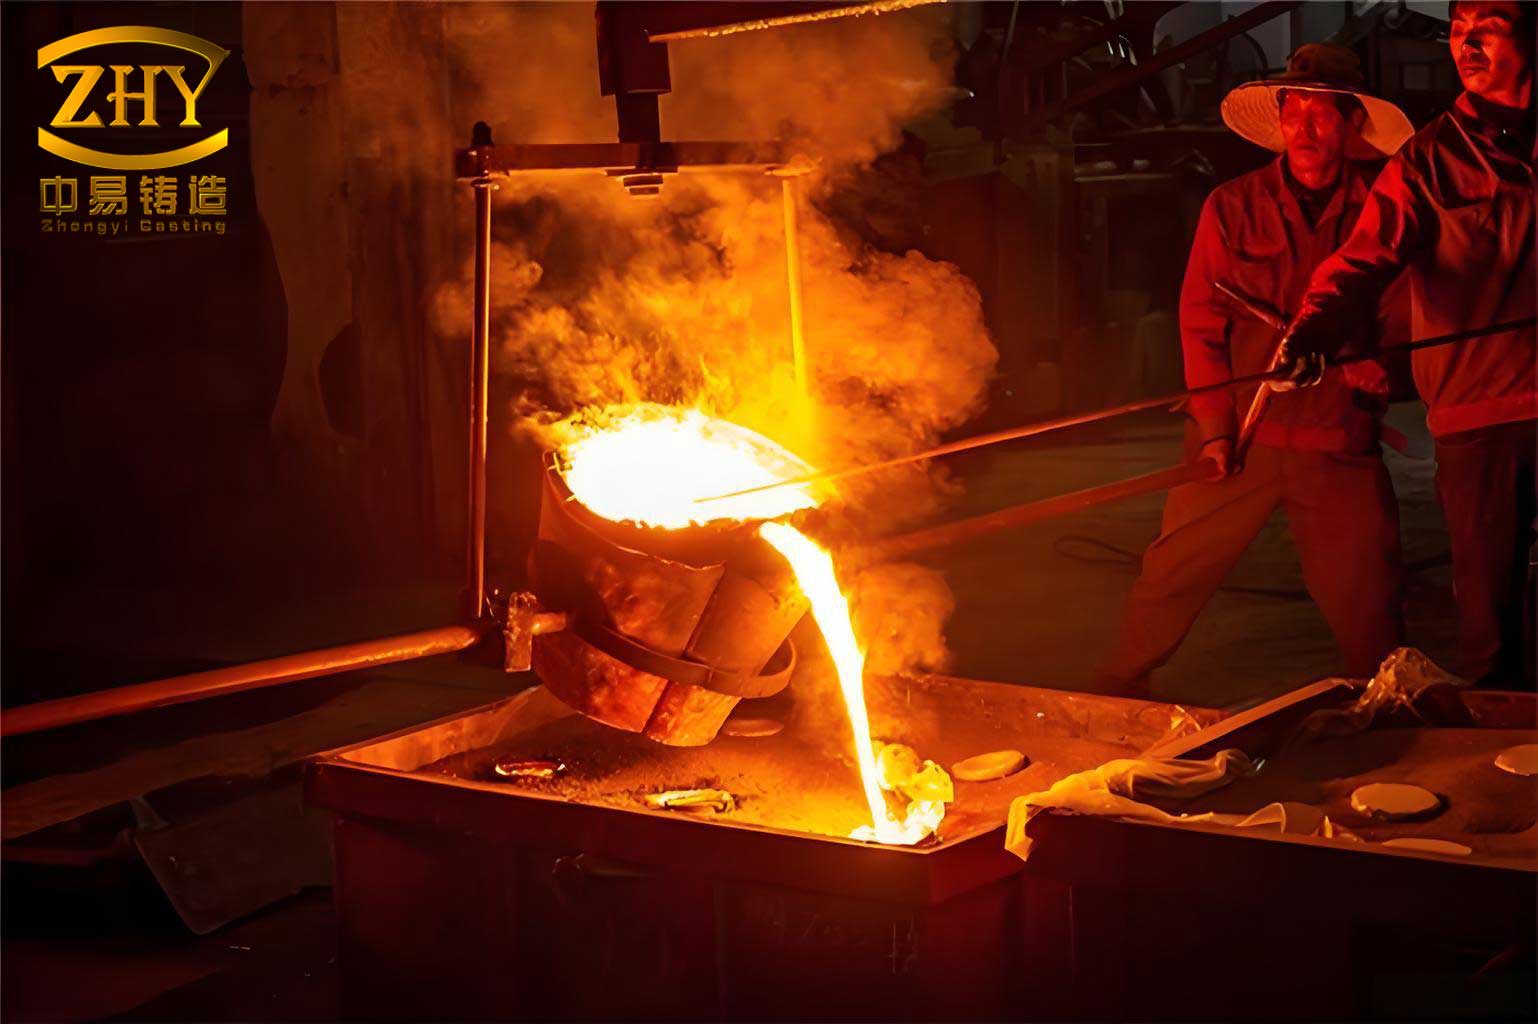
Therefore, as the silicon content was increased, the carbon content was proportionally decreased to keep CE within a narrow range, primarily between 4.0% and 4.4%. Melting was conducted in a medium-frequency induction furnace. The crucial lost foam casting process parameters were strictly controlled: EPS patterns were coated with alumina-based refractory, dry silica sand was used as the molding aggregate, a vacuum of 0.05 MPa was applied, and the pouring temperature was maintained at approximately 1487°C. Nodularization was achieved using the wire-feeding method with a 1.3% addition of nodulizing alloy, followed by inoculation with 75% ferrosilicon. The chemical compositions of the four resulting alloy groups are summarized in Table 1.
| Sample Group | C | Si | Mn | P | S | Mg | CE* |
|---|---|---|---|---|---|---|---|
| A (Reference) | 3.52 | 2.92 | 0.183 | 0.029 | 0.0058 | 0.064 | 4.40 |
| B (High-Si) | 3.09 | 3.68 | 0.273 | 0.027 | 0.0057 | 0.068 | 4.20 |
| C (High-Si) | 2.88 | 4.22 | 0.311 | 0.026 | 0.0037 | 0.059 | 4.15 |
| D (High-Si) | 2.60 | 4.59 | 0.265 | 0.024 | 0.0046 | 0.057 | 3.98 |
| *CE = C% + (Si%+P%)/3 | |||||||
Metallographic examination revealed profound effects of silicon on both graphite and matrix structure. All samples exhibited excellent nodularity, exceeding 90%, regardless of silicon content. However, a clear trend in graphite size and distribution was observed. Quantitative image analysis provided the data summarized below:
| Sample | Si (wt.%) | Graphite Nodule Count (nodules/mm²) | Average Graphite Nodule Diameter (µm) | Ferrite Content (Area %) | Average Ferrite Grain Size (µm) |
|---|---|---|---|---|---|
| A | 2.92 | 151 | 35.6 | 88.8 | 43.77 |
| B | 3.68 | 165 | 30.8 | 89.9 | 42.06 |
| C | 4.22 | 208 | 27.7 | 90.0 | 38.63 |
| D | 4.59 | 223 | 26.0 | 91.7 | 35.38 |
The data shows that increasing silicon content from 2.92% to 4.59% led to a significant refinement of the graphite structure. The average nodule diameter decreased by approximately 27%, while the nodule count per unit area increased by nearly 48%. This refinement can be attributed to two primary factors related to silicon’s role in the lost foam casting process solidification. First, silicon is a potent graphitizing element and can act as a substrate for graphite nucleation, increasing the number of potential nucleation sites. Second, silicon strongly elevates the stable (austenite-graphite) eutectic temperature. In the thermal environment of the lost foam casting process, this results in a greater undercooling at the solidification front for the graphite eutectic reaction, thereby increasing the nucleation rate and leading to a finer, more populous graphite phase. Concurrently, the reduced carbon content (to maintain CE) directly decreases the total volume fraction of graphite, contributing to smaller nodule sizes.
More strikingly, the matrix microstructure in all high-silicon variants (B, C, D) was essentially fully ferritic. Even the reference sample (A) with 2.92% Si showed a predominantly ferritic matrix (88.8%). This is a direct consequence of silicon’s influence on phase transformation kinetics. Silicon raises both the eutectoid temperature and the temperature range between the stable (austenite-ferrite-graphite) and metastable (austenite-pearlite) transformations. This thermodynamic shift makes the formation of ferrite more favorable over pearlite. From a kinetic perspective, the refined and closely spaced graphite nodules in the high-silicon irons provide a short-circuit path for carbon diffusion from the austenite to the nodules during cooling. This rapid decarburization of austenite promotes the nucleation of ferrite at the austenite/graphite interface, facilitating the development of a fully ferritic matrix. Furthermore, as seen in Table 2, the average ferrite grain size decreased systematically with increasing silicon content, indicating a grain-refining effect. The elevated eutectic temperature and associated increased nucleation rate for the primary austenite phase likely lead to a finer initial austenite grain structure, which is subsequently inherited by the ferrite grains after the eutectoid transformation.
The mechanical property evaluation revealed a remarkable strengthening effect from silicon, as detailed in Table 3. The properties were obtained from tensile tests and hardness measurements performed on specimens extracted from castings produced by the lost foam casting process.
| Sample | Si (wt.%) | Tensile Strength (MPa) | Yield Strength (MPa) | Yield-to-Tensile Ratio | Elongation (%) | Brinell Hardness (HBW) |
|---|---|---|---|---|---|---|
| A | 2.92 | 441 | 325 | 0.74 | 17.0 | 128 |
| B | 3.68 | 527 | 425 | 0.81 | 18.0 | 149 |
| C | 4.22 | 601 | 512 | 0.85 | 17.0 | 175 |
| D | 4.59 | 683 | 588 | 0.86 | 17.5 | 186 |
The trend is unequivocal: strength and hardness increase substantially with silicon content. Tensile strength nearly doubled from 441 MPa to 683 MPa, while hardness increased by over 45%. Crucially, this significant strengthening was achieved without compromising ductility; elongation remained consistently high between 17% and 18%. The yield-to-tensile ratio also increased, indicating a material with a higher resistance to plastic deformation after yielding, which is desirable for many structural applications. Fractography analysis supported these macroscopic observations. The fracture surface of the lower-silicon sample (A) exhibited a classic dimpled morphology indicative of ductile fracture, with graphite nodules often located at the center of the dimples. As the silicon content increased to 4.59% (Sample D), the fracture surfaces showed a mixed mode, with areas of quasi-cleavage and some intergranular fracture appearing alongside dimples, suggesting a transition towards a more brittle micromechanism, though the macroscopic ductility remained high.
The core mechanism behind this exceptional combination of properties is the solid solution strengthening of ferrite by silicon. To understand this, one must consider the Fe-Si phase diagram and atomic-scale interactions. In the composition range studied (2.9-4.6% Si), the equilibrium microstructure is single-phase ferrite (α-Fe) with silicon in solid solution. Silicon atoms (atomic radius ≈ 0.118 nm) dissolve substitutionally in the body-centered cubic (BCC) lattice of ferrite, replacing iron atoms (atomic radius ≈ 0.124 nm). The size mismatch between the solute (Si) and solvent (Fe) atoms induces lattice strain. This strain field interacts with dislocations, impeding their motion and thereby increasing the stress required for plastic deformation—the fundamental definition of solid solution strengthening. The degree of strengthening is proportional to the concentration of the solute. Micro-hardness testing directly on the ferrite grains confirmed this intensifying effect: the average micro-hardness (HV0.3) of ferrite increased from approximately 186 HV for Sample A to 253 HV for Sample D.
However, the strengthening effect is not solely due to a uniform distribution of silicon atoms. Detailed analysis using scanning electron microscopy with energy-dispersive X-ray spectroscopy (SEM-EDS) revealed significant segregation behavior. By measuring the silicon concentration at specific points within ferrite grains and at grain boundaries, a segregation index (K_Si) can be calculated for each measurement point (i):
$$ K_{Si}^{(i)} = \frac{\omega_{Si}^{(i)}}{\omega_{Si}^{0}} $$
where $\omega_{Si}^{(i)}$ is the silicon concentration at point *i* and $\omega_{Si}^{0}$ is the nominal average silicon content of the alloy. A value greater than 1 indicates positive segregation (enrichment), while a value less than 1 indicates depletion. The analysis showed that in the lower-silicon alloy (Sample A, 2.92% Si), silicon was slightly enriched within the ferrite grain interiors ($K_{Si}$ ~1.01-1.04) and depleted at the grain boundaries ($K_{Si}$ ~0.68-0.72). In contrast, in the highest-silicon alloy (Sample D, 4.59% Si), the pattern reversed: silicon was strongly enriched at the grain boundaries ($K_{Si}$ ~1.09-1.12) and slightly depleted in the grain interiors ($K_{Si}$ ~0.83-0.91). This increasing level of silicon segregation at grain boundaries with higher nominal content creates additional barriers to dislocation motion and grain boundary sliding, contributing significantly to the increased strength and hardness, but also making the boundaries potential sites for crack initiation, as observed in the fractography.
The lattice distortion caused by silicon was quantified using X-ray diffraction (XRD). The XRD patterns confirmed the presence of only ferrite and graphite phases. The lattice parameter (a) of the BCC ferrite was calculated from the diffraction peak positions using Bragg’s law and the relationship for cubic crystals:
$$ d_{hkl} = \frac{a}{\sqrt{h^2 + k^2 + l^2}} $$
where $d_{hkl}$ is the interplanar spacing for the Miller indices (hkl). The calculated average lattice parameters are presented below:
| Si (wt.%) | Calculated Lattice Parameter, a (nm) | Lattice Strain Relative to Pure α-Fe* (%) |
|---|---|---|
| 2.92 | 0.28647 | -0.06 |
| 3.68 | 0.28625 | -0.14 |
| 4.22 | 0.28618 | -0.16 |
| 4.59 | 0.28602 | -0.22 |
| *Lattice parameter of pure α-Fe is approximately 0.28664 nm. Strain = (asample – apure Fe)/apure Fe × 100%. | ||
The data shows a consistent contraction of the ferrite lattice with increasing silicon content. This contraction is expected as the smaller silicon atoms substitute for larger iron atoms. The resulting lattice strain, quantified in the right column, increases with silicon content. This macroscopic measurement of lattice distortion directly correlates with the increased resistance to dislocation motion, providing a fundamental crystallographic explanation for the observed solid solution strengthening.
In summary, the successful application of the lost foam casting process to produce high-silicon ductile iron hinges on understanding and leveraging the multifaceted role of silicon. The process itself, with its specific thermal characteristics, interacts with the metallurgical effects of silicon to yield a unique microstructure. The key findings and mechanisms can be synthesized as follows:
- Graphite Refinement: Silicon increases graphite nucleation sites and elevates the eutectic temperature, promoting a finer and more numerous graphite structure during solidification in the lost foam casting process. This refinement reduces stress concentration around the nodules.
- Full Ferrite Matrix Promotion: Silicon thermodynamically and kinetically favors the formation of ferrite over pearlite, leading to a fully ferritic matrix even in the as-cast condition, which is crucial for good ductility and toughness.
- Ferrite Grain Refinement: Associated with the refined solidification structure, the ferrite grain size decreases with increasing silicon content, contributing to strength via the Hall-Petch mechanism (fine-grain strengthening).
- Solid Solution Strengthening: This is the dominant mechanism. Silicon dissolves substitutionally in ferrite, causing lattice strain and dislocation pinning. The strengthening effect intensifies with silicon concentration.
- Segregation-Induced Strengthening: At higher levels (e.g., >4.2%), silicon tends to segregate to ferrite grain boundaries, creating additional localized barriers that enhance strength but may slightly embrittle the boundaries.
The combined effect of these mechanisms, enabled by precise control of the lost foam casting process parameters, results in a material whose properties can be tailored by adjusting silicon content. For instance, an iron with ~4.6% Si produced via this method can achieve tensile strengths exceeding 680 MPa, a hardness of ~185 HBW, and retain an elongation over 17%, far surpassing the capabilities of standard ferritic grades like QT450-10. This opens significant opportunities for weight reduction and performance enhancement in complex, thin-walled castings where the net-shape capabilities of the lost foam casting process are particularly advantageous. Future work may focus on further optimizing the lost foam casting process parameters (e.g., pattern density, coating permeability, vacuum profile) for these high-silicon alloys and exploring the impact on dynamic properties like fatigue and impact resistance.