
In the production of thin-walled shell components via lost foam casting, our company consistently encountered a range of defects that impacted both external quality and internal integrity. Externally, issues such as dimensional instability led to machining allowances being insufficient (revealing “black skin”) and core shifts. Internally, defects including distortion, mold wall movement (“inverse swelling”), and carbonaceous inclusions were prevalent. A root cause analysis indicated that a significant proportion of these defects originated in the “white area” processes—the stages involving foam pattern production. Consequently, we determined that quantifying and validating pattern quality through measurable characteristic data was essential for improvement.
To address this, a dedicated quality project team was established. The team’s objective was to conduct a detailed measurement and analysis of key white area processes specifically for shell castings. The core of our investigation was to study the relationship between foam pattern quality parameters and the resultant casting defects. By identifying and implementing the optimal combination of these parameters, we aimed to drastically reduce the absolute number of casting defects attributable to poor pattern quality, thereby significantly improving the product yield rate.
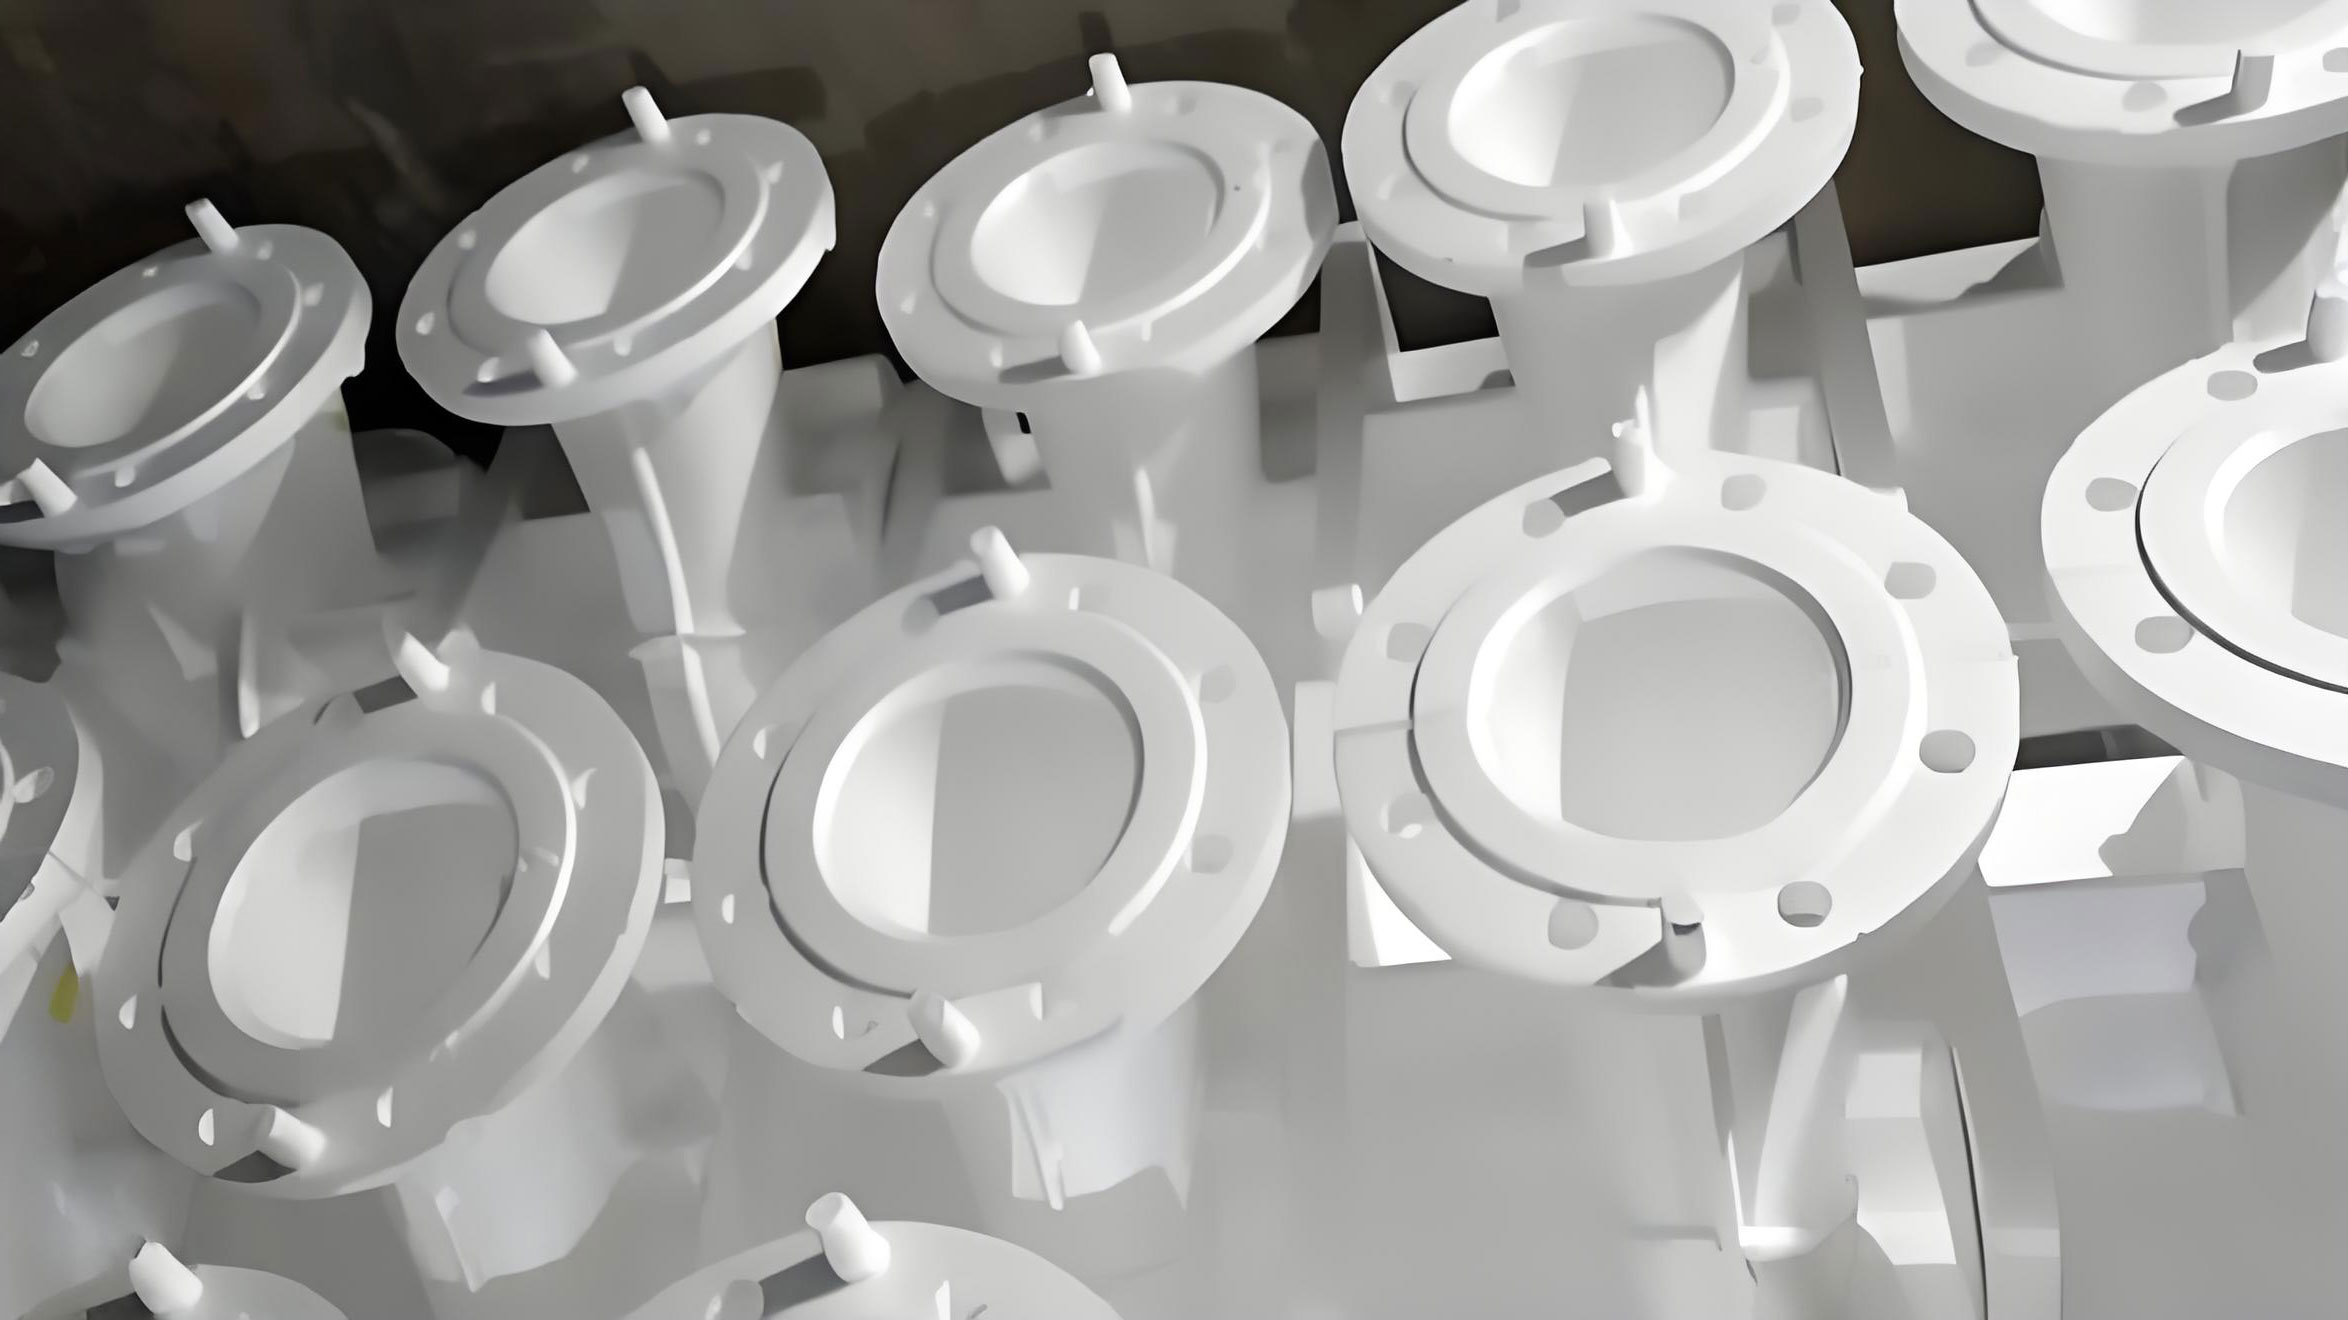
The foundational element in lost foam casting is the foam pattern itself. Its consistency is paramount for dimensional repeatability of the final casting. We initiated our study by evaluating the raw material: expandable polystyrene (EPS) beads. Sourcing beads of the same nominal grade from three different suppliers, we processed them to an identical pre-expansion density using the same equipment. These beads were then used to produce patterns from an identical mold (Mold #8), followed by a standardized aging period. The results, however, revealed significant discrepancies.
The measured shrinkage values from the mold dimension to the final casting dimension varied notably depending on the bead supplier, as summarized in Table 1. This variation was primarily attributed to differences in the polymer’s molecular weight between suppliers, which directly influences the pattern’s mechanical strength, rigidity, and linear shrinkage behavior. Since in-house testing for such molecular properties was not feasible, the critical corrective action was to fix and standardize the raw material supplier. This single change became a prerequisite for ensuring consistent pattern performance and dimensional stability in our lost foam casting operations.
| Bead Supplier | Original Bead Size (mm) | Target Pre-expansion Density (g/L) | Mold ID | Aging Time (h) | Pattern Dimension after Aging (mm) | Final Casting Dimension (mm) |
|---|---|---|---|---|---|---|
| A | 0.3 – 0.5 | 23.8 | 8# | 120 | 482 | 480 |
| B | 0.4 – 0.6 | 23.8 | 8# | 120 | 485 | 483 |
| C | 0.25 – 0.6 | 23.6 | 8# | 120 | 483 | 481.5 |
Bead pre-expansion is arguably the most critical step in the white area of lost foam casting. The achieved density dictates the pattern’s final weight, its shrinkage characteristics, its strength during handling, and its gas generation during metal pouring. Initial data collection from our pre-expansion equipment revealed an unacceptably high level of density variation over time. The process was not in a state of statistical control, as evidenced by the wide spread of individual density measurements. The initial process capability was poor, directly contributing to inconsistent pattern properties. We systematically addressed this by refining operational parameters. This involved precisely controlling the mass of beads fed into the pre-expander, optimizing steam pressure and duration, and ensuring consistent bead conditioning. The outcome was a dramatic reduction in density variation. The process was brought into a much tighter control range, as shown by the improved control chart. The standard deviation ($\sigma$) of the density was reduced significantly, enhancing the process capability index ($C_{pk}$). The optimization can be summarized by comparing the process spread before and after:
Initial Density Range: $R_i = \text{Max}(Density) – \text{Min}(Density)$
Optimized Density Range: $R_o = \text{Max}(Density) – \text{Min}(Density)$, where $R_o << R_i$.
The key learning was that pre-expansion parameters cannot be copied from external sources. They must be meticulously developed and validated in conjunction with the specific characteristics of the equipment, the raw bead properties, and the plant’s steam supply conditions.
| Process State | Average Density, $\bar{x}$ (g/L) | Standard Deviation, $\sigma$ (g/L) | Upper Control Limit, UCL (g/L) | Lower Control Limit, LCL (g/L) | Process Range (g/L) |
|---|---|---|---|---|---|
| Before Optimization | 24.89 | ~0.70 | 27.70 | 22.09 | 22.09 – 27.70 |
| After Optimization | 23.85 | ~0.30 | 24.25 | 22.54 | 22.54 – 24.25 |
The molding process transforms pre-expanded beads into the precise foam pattern. A high-quality pattern exhibits uniform bead fusion, a smooth surface, and absence of under-fused or over-fused (shriveled) regions. Achieving this consistently requires a synergy of mold design and process control. We had previously automated our molding machines to eliminate manual variability. The focus then shifted to optimizing the steam injection, fusion, and cooling cycle times. However, a major factor influencing dimensional stability and defect propensity is the phenomenon of pattern shrinkage. Shrinkage in lost foam casting is not a single, uniform event. It occurs in stages: initial shrinkage post-demolding, secondary shrinkage during aging, and tertiary shrinkage during coating and drying. Each shell component, due to its unique geometry (ribs, walls, junctions), exhibits different shrinkage magnitudes in different directions. For instance, a free linear dimension may follow one shrinkage trend, while a constrained dimension across a core may follow another. We modeled the total shrinkage ($S_{total}$) from mold to final casting as a function of these stages:
$$ S_{total} = S_{initial} + S_{aging} + S_{coating} + S_{thermal} $$
where $S_{thermal}$ represents the shrinkage compensation required for the metal’s solidification contraction, which is accounted for in the mold’s master dimensions. Our data showed that a pattern’s dimensions can stabilize over 20 to 50 days. Furthermore, the orientation of the pattern during aging (horizontal vs. vertical) affects the linear shrinkage due to gravity-induced creep. A critical finding involved the use of “pre-opening” mechanisms in molds. While improving surface finish, excessive pre-opening gaps (2-4 mm) led to localized density increases of nearly 50% in thin-wall (7-8 mm) shells. This caused significant pattern weight variation and inconsistent shrinkage. We recommended minimizing or precisely controlling the pre-opening gap to 1-2 mm maximum to ensure consistency.
Aging or curing of foam patterns serves two vital purposes: stabilizing dimensions and reducing volatile content. The volatiles consist of residual pentane (the blowing agent) and moisture. If excessive, they lead to violent gas generation during metal pour, causing metal turbulence, carbon defects, or even dangerous back-pressure. We quantified the “Total Volatile Content” (TVC) by sampling beads from the thickest section of patterns aged at different rack heights (L1 to L6, top to bottom). The TVC was measured as the weight loss after oven-drying at 150°C for 1 hour:
$$ TVC (\%) = \frac{W_{initial} – W_{dry}}{W_{initial}} \times 100 $$
The analysis revealed a strong gradient, with patterns at the top of the aging room (warmer) having lower TVC than those at the bottom (cooler and more humid). This inconsistency directly translated to variable gas generation during lost foam casting. To combat this, we improved air circulation and temperature uniformity within the aging room. Concurrently, we studied the relationship between aging time and pattern weight loss (a proxy for volatile removal). Data showed a measurable decrease in weight between 48 and 72 hours of aging. For a standard shell pattern with a theoretical weight of 300g ±15g, sufficient aging was deemed complete only when the weight loss plateaued, ensuring a more consistent and lower TVC.
| Aging Time (h) | Pattern Weight (g) per Sample Batch | Mean Weight (g) | ||||
|---|---|---|---|---|---|---|
| Batch 1 | Batch 2 | Batch 3 | Batch 4 | Batch 5 | ||
| 48 | 309.8 | 310.5 | 307.45 | 303.3 | 295.55 | 305.3 |
| 72 | 312.1 | 309.2 | 309.2 | 305.35 | 314.25 | 310.0 |
*Note: The apparent increase in mean weight at 72h for some batches is attributed to reaching a stable, dry weight after the loss of moisture, which can be heavier than a partially dried, moisture-laden pattern at 48h. The key is the stabilization of weight.
The coating process in lost foam casting applies a permeable refractory layer to the foam pattern. Coating density is the primary control parameter for coating thickness, which in turn governs permeability. Permeability is critical for allowing the gaseous products of foam degradation to escape ahead of the advancing metal front. Insufficient permeability leads to gas entrapment, carbon defects, cold shuts, and misruns. While direct permeability measurement is complex, controlling slurry density is a practical and effective proxy. We conducted a six-month study to optimize the coating density for our shell components. Previously, density was loosely controlled between 1.5 and 1.7 g/cm³, resulting in a wide variation in dried coating weight (3.5 to 4.5 kg for a specific shell). We established a direct correlation: a density increase of 0.01 g/cm³ increased the dried pattern weight by approximately 0.12 kg. Through systematic single-factor experiments, we compared the casting quality from patterns with coating weights at the upper and lower limits. Patterns at the higher weight range (3.8-4.5 kg) showed a marked increase in defect propensity, likely due to reduced permeability. The optimal window was narrowed to a slurry density of 1.52 – 1.60 g/cm³, yielding a consistent dried pattern weight of 3.2 – 3.5 kg. This relationship can be expressed as:
$$ \Delta W_{coating} \approx k \cdot \Delta \rho_{slurry} $$
where $\Delta W_{coating}$ is the change in dried coating weight, $\Delta \rho_{slurry}$ is the change in slurry density, and $k$ is a constant specific to the pattern geometry and coating material.
A crucial ancillary control was ensuring the coated patterns were stored in a dry environment before pouring, as coating hygroscopy can lead to moisture pickup, reducing strength and increasing gas generation.
In conclusion, the systematic analysis and optimization of white area processes are fundamental to achieving high-quality shell components in lost foam casting. This project yielded several key principles: First, comprehensive front-end planning for each unique part geometry is non-negotiable to avoid costly trials. Second, process parameters must be developed based on direct, data-driven experimentation within one’s own production context, not adopted uncritically from external sources. Third, once optimal parameters are identified—from raw material selection and pre-expansion density control through molding, aging, and coating—they must be rigorously documented and adhered to as standardized work instructions. The success of the lost foam casting process is inextricably linked to the consistency achieved in the white area. By treating foam pattern production as a precision manufacturing activity governed by quantifiable quality characteristics, we successfully reduced defect rates attributed to pattern quality and enhanced overall product yield.