
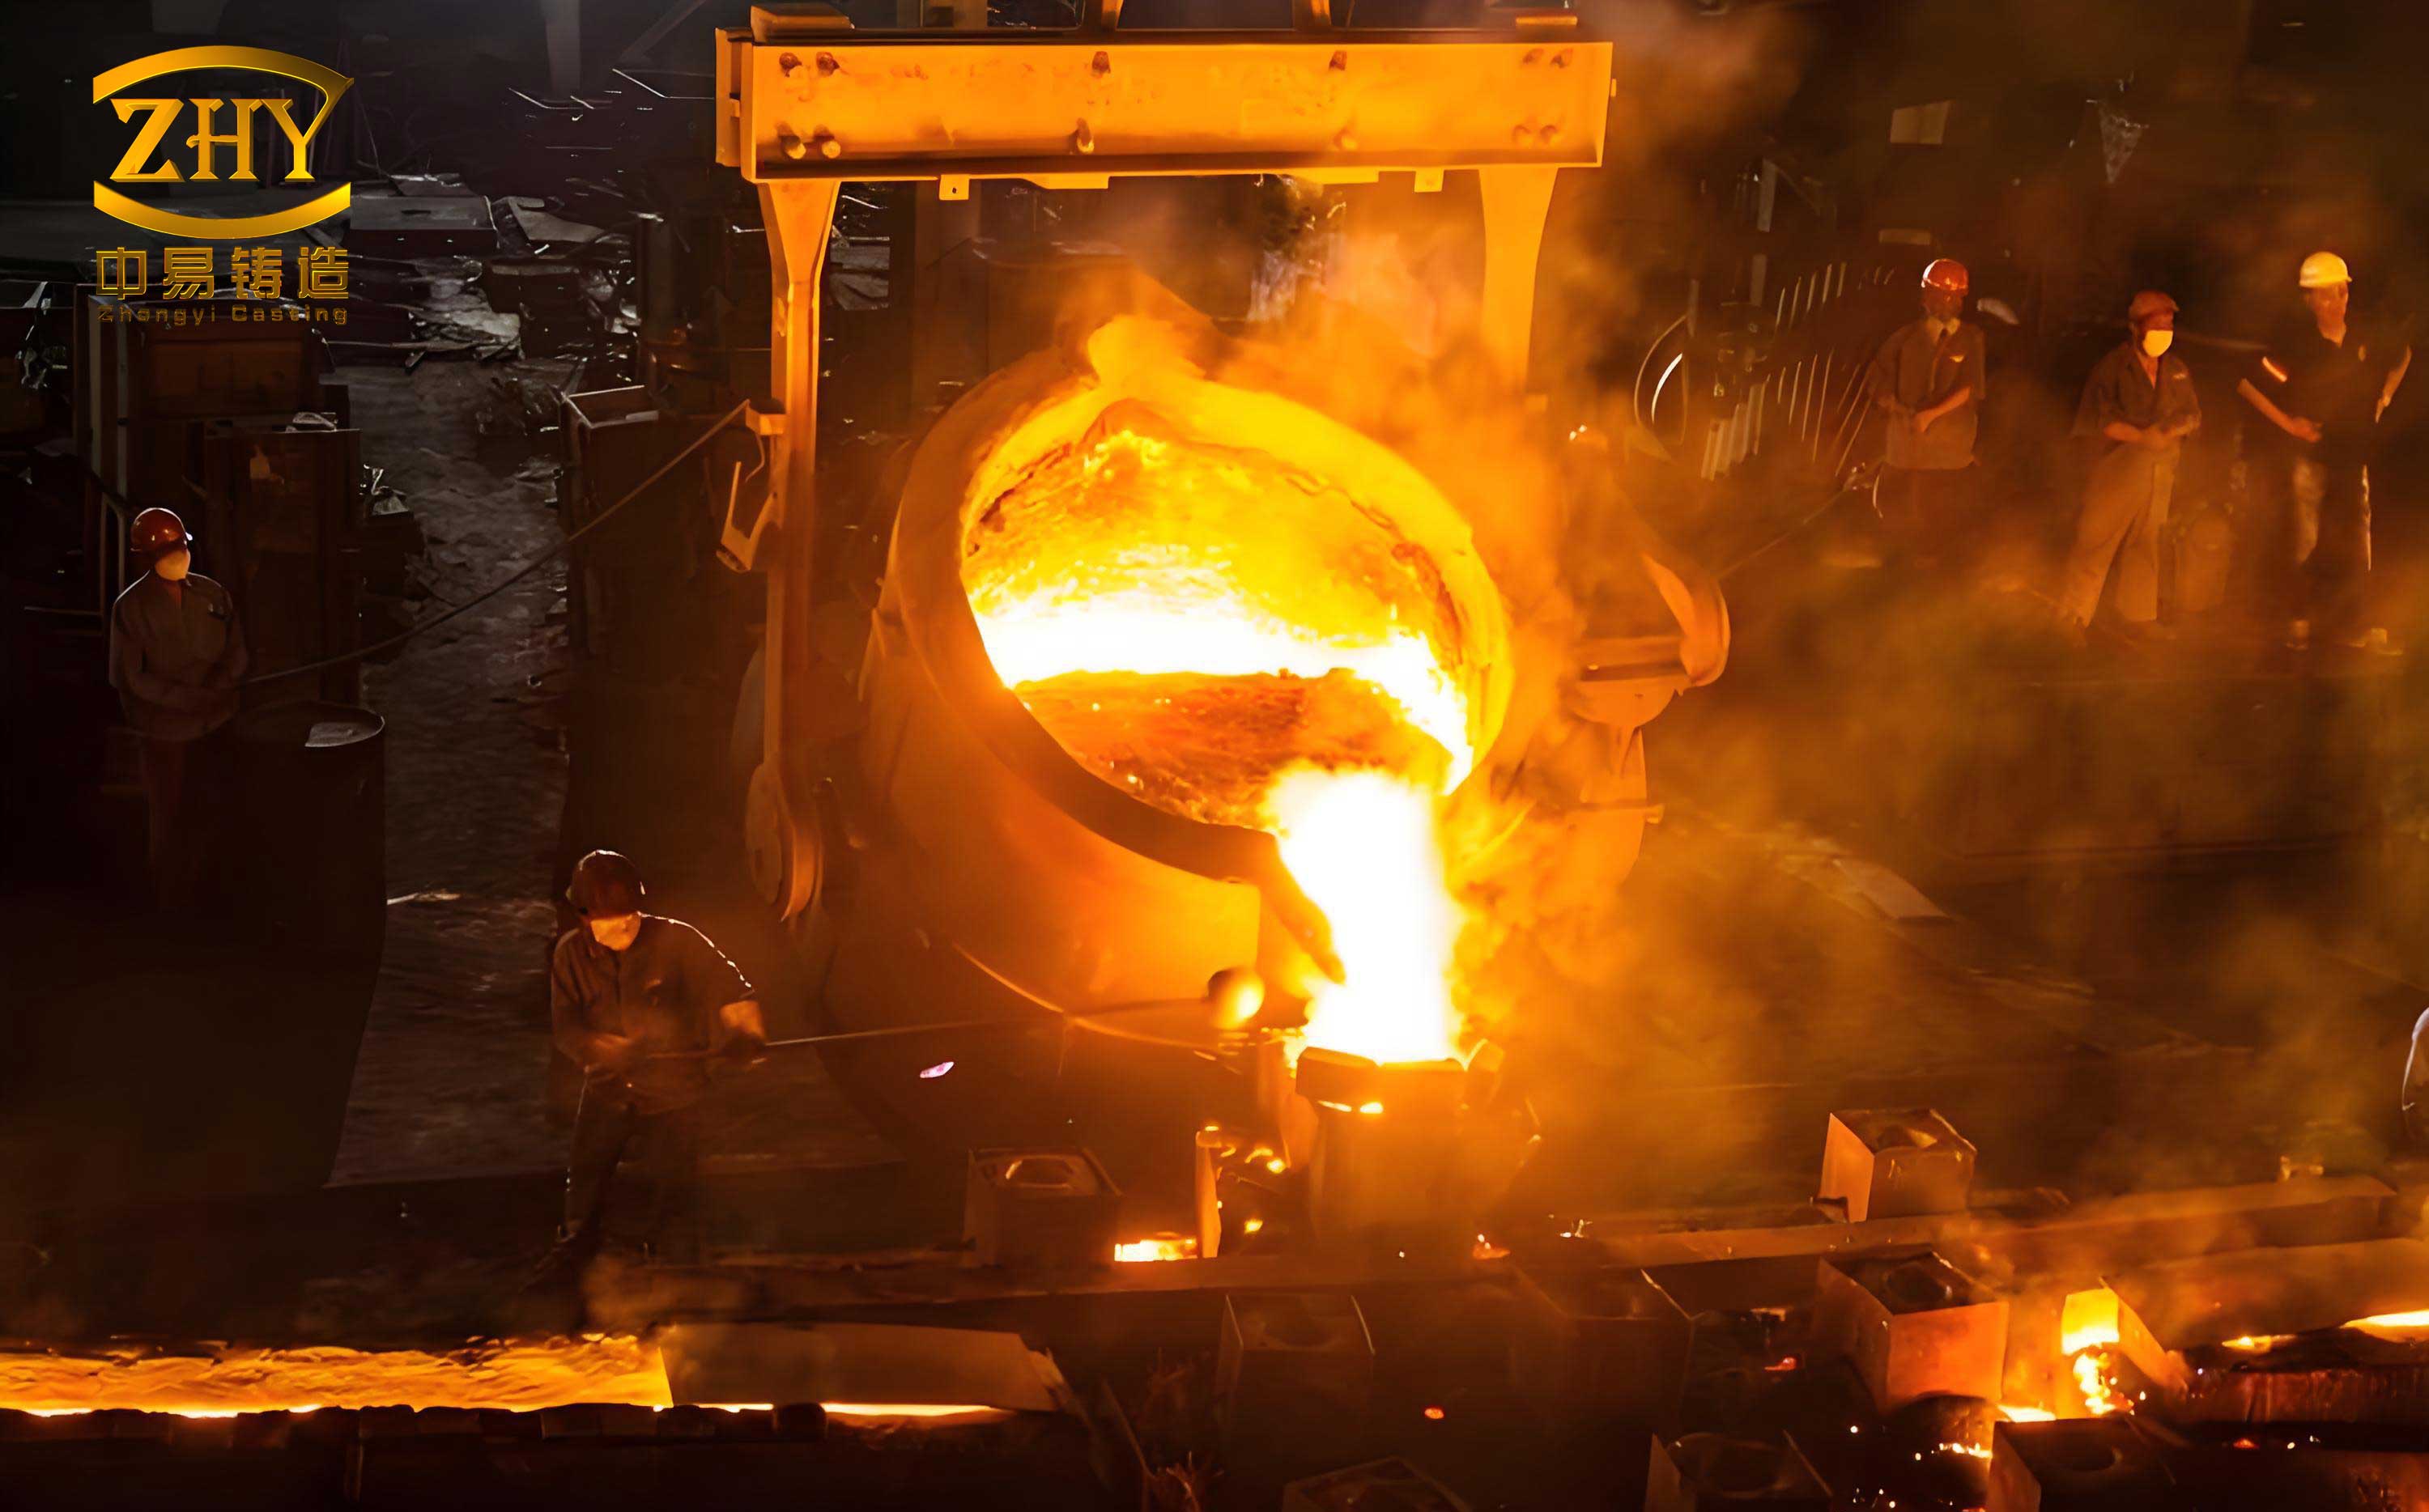
In modern industrial operations, particularly in mining, cement, and power generation, ball mill liners play a critical role in protecting equipment from wear and impact. As a key component, the liner’s performance directly influences the mill’s longevity, safety, and operational efficiency. Among various materials, high manganese steel is widely preferred due to its exceptional work-hardening capability, toughness, and resistance to abrasive environments. However, casting high manganese steel components, such as liners, poses significant challenges, including a high propensity for shrinkage porosity and cavities, primarily due to its low thermal conductivity and substantial solidification shrinkage. In the context of a manganese steel casting foundry, addressing these defects is paramount to ensuring product quality and cost-effectiveness.
Lost foam casting (LFC) has emerged as a versatile and efficient manufacturing technique, offering design flexibility, high dimensional accuracy, and reduced environmental impact compared to traditional casting methods. Nonetheless, optimizing LFC processes for complex geometries like liners often requires extensive trial-and-error, which is time-consuming and resource-intensive. To mitigate this, finite element simulation tools, such as ProCAST, enable virtual analysis of filling and solidification dynamics, facilitating defect prediction and process refinement. This study leverages such simulations to assess three distinct LFC gating system designs for producing high manganese steel liners, aiming to identify the most suitable approach for minimizing internal defects. The insights gained are directly applicable to enhancing operations in a manganese steel casting foundry, where precision and reliability are crucial.
The liner casting approximates a rectangular block with a single-peak wavy working surface, measuring approximately 590 mm in length, 340 mm in width, and varying thickness from 80 mm to 120 mm at its thickest section. Two through-holes are present: an elliptical hole on the working surface and a circular hole (ϕ150 mm) on the outer surface. To ensure stable metal flow and rational thermal distribution, three gating systems were conceptualized for evaluation. These designs represent common strategies employed in a manganese steel casting foundry to balance productivity and quality.
The first process, designated as Process A, utilizes a top-gating system to cast eight liners per mold without supplementary risers. Process B employs a stepped side-gating approach to cast ten liners per mold, also without risers. Process C adopts a simple side-gating system with integrated risers to cast four liners per mold. The core objective is to compare these configurations in terms of filling stability, temperature uniformity, and susceptibility to shrinkage defects, which are common concerns in any manganese steel casting foundry. The material used is ZGMn13 steel, with its chemical composition detailed in Table 1. This alloy is typical in foundry settings for wear-resistant applications.
| Element | C | Mn | Si | Cr | S | P | Ni | V | Al | Fe |
|---|---|---|---|---|---|---|---|---|---|---|
| Content | 1.40 | 13.35 | 0.70 | 2.10 | 0.005 | 0.038 | 0.03 | 0.025 | 0.005 | Bal. |
Thermophysical properties of the alloy, essential for accurate simulation, were calculated using the ProCAST database module. The Back-diffusion solidification model was selected with a cooling rate of 5 °C/s. Key parameters, such as density (ρ), enthalpy (H), thermal conductivity (k), and solid fraction (f_s), vary with temperature (T) and are critical for predicting solidification behavior. These relationships can be expressed through empirical formulas often used in foundry simulations. For instance, the density variation during solidification significantly influences shrinkage defects. A simplified representation of the solid fraction curve, which affects mushy zone formation, can be described using a linear approximation between the liquidus (T_L) and solidus (T_S) temperatures:
$$ f_s = \frac{T_L – T}{T_L – T_S} \quad \text{for} \quad T_S \leq T \leq T_L $$
However, for high manganese steel, the relationship is more complex due to its wide freezing range. The calculated thermal properties are summarized in Figure 2 of the reference, but here we represent key data points functionally. The latent heat of fusion (L) for ZGMn13 is approximately 270 kJ/kg, and the specific heat (c_p) varies with temperature. The thermal conductivity in the solid state can be modeled as:
$$ k(T) = k_0 + \alpha T $$
where \( k_0 \) and \( \alpha \) are material constants. For simulation setup, the foam pattern (EPS) had a density of 25 kg/m³, with a specific heat of 3.7 kJ/(kg·K), latent heat of gasification of 100 kJ/kg, and thermal conductivity of 0.15 W/(m·K). The sand mold used resin-bonded sand with a density of 1520 kg/m³, specific heat of 1.22 kJ/(kg·K), thermal conductivity of 0.53 W/(m·K), and permeability of \(1 \times 10^{-7} \, \text{m}^2\) to account for gas evacuation—a vital factor in LFC simulations. Boundary conditions included a pouring temperature of 1420 °C, pouring rate of 20 kg/s, environmental temperature of 20 °C, and a vacuum pressure of 0.045 MPa. The heat transfer coefficient (h) at the metal-foam interface was dynamically adjusted based on distance, ranging from 20 W/(m²·K) at 10 mm separation to 250 W/(m²·K) upon contact.
Mesh generation was performed using Visual-Mesh within ProCAST. The domain was discretized into tetrahedral elements, with a minimum size of 5 mm near intricate liner features and a maximum of 100 mm in the sand zone. The total mesh counts were 1,352,871 for Process A, 1,575,216 for Process B, and 1,181,657 for Process C. This level of refinement ensures accuracy in capturing thermal gradients and fluid flow, which is essential for reliable defect prediction in a manganese steel casting foundry environment.
The filling process simulation revealed distinct flow characteristics for each gating design. In Process A (top-gating, 8 liners), molten metal began entering the liner cavities at 11.95 s (30% filled). However, the filling was uneven, with liners closer to the sprue filling faster. As filling progressed, gas generation from foam decomposition created a gap at the metal front, increasing resistance and causing turbulent flow in three liners by 29.62 s (70% filled). The final regions to fill were the bottoms of four liners at 44.90 s (90% filled). This turbulence can lead to entrapped gases and uneven temperature distribution, exacerbating defect formation. For Process B (stepped side-gating, 10 liners), filling started at 14.95 s (30% filled), but severe flow disorder occurred in two liners by 35.81 s (90% filled), with these areas being the last to fill. The stepped design intended to promote sequential filling but instead induced more pronounced turbulence due to complex gas dynamics. In contrast, Process C (side-gating with risers, 4 liners) exhibited smooth filling, commencing at 6.94 s (30% filled) and completing without turbulence by 27.72 s (90% filled). The reduced number of patterns per mold likely facilitated better gas evacuation, resulting in stable flow—a desirable trait in manganese steel casting foundry operations to ensure homogeneity.
Temperature distributions at the end of filling further highlighted process differences. Process A showed relatively uniform temperatures across liners, with a slight elevation in the last-filled ones. Process B displayed significant temperature variations, up to 50 °C between the first and last-filled liners, indicating poor thermal management. Process C maintained the most uniform temperature field, crucial for controlled solidification. These findings underscore the importance of gating design in achieving thermal consistency, a key consideration for any manganese steel casting foundry aiming to reduce scrap rates.
Solidification analysis focused on the sequence of phase change and the formation of isolated liquid regions. For all processes, solidification initiated at the liner surfaces and progressed inwards, characteristic of directional solidification. In Processes A and B, which lacked risers, the liners developed thermal hot spots at their cores, leading to isolated liquid pools that shrink upon freezing. Process C, with risers, provided some feeding to the core, but hot spots still formed, albeit less severely. The solid fraction evolution over time can be described by the energy equation:
$$ \rho c_p \frac{\partial T}{\partial t} = \nabla \cdot (k \nabla T) – \rho L \frac{\partial f_s}{\partial t} $$
where \( t \) is time. Solving this equation numerically allows tracking of the solid-liquid interface. The temperature gradients (G) and cooling rates (R) during solidification are critical for defect prediction. Table 2 summarizes comparative metrics for the three processes at the point of 70% solidification, derived from simulation outputs.
| Process | Number of Liners | Gating Type | Presence of Risers | Average Temperature Gradient, G (K/mm) | Average Cooling Rate, R (K/s) | Filling Turbulence |
|---|---|---|---|---|---|---|
| A | 8 | Top | No | 0.85 | 1.2 | Moderate |
| B | 10 | Stepped Side | No | 0.72 | 1.5 | Severe |
| C | 4 | Side | Yes | 1.10 | 0.9 | Minimal |
To quantitatively assess shrinkage defects, two criteria were applied: the proprietary POROS criterion and the widely used Niyama criterion. The POROS criterion predicts macro-shrinkage cavities based on volumetric contraction in isolated liquid zones, with values above 1% indicating defect formation. The Niyama criterion, more suited for micro-porosity, uses the ratio \( G/\sqrt{R} \) at the end of solidification; regions with values below a critical threshold (typically around 1 °C¹/²·mm⁻¹·s¹/² for steels) are prone to shrinkage porosity. The mathematical expression is:
$$ N_y = \frac{G}{\sqrt{R}} $$
where \( G \) is the temperature gradient in K/mm and \( R \) is the cooling rate in K/s. Lower \( N_y \) values correlate with higher porosity risk. Simulation results for defect prediction are consolidated in Table 3, highlighting the performance of each process from a foundry perspective.
| Process | POROS Criterion: Defect Location | Niyama Criterion: \( G/\sqrt{R} \) (Typical Min, °C¹/²·mm⁻¹·s¹/²) | Overall Defect Severity | Suitability for Manganese Steel Casting Foundry |
|---|---|---|---|---|
| A | Shrinkage concentrated in core of last-filled liners; some near-surface in middle liners | 0.65–0.95 (below critical) | High, with dispersed defects | Moderate, requires post-casting inspection |
| B | Severe shrinkage in all liners; defects near surface in middle six liners | 0.55–0.85 (below critical) | Very high, with surface defects | Poor, high rejection risk |
| C | Shrinkage localized to core regions; minimal near-surface defects | 1.05–1.30 (above critical) | Low to moderate | Excellent, optimal for quality-focused foundry |
For Process A, the POROS analysis indicated shrinkage cavities primarily in the cores of the four last-filled liners, with some tendency toward the surface in middle liners. The Niyama values ranged from 0.65 to 0.95 °C¹/²·mm⁻¹·s¹/², below the critical level, confirming a high propensity for micro-porosity. This dispersed defect distribution could compromise liner integrity, especially if defects approach the working surface. In Process B, both criteria predicted extensive defects, with POROS showing severe shrinkage across all liners and Niyama values as low as 0.55 °C¹/²·mm⁻¹·s¹/². Notably, the middle six liners exhibited defect locations close to the surface, which is detrimental for wear resistance—a critical property for components from a manganese steel casting foundry. Process C demonstrated the best performance: defects were confined to the core regions, with POROS values indicating limited macro-shrinkage and Niyama values between 1.05 and 1.30 °C¹/²·mm⁻¹·s¹/², mostly above the critical threshold. This suggests that micro-porosity is minimized, and any core defects are less likely to affect functional performance.
The superiority of Process C can be attributed to its balanced design. The side-gating system promotes laminar flow, reducing turbulence and associated gas entrapment. The inclusion of risers provides necessary feeding to compensate for solidification shrinkage, a fundamental principle in casting design. Moreover, casting only four liners per mold lowers the gas generation rate, allowing better evacuation through the sand mold. This aligns with best practices in a manganese steel casting foundry, where controlling the melt flow and solidification dynamics is essential for producing sound castings. The economic trade-off of lower productivity per mold is offset by higher yield and reduced rework, ultimately benefiting the foundry’s bottom line.
To validate the simulation findings, Process C was implemented in a production setting. The resulting castings, when sectioned through the core, revealed minimal internal defects, predominantly concentrated in the central regions as predicted. This correlation between simulation and actual outcomes underscores the reliability of finite element analysis as a tool for process optimization in a manganese steel casting foundry. It enables foundries to preemptively identify and rectify potential issues, saving time, material, and energy resources.
In conclusion, this simulation-based evaluation of three lost foam casting processes for high manganese steel liners demonstrates that gating design profoundly influences filling behavior, thermal uniformity, and defect formation. Process A (top-gating, 8 liners) and Process B (stepped side-gating, 10 liners) both exhibited turbulent filling and significant shrinkage defects, with Process B being particularly unfavorable due to surface-near porosity. Process C (side-gating with risers, 4 liners) provided smooth filling, controlled solidification, and defects localized to the core, making it the optimal choice for quality-critical applications. For a manganese steel casting foundry, adopting such a simulation-driven approach not only enhances product reliability but also streamlines process development, reinforcing the role of digital tools in modern manufacturing. Future work could explore variations in riser design, foam density, or vacuum levels to further refine the process, continuously advancing the capabilities of the manganese steel casting foundry industry.
The integration of finite element simulation into foundry practice represents a paradigm shift, allowing for precise control over complex casting processes. By leveraging criteria like POROS and Niyama, foundries can quantitatively assess defect risks and make informed decisions. This is especially valuable for high manganese steel, where traditional trial-and-error methods are costly and inefficient. As the demand for durable components like ball mill liners grows, the adoption of such technologies will become increasingly vital for maintaining competitiveness in the global manganese steel casting foundry sector.