
In modern manufacturing, the sand casting process is a fundamental method for producing metal components, widely used across industries such as automotive, aerospace, and machinery. However, sand casting is notoriously energy-intensive, with significant contributions to overall industrial energy consumption and environmental impact. As global emphasis on sustainability and carbon reduction grows, accurately modeling and optimizing energy use in sand casting has become a critical research focus. In this paper, I present a detailed methodology for modeling process energy consumption in sand casting based on Petri nets. This approach integrates activity-based costing principles with discrete-event simulation to capture the complex interactions between process activities, equipment, and resource consumption. By leveraging Petri nets’ graphical and analytical capabilities, this model enables a granular analysis of energy flows, facilitating targeted节能减排 strategies. The core innovation lies in defining process activities within sand casting, establishing their relationships with devices, and constructing an extended Petri net model that encapsulates energy consumption dynamics. Through this work, I aim to provide a robust tool for designers and engineers to assess and reduce energy usage in sand casting operations, ultimately supporting the transition toward low-carbon manufacturing.
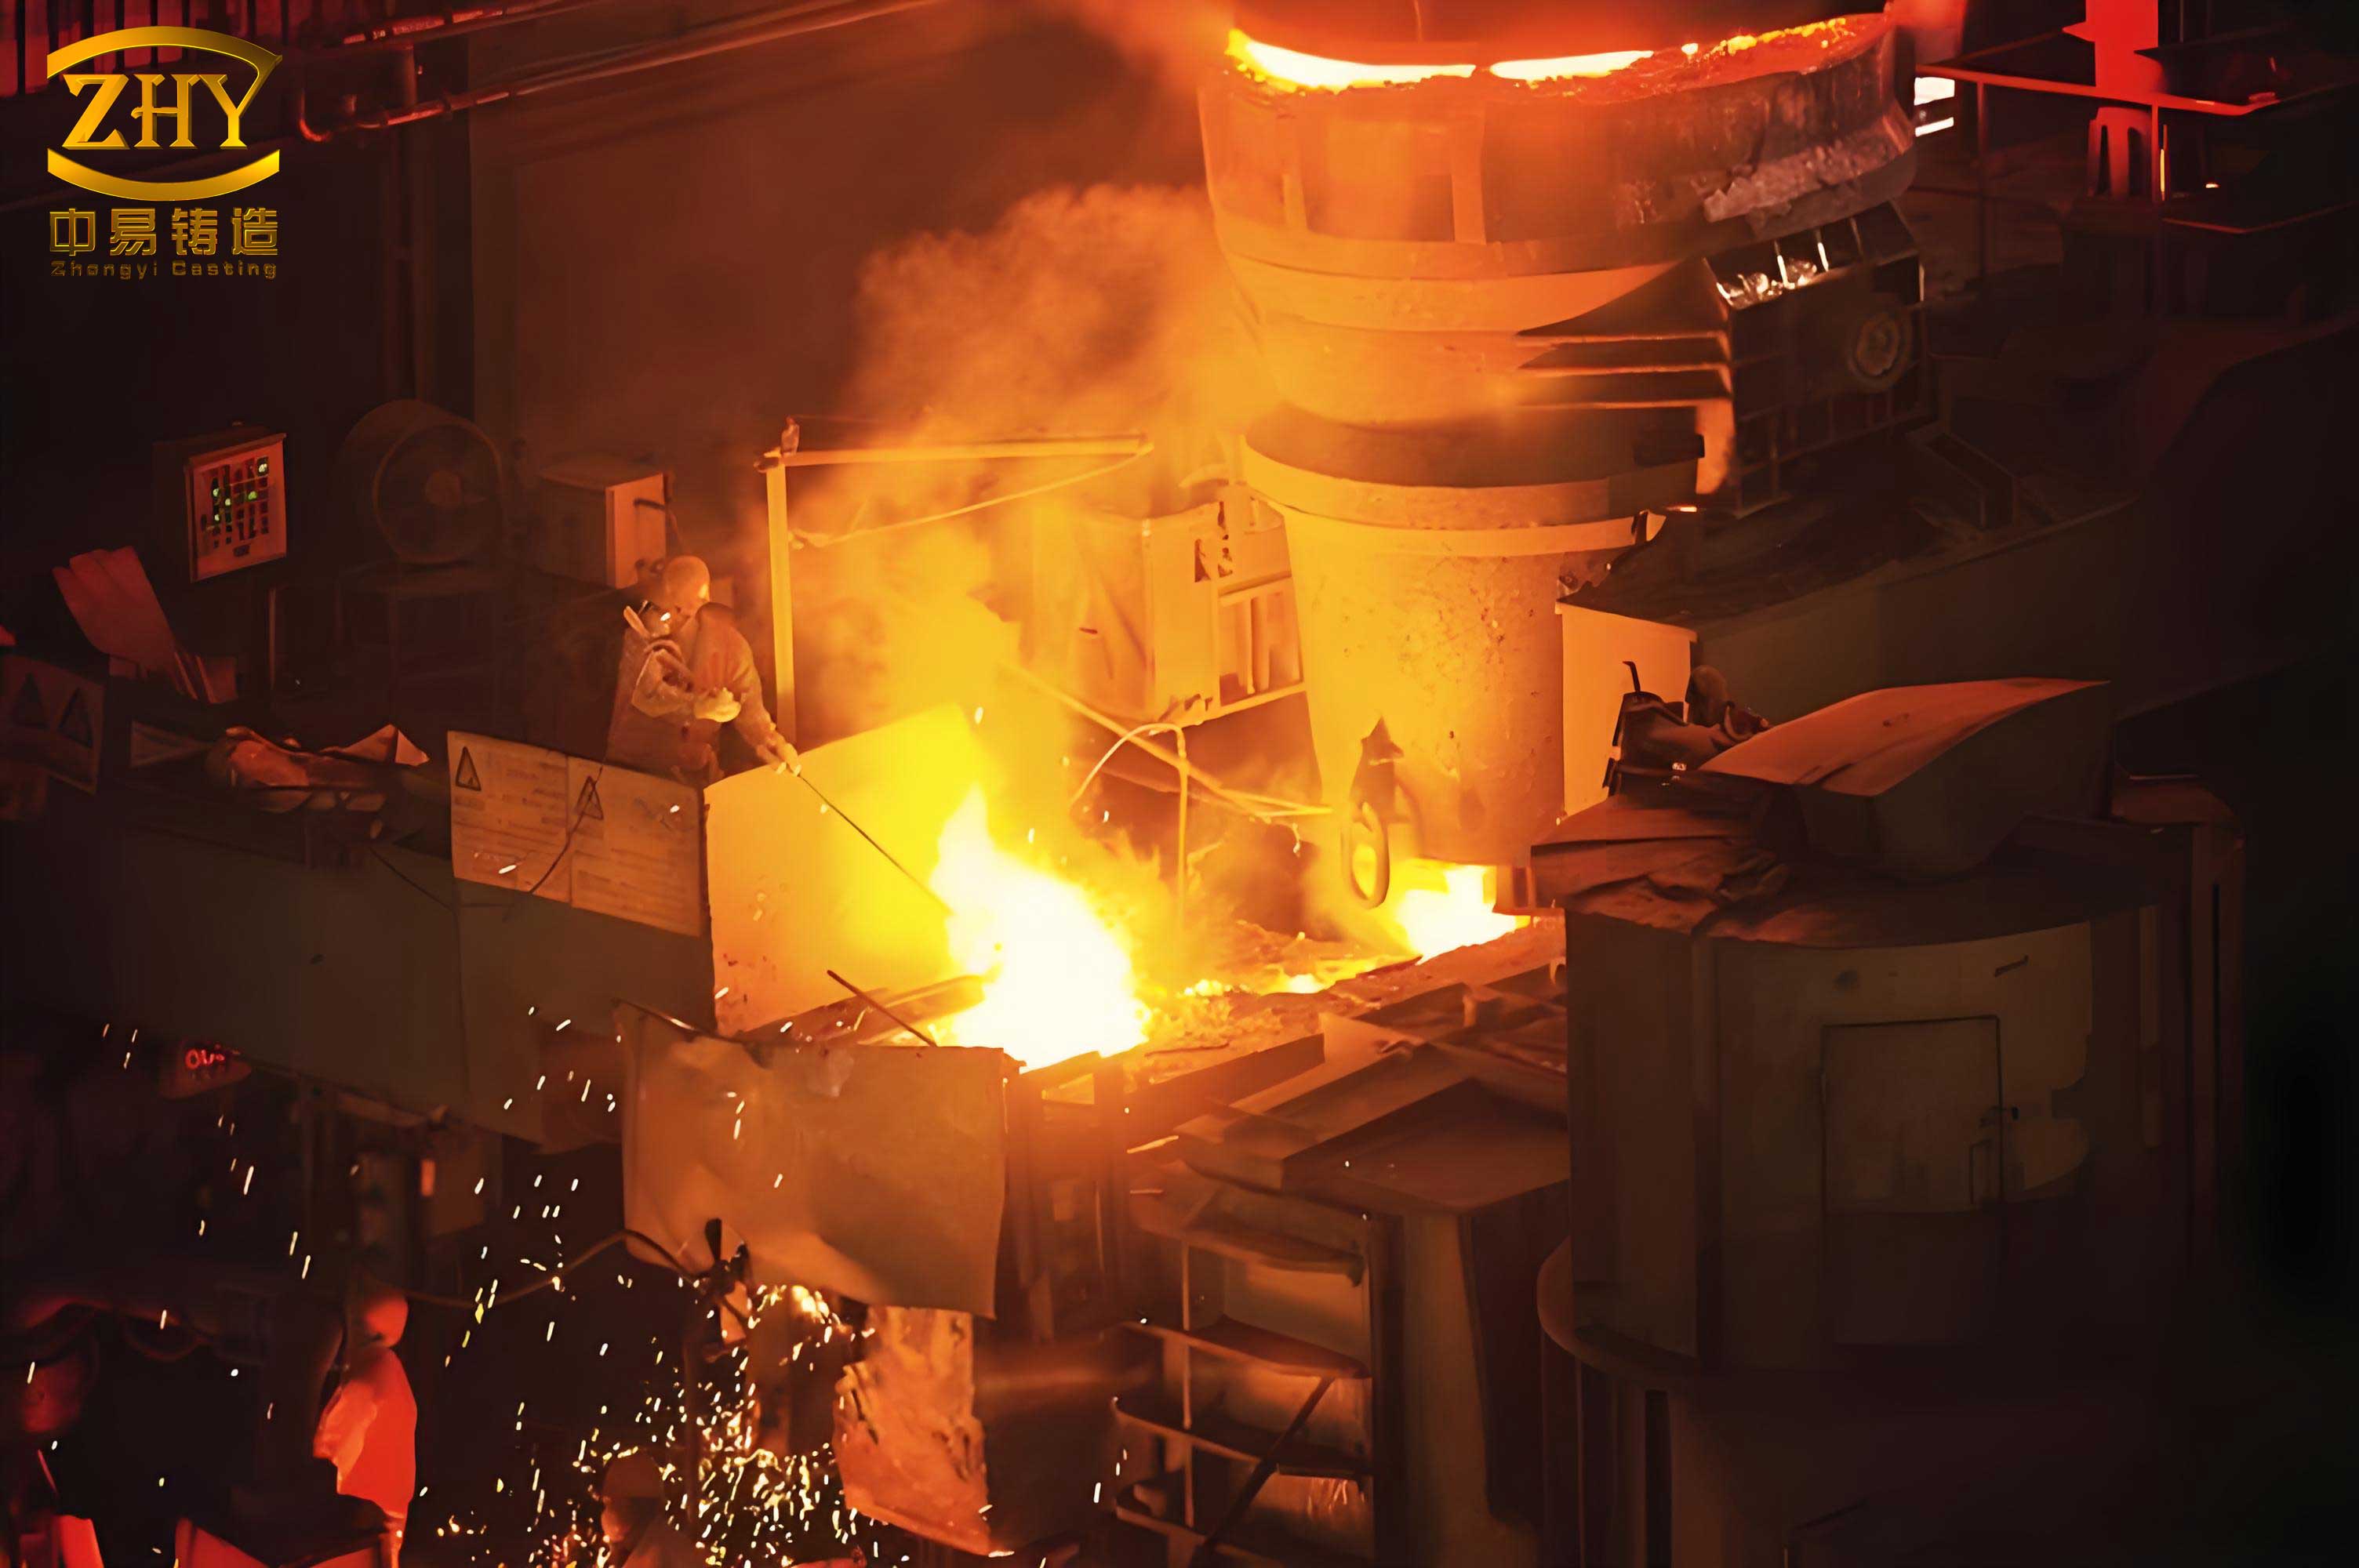
The sand casting process involves over 40 distinct steps, organized into major departments like melting, molding, core making, sand treatment, and cleaning. These departments exhibit both discrete and continuous characteristics, making energy consumption modeling challenging. Energy in sand casting is primarily consumed by various equipment, including furnaces, molding machines, and conveyors, using resources such as electricity, natural gas, coal, and water. The intermittent nature of operations—where devices alternate between active, idle, and standby states—further complicates energy assessment. Traditional methods often aggregate energy data at the departmental level, overlooking the nuanced effects of individual process activities. To address this, I propose an activity-centric view, where sand casting processes are decomposed into discrete process activities. Each activity represents a basic operational unit that consumes resources through associated equipment. This decomposition allows for precise energy attribution and identification of inefficiencies. In the following sections, I will elaborate on the energy consumption characteristics of sand casting, define the process activity model, develop a Petri net-based representation, derive energy calculation formulas, and demonstrate the model’s application through a case study on the molding department. Throughout, the term ‘sand casting’ will be emphasized to underscore its relevance in manufacturing systems.
Analysis of Energy Consumption Characteristics in Sand Casting
Sand casting energy consumption is influenced by the interplay between process sequences, equipment utilization, and resource types. The process can be viewed as a transformation of raw materials into castings through six key departments: melting, molding, core making, sand treatment, shakeout, and cleaning. Among these, departments like molding, core making, and sand treatment display discrete industrial traits, with activities such as filling, compacting, and curing occurring in distinct stages. Energy consumption varies dynamically over time, depending on production schedules and equipment states. For instance, a melting furnace may consume high power during active melting but lower power during preheating or tapping. To model this, it is essential to analyze equipment operating times, which directly correlate with energy use.
I define two primary time components relevant to energy consumption in sand casting: the process activity工作时间 (denoted as $t_a$) and the device运行时间 (denoted as $t_s$). The device运行时间 encompasses all states a device undergoes during operation, including startup, preparation, active processing, idle pauses, and shutdown. Mathematically, for a device involved in multiple activity cycles, the total运行时间 can be expressed as:
$$ t_s = \sum_{i=1}^{n} (t_{s,r}^i + t_{s,p}^i + t_{s,o}^i) $$
Here, $t_{s,r}^i$ represents the preparation time for the $i$-th cycle, $t_{s,p}^i$ is the active processing time, and $t_{s,o}^i$ is the idle or pause time. The index $i$ counts the number of cycles from startup to shutdown. This breakdown is crucial because energy consumption rates differ across states; e.g., a device may draw lower power during idle phases compared to active processing. By linking these time segments to specific process activities, we can allocate energy consumption more accurately. For example, in sand casting melting, the activity of ‘melting start to end’ corresponds to $t_{s,p}$, while ‘furnace preparation’ aligns with $t_{s,r}$. Understanding these relationships is the foundation for the activity-based model.
Process Activity Model for Sand Casting
To bridge the gap between high-level process descriptions and detailed energy accounting, I introduce the concept of a process activity in sand casting. A process activity is defined as a fundamental action that executes a step within a sand casting process. It is characterized by its duration, associated equipment, and resource inputs. Let $S(A) = \{A_1, A_2, \dots, A_n\}$ denote the set of all process activities in a sand casting system, where each $A_i$ corresponds to a unique activity like ‘sand filling’ or ‘mold drying’. Each activity $A_i$ is formally represented as a tuple: $A_i = \{t_a^i, De_i\}$, where $t_a^i$ is the activity工作时间 and $De_i$ is the specific device involved.
The determination of process activities depends on several factors, such as equipment usage, functional coherence, sequence constraints, and time duration. Using hierarchical analysis, these factors can be weighted to identify key influences. Define an influence factor vector $U_{\text{factor}}$ as:
$$ U_{\text{factor}} = ((U_{N1}, U_{W1}), (U_{N2}, U_{W2}), \dots, (U_{Nj}, U_{Wj})) $$
where $U_{Nk}$ is the factor name (e.g., ‘equipment’ or ‘sequence’) and $U_{Wk}$ is its weight, with $U_{W1} \geq U_{W2} \geq \dots \geq U_{Wj}$. Weights can be derived using methods like fuzzy Delphi analytical hierarchy process. In sand casting, equipment and process sequence often emerge as dominant factors, guiding the aggregation of granular steps into larger activity units. This aggregation enhances model manageability without sacrificing accuracy.
The relationship between process activities and devices is multifaceted. Let $U_{\text{device}} = \{De_1, De_2, \dots, De_j\}$ be the set of all devices in a sand casting facility. The association between activities and devices is captured by a relation set $R_{A\text{-Device}} = \{R_0, R_1\}$, where $R_0$ indicates no relation and $R_1$ indicates a relation. When an activity $A_i$ requires device $De_j$, we denote this as $A_i \rightarrow De_j$. The strength of this relation is quantified by the activity工作时间 on that device. In cases where multiple activities share a device, the strength can be apportioned based on time shares. For instance, if activities $A_1, A_2, \dots, A_m$ all utilize device $De_j$ with times $t_a^1, t_a^2, \dots, t_a^m$, the energy contribution of $De_j$ to activity $A_k$ is proportional to $t_a^k / \sum_{i=1}^m t_a^i$. This proportional allocation underpins the energy calculation model discussed later.
Petri Net-Based Model for Energy Consumption in Sand Casting
Petri nets offer a powerful formalism for modeling concurrent, asynchronous systems, making them ideal for representing the discrete aspects of sand casting processes. I extend the basic Petri net to create a dedicated model for energy consumption analysis. The model is defined as a tuple:
$$ G = (P, T, I, O, K, W, M_0, D) $$
where:
- $P$ is a finite set of places, categorized into six types: process activity places $P_a$, device places $P_d$, energy resource places $P_e$, material places $P_m$, pollutant places $P_p$, and other places $P_o$.
- $T$ is a finite set of transitions, representing events like the start or completion of an activity.
- $I$ and $O$ are input and output functions, respectively.
- $K$ is a capacity function for places.
- $W$ is an arc weight function, denoting resource consumption or emission quantities.
- $M_0$ is the initial marking.
- $D$ is a set of time delays associated with places and transitions.
The arc weight function $W$ is critical for encoding energy flows. Specific definitions include:
- $W(p_d, t)$: Represents the idle time of a device at place $p_d$ when transition $t$ is enabled, i.e., $W(p_d, t) = t_{s,o}$.
- $W(t, p_d)$: Represents the preparation time of a device, i.e., $W(t, p_d) = t_{s,r}$.
- $W(p_e, t)$: Represents the consumption quantity of an energy resource (e.g., electricity) from place $p_e$ during transition $t$.
- $W(p_m, t)$: Represents the consumption quantity of a material from place $p_m$ during transition $t$.
- $W(t, p_p)$: Represents the emission quantity of a pollutant to place $p_p$ after transition $t$.
A directed arc from a process activity place $p_a$ to a transition $t$ signifies a sand casting process step. The model $G$ graphically depicts how activities trigger device usage, consume energy and materials, and generate emissions. For example, a transition $t$ firing might correspond to the ‘compact sand’ activity, drawing electricity from an energy place, operating a molding machine from a device place, and emitting dust to a pollutant place. The state evolution via token flow allows simulation of dynamic energy consumption over time.
From $G$, we can derive process activity sequences and transition sequences. Let $s_{pr} = \{p_{a1}, p_{a2}, \dots, p_{ar}\}$ be a sequence of process activity places, and $s_r = \{t_1, t_2, \dots, t_r\}$ be the corresponding transition sequence from initial marking $M_0$ to marking $M_r$. The relation between a transition $t$ and various places can be captured in matrices, such as $R_{tp_a}$ for activity places, $R_{tp_d}$ for device places, etc. These matrices facilitate automated extraction of energy-related parameters during analysis.
Energy Consumption Calculation Model Based on the Petri Net Framework
Building on the Petri net model $G$, I now formulate a computational method for quantifying energy consumption in sand casting. The primary energy source considered is electricity, though the model can be extended to other resources. Let there be $m$ process activities and $n$ devices. Each activity $A_i$ may involve one or more devices. For activities that exclusively use a single device, the energy consumption $ES_{A_i}$ is straightforward:
$$ ES_{A_i} = \sum_{j=1}^{n} t_{a}^{ij} \cdot Q_j $$
where $t_{a}^{ij}$ is the工作时间 of activity $A_i$ on device $De_j$, and $Q_j$ is the energy consumption rate of device $De_j$ per unit time. However, when multiple activities share a device, energy must be apportioned based on time shares. Suppose activities $A_1, A_2, \dots, A_n$ all use device $De_j$ with times $t_{a}^1, t_{a}^2, \dots, t_{a}^n$. The energy consumed by activity $A_k$ due to device $De_j$ is:
$$ ED_{A_k} = \frac{t_{a}^k}{\sum_{i=1}^{n} t_{a}^i} \cdot Q_j $$
Thus, the total energy consumption for a sand casting process encompassing all activities is:
$$ E_{pa} = \sum_{i=1}^{m} ES_{A_i} + \sum_{k=1}^{m} ED_{A_k} = \sum_{i=1}^{m} \left( \sum_{j=1}^{n} t_{a}^{ij} Q_j \right) + \sum_{k=1}^{m} \left( \sum_{j=1}^{n} \frac{t_{a}^k}{\sum_{i=1}^{n} t_{a}^i} Q_j \right) $$
To incorporate device state-specific power rates, let $Pr_{pd}$, $Pp_{pd}$, and $Po_{pd}$ denote the average power of a device during preparation, active processing, and idle states, respectively. The times for these states are $t_{s,r}$, $t_{s,p}$, and $t_{s,o}$. The energy calculation becomes more detailed:
$$ E_{pa} = \sum_{i=1}^{m} \left( Pr_{pd_i} t_{s,r}^i + Pp_{pd_i} t_{s,p}^i + Po_{pd_i} t_{s,o}^i \right) + \sum_{k=1}^{m} \left( Pr_{pd_k} \frac{t_{s,r}^k}{\sum_{i=1}^{m} t_{s,r}^i} + Pp_{pd_k} \frac{t_{s,p}^k}{\sum_{i=1}^{m} t_{s,p}^i} + Po_{pd_k} \frac{t_{s,o}^k}{\sum_{i=1}^{m} t_{s,o}^i} \right) $$
This formula accounts for both exclusive and shared device usage across all states, providing a comprehensive energy footprint for sand casting operations. It enables pinpointing high-consumption activities and devices, guiding optimization efforts.
Application Case Study: Molding Department in Sand Casting
To validate the proposed model, I apply it to the molding department of a sand casting facility. Molding involves steps like sand filling, compaction, drying, pattern removal, core setting, and mold assembly. Based on equipment and sequence factors, I define six process activities: molding activity ($A_1$), drying activity ($A_2$), pattern removal and flipping activity ($A_3$), mold closing activity ($A_4$), auxiliary handling activity ($A_5$), and core setting activity ($A_6$). Corresponding devices include molding machines, dryers, pattern removers, conveyors, etc.
Using the Petri net model $G$, I construct a network for the molding department. Places and transitions are defined per the earlier categories. For brevity, key parameters are summarized in the table below, which lists devices, their average power, and active processing times for typical cycles.
| Device Place Symbol | Device Description | Average Power (kW) | Active Processing Time (hours) |
|---|---|---|---|
| $p_{d1}$ | Molding Machine | 21 | 0.260 |
| $p_{d2}$ | Drying Machine | 9 | 0.100 |
| $p_{d3}$ | Pattern Remover | 6 | 0.015 |
| $p_{d4}$ | Mold Flipper | 4 | 0.015 |
| $p_{d5}$ | Conveyor System | 6 | Variable (see text) |
| $p_{d6}$ | Mold Closer | 4 | 0.015 |
| $p_{d7}$ | Pushing Device | 5 | 0.015 |
| $p_{d8}$ | Environmental Control | 12 | 0.350 |
| $p_{d9}$ | Core Setter | 2 | 0.020 |
For this case, I assume negligible startup times and focus on active and idle states. The energy consumption for exclusive activities ($ES_{pa}$) is computed first:
$$ ES_{A_1} = Pp_{pd1} \cdot t_{s,p}^{pd1} + Pp_{pd8} \cdot t_{s,p}^{pd8} = 21 \times 0.260 + 12 \times 0.350 = 9.66 \text{ kW} $$
$$ ES_{A_2} = 9 \times 0.100 = 0.90 \text{ kW} $$
$$ ES_{A_3} = 6 \times 0.015 = 0.09 \text{ kW} $$
$$ ES_{A_4} = 4 \times 0.015 = 0.06 \text{ kW} $$
$$ ES_{A_6} = 4 \times 0.015 + 2 \times 0.020 = 0.10 \text{ kW} $$
$$ ES_{pa} = 9.66 + 0.90 + 0.09 + 0.06 + 0.10 = 10.81 \text{ kW} $$
Note: $ES_{pa}$ here sums exclusive activities; auxiliary activity $A_5$ is handled separately as it shares devices. The auxiliary activity $A_5$ involves conveyor operations between other activities. It is invoked three times: between $A_1$ and $A_2$, $A_2$ and $A_3$, and $A_3$ and $A_4$. The conveyor has idle times and active times for each segment. Data: idle times are 0.035 h, 0.025 h, and 0.03 h; active times are 0.1 h, 0.15 h, and 0.08 h. The conveyor’s average active power $Pp_{pd5} = 6$ kW and idle power $Po_{pd5} = 3.5$ kW. Using the apportionment formula:
For segment $A_1 \rightarrow A_2$:
$$ ED_{1} = 3.5 \times \frac{0.035}{0.035+0.025+0.03} + 6 \times \frac{0.1}{0.1+0.15+0.08} = 3.5 \times 0.389 + 6 \times 0.303 = 1.36 + 1.82 = 3.18 \text{ kW} $$
For segment $A_2 \rightarrow A_3$:
$$ ED_{2} = 3.5 \times \frac{0.025}{0.09} + 6 \times \frac{0.15}{0.33} = 0.97 + 2.73 = 3.70 \text{ kW} $$
For segment $A_3 \rightarrow A_4$:
$$ ED_{3} = 3.5 \times \frac{0.03}{0.09} + 6 \times \frac{0.08}{0.33} = 1.17 + 1.45 = 2.62 \text{ kW} $$
Total for auxiliary activity: $ED_{pa} = 3.18 + 3.70 + 2.62 = 9.50 \text{ kW}$.
Overall energy for the molding department:
$$ E = ES_{pa} + ED_{pa} = 10.81 + 9.50 = 20.31 \text{ kW} $$
To visualize the distribution, the table below compares energy consumption across activities.
| Process Activity | Energy Consumption (kW) | Percentage of Total |
|---|---|---|
| Molding Activity ($A_1$) | 9.66 | 47.6% |
| Drying Activity ($A_2$) | 0.90 | 4.4% |
| Pattern Removal & Flipping ($A_3$) | 0.09 | 0.4% |
| Mold Closing ($A_4$) | 0.06 | 0.3% |
| Auxiliary Handling ($A_5$) | 9.50 | 46.8% |
| Core Setting ($A_6$) | 0.10 | 0.5% |
| Total | 20.31 | 100% |
This analysis reveals that molding and auxiliary activities dominate energy use, accounting for over 94% of consumption. Such insights are invaluable for prioritizing节能减排 measures in sand casting. For instance, optimizing conveyor scheduling or upgrading molding machines could yield significant savings. The Petri net model effectively captures these nuances, demonstrating its practicality for energy assessment in sand casting.
Extended Discussion and Model Generalization
The proposed Petri net-based model is not limited to the molding department; it can be extended to entire sand casting plants, encompassing melting, core making, and other departments. Each department can be modeled as a subnet within a larger Petri net, with interfaces defined via shared resources or buffer places. This scalability allows plant-wide energy optimization. Moreover, the model can incorporate stochastic elements, such as variable activity durations or equipment failures, by introducing timed transitions with probability distributions. This would enable Monte Carlo simulations for robust energy forecasting under uncertainty.
Another extension involves integrating carbon emission factors. Since energy consumption often correlates with carbon footprint, the arc weight function $W$ can be augmented to include CO$_2$ equivalents per unit energy. For example, if electricity has an emission factor of $\alpha$ kg CO$_2$/kWh, the carbon output for an activity can be calculated as $E_{pa} \times \alpha$. This aligns with growing needs for carbon accounting in manufacturing, particularly in energy-intensive processes like sand casting.
To further illustrate the model’s versatility, consider a scenario with multiple product types in sand casting. Different castings may require distinct process sequences or device settings. The Petri net can accommodate this by defining product-specific tokens and conditional transitions. Energy consumption can then be analyzed per product, aiding in eco-design and process planning. Tables below summarize key formulas and matrix relations derived from the model.
| Formula Name | Expression | Description |
|---|---|---|
| Device Total Time | $t_s = \sum_{i=1}^{n} (t_{s,r}^i + t_{s,p}^i + t_{s,o}^i)$ | Total operating time across cycles |
| Exclusive Activity Energy | $ES_{A_i} = \sum_{j} t_{a}^{ij} Q_j$ | Energy for activities using devices exclusively |
| Shared Device Energy Apportionment | $ED_{A_k} = \frac{t_{a}^k}{\sum_i t_{a}^i} Q_j$ | Energy allocation for shared devices |
| Comprehensive Energy Total | $E_{pa} = \sum_i ES_{A_i} + \sum_k ED_{A_k}$ | Overall process energy consumption |
| State-Based Energy Formula | $E_{pa} = \sum_i (Pr_{pd_i} t_{s,r}^i + Pp_{pd_i} t_{s,p}^i + Po_{pd_i} t_{s,o}^i) + \sum_k (Pr_{pd_k} \frac{t_{s,r}^k}{\sum_i t_{s,r}^i} + \dots)$ | Detailed formula including device states |
| Matrix | Dimensions | Sample Entries (Binary or Weighted) | Purpose |
|---|---|---|---|
| $R_{tp_a}$ (Activity Places) | m × r | 1 if transition t involves activity place p_a | Map transitions to activities |
| $R_{tp_d}$ (Device Places) | n × r | Weight = preparation or idle time | Link transitions to device usage |
| $R_{tp_e}$ (Energy Places) | e × r | Weight = energy consumption quantity | Track energy input per transition |
| $R_{tp_m}$ (Material Places) | mat × r | Weight = material consumption quantity | Track material input per transition |
| $R_{tp_p}$ (Pollutant Places) | p × r | Weight = emission quantity | Track emissions per transition |
These tables encapsulate the core mathematical tools for implementing the model in software systems. By automating matrix computations, energy analyses can be performed rapidly for various sand casting configurations.
Conclusion
In this paper, I have developed a comprehensive Petri net-based model for calculating process energy consumption in sand casting. The model starts by decomposing sand casting into discrete process activities, each tied to specific devices and time parameters. By extending Petri nets to include energy, device, material, and pollutant places, along with weighted arcs representing consumption and emissions, the model provides a graphical and analytical framework for simulating energy flows. The derived calculation formulas handle both exclusive and shared device usage, incorporating device state power variations to ensure accuracy. Application to a sand casting molding department demonstrated the model’s feasibility, highlighting high-consumption activities like molding and auxiliary handling that offer prime targets for energy savings.
The advantages of this approach are manifold. It offers granular insights into energy use at the activity level, supports “what-if” scenario analysis for process improvements, and can be integrated with broader manufacturing execution systems. Future work will focus on enhancing the model with real-time data integration, expanding it to cover full sand casting plants, and incorporating economic and environmental indicators for holistic sustainability assessment. As industries strive for greener practices, such models will be instrumental in transforming energy-intensive processes like sand casting into more efficient and sustainable operations. The repeated emphasis on sand casting throughout this paper underscores its significance as a domain where advanced modeling can yield substantial benefits.