
In my extensive experience within the foundry industry, I have witnessed the transformative impact of numerical simulation on the production of complex sand castings. The traditional approach to designing sand gravity casting processes was inherently reliant on the empirical knowledge of engineers and iterative, costly trial-and-error methods involving pattern modifications. This often resulted in protracted development cycles, significant material waste, and inconsistent quality for new sand castings. The advent and maturation of computer simulation technologies have fundamentally changed this paradigm, enabling a more scientific, efficient, and predictive methodology for sand casting design. This article details my practical application and exploration of three-dimensional casting simulation software, specifically focusing on its role in designing and optimizing processes for large-scale sand castings produced via gravity pouring.
The core physical phenomena occurring during the pouring and solidification of sand castings are governed by the fundamental laws of conservation. The flow of molten metal, a fluid with a free surface, through the intricate cavity of a sand mold involves complex interactions of mass, momentum, and energy transfer with the mold material and the surrounding air. To simulate this accurately, the software solves a coupled system of partial differential equations. The fluid flow is described by the Navier-Stokes equations, which account for inertia, viscosity, and pressure forces. Simultaneously, heat transfer is governed by the Fourier equation, extended to include the latent heat released during the phase change from liquid to solid. The coupling is crucial because the fluid flow influences temperature distribution, and the cooling rate affects the fluid’s viscosity and ultimately its flow behavior.
The generalized form of the momentum conservation (Navier-Stokes) for an incompressible fluid can be expressed as:
$$
\rho \left( \frac{\partial \mathbf{v}}{\partial t} + \mathbf{v} \cdot \nabla \mathbf{v} \right) = -\nabla p + \mu \nabla^2 \mathbf{v} + \rho \mathbf{g}
$$
where $\rho$ is the fluid density, $\mathbf{v}$ is the velocity vector, $t$ is time, $p$ is pressure, $\mu$ is the dynamic viscosity, and $\mathbf{g}$ is the gravitational acceleration vector. The energy conservation equation, incorporating latent heat, is:
$$
\rho c_p \frac{\partial T}{\partial t} + \rho c_p \mathbf{v} \cdot \nabla T = \nabla \cdot (k \nabla T) + \dot{Q}_L
$$
Here, $c_p$ is the specific heat capacity, $T$ is temperature, $k$ is thermal conductivity, and $\dot{Q}_L$ is the volumetric latent heat source term associated with solidification. For sand castings, the boundary conditions at the metal-mold interface are critical, involving heat transfer coefficients that model the air gap formation.
A paramount objective in simulating sand castings is the prediction of shrinkage defects—macro-porosity and micro-porosity (shrinkage). These defects form in isolated liquid pools, or hot spots, that cannot be fed with molten metal during the final stages of solidification. The software employs various criteria functions to predict these defects. One widely used criterion for steel sand castings is the Niyama criterion. It establishes a relationship between the local thermal conditions at the end of solidification and the likelihood of shrinkage porosity formation. The Niyama value $N$ is calculated as:
$$
N = \frac{G}{\sqrt{\dot{T}}}
$$
where $G$ is the temperature gradient (in K/m) and $\dot{T}$ is the cooling rate (in K/s). Regions where the computed $N$ value falls below a critical threshold (often around 1 K1/2·s1/2·m-1 for cast steels) are flagged as potential shrinkage porosity sites. This criterion has proven highly effective for predicting centerline shrinkage in sand castings.
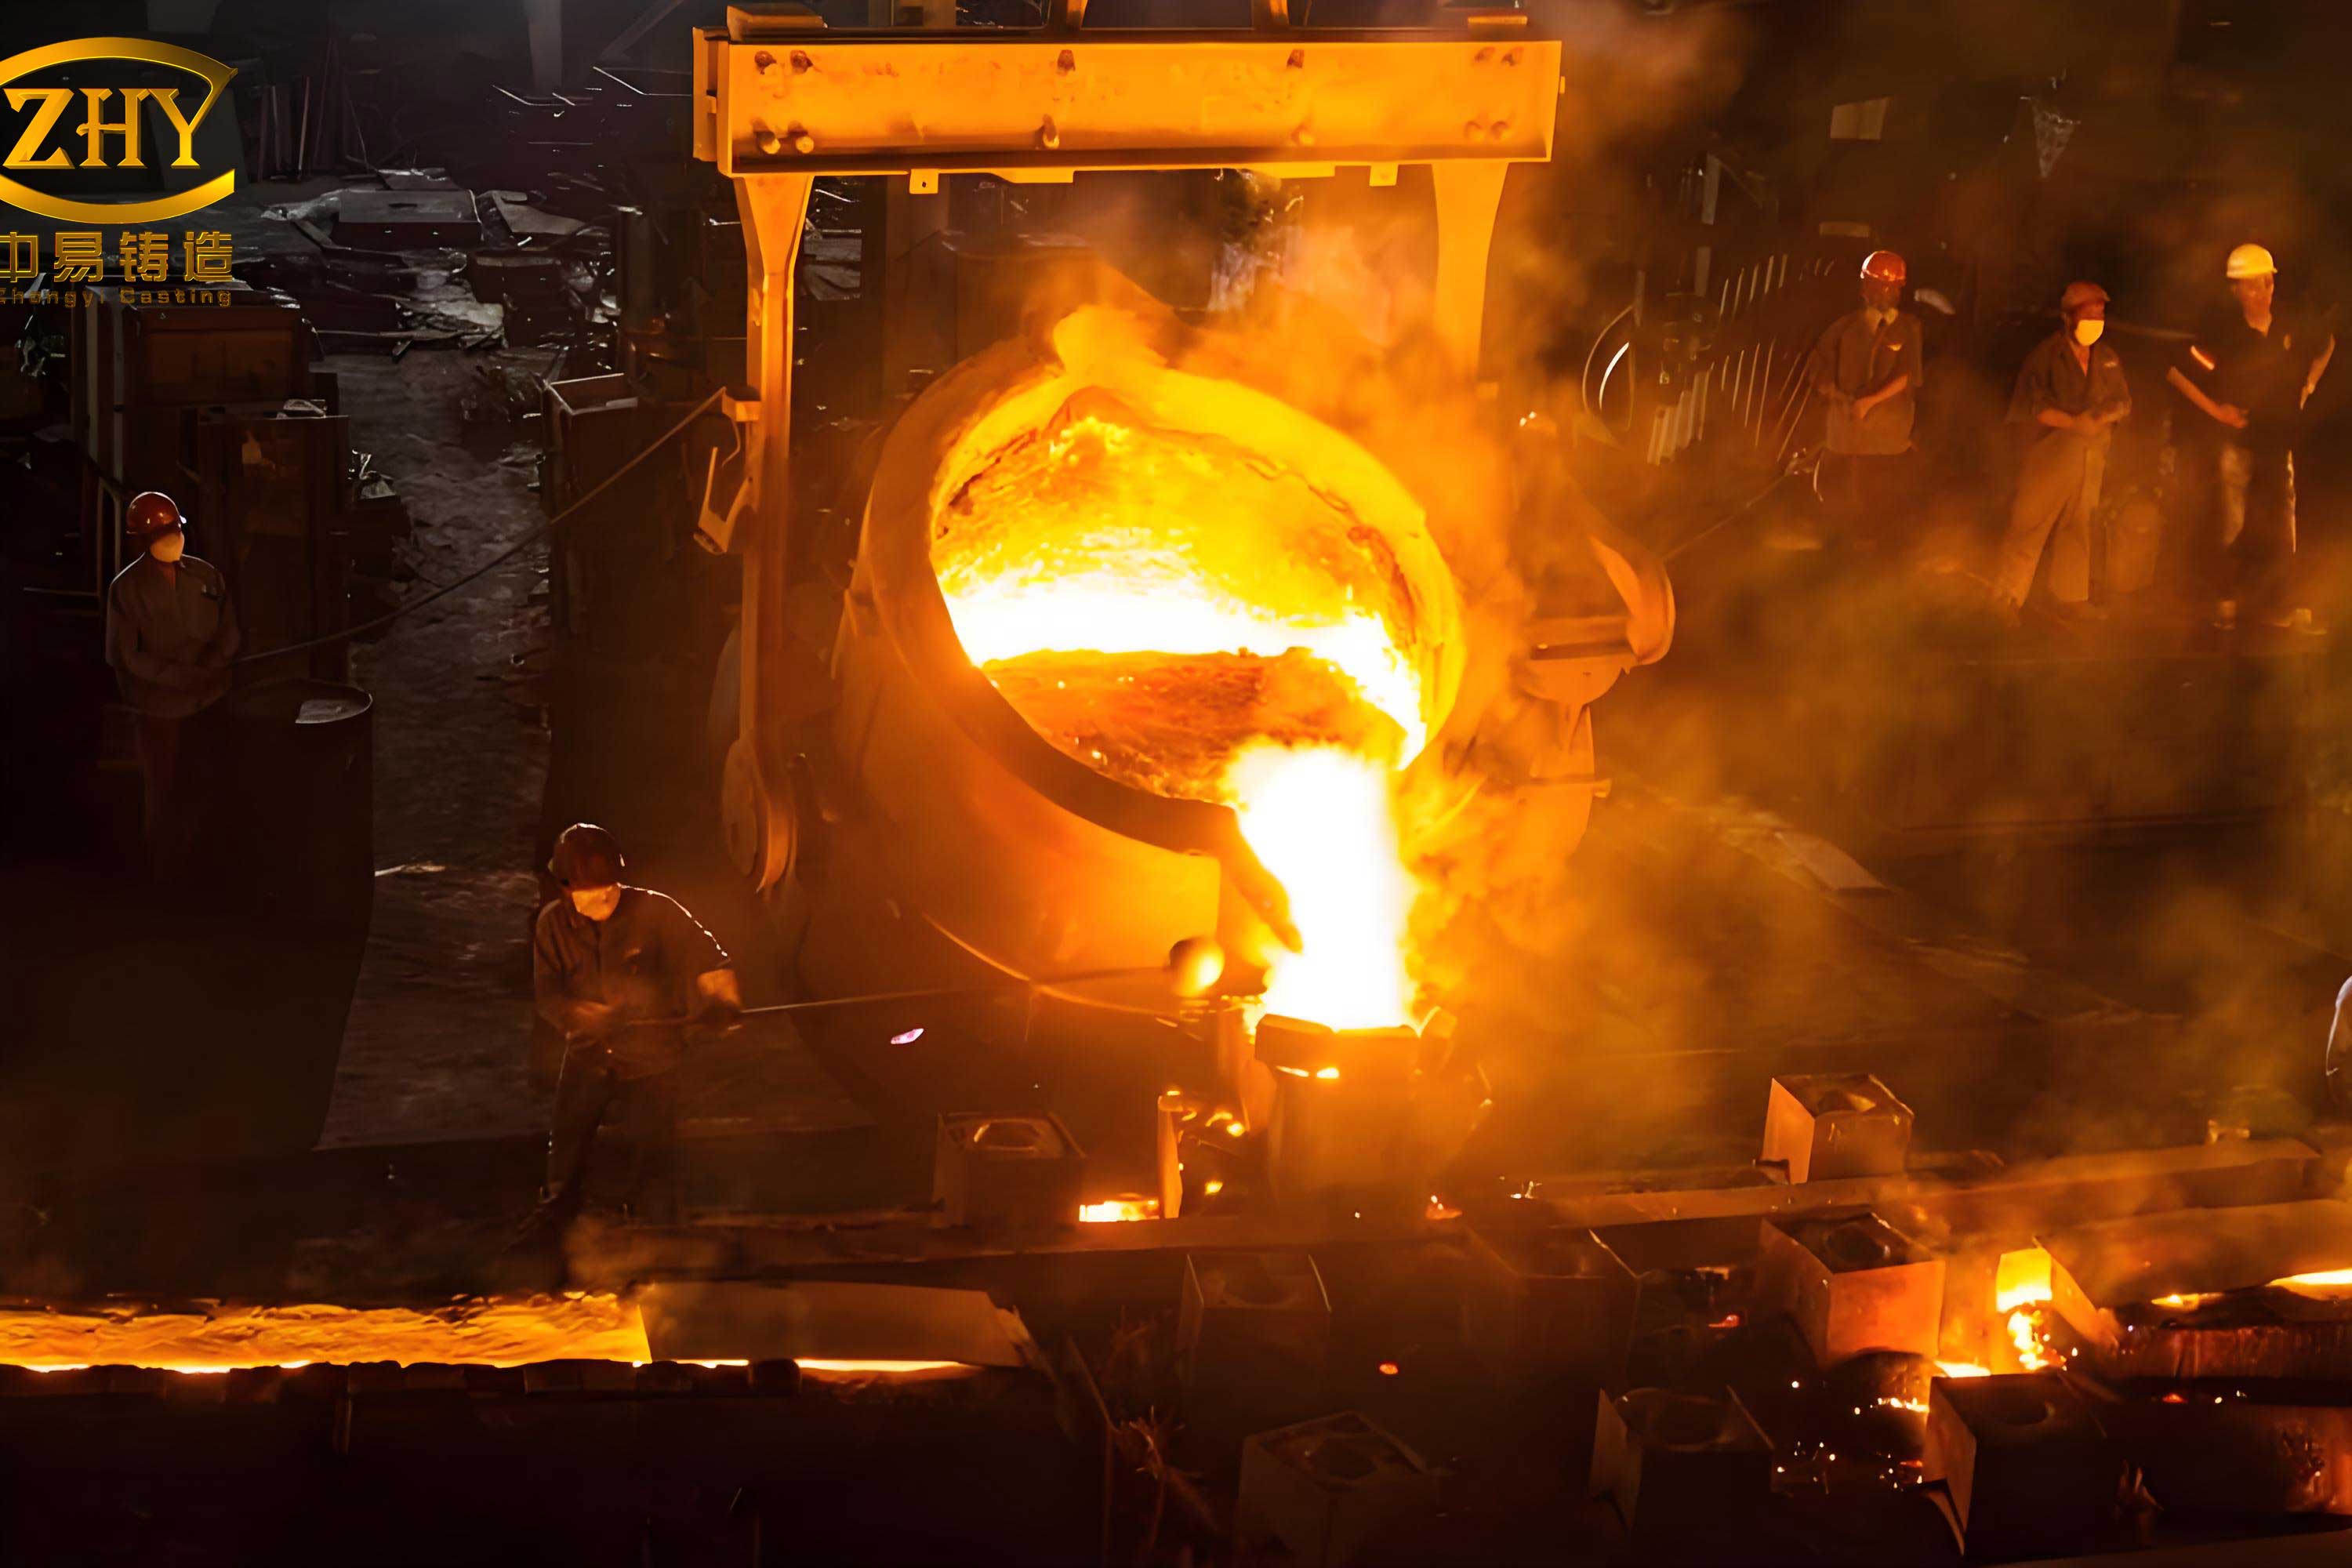
To illustrate the practical workflow, I will delve into a detailed case study involving a large valve body produced as a sand casting. The component was a massive steel casting with a finished weight of approximately 7.12 metric tons. The material specified was a heat-resistant cast steel, ZG35Cr26Ni12. The chemical composition of this alloy, which is crucial for setting up accurate material properties in the simulation, is summarized in the table below.
| Element | C | Si | Mn | Cr | Ni | S | P | Fe |
|---|---|---|---|---|---|---|---|---|
| Content (wt.%) | ~0.35 | ~2.00 | ~2.00 | ~26.00 | ~12.00 | ≤0.04 | ≤0.04 | Balance |
The first step in the digital process was importing the 3D CAD model of the valve body, saved in STL format, into the simulation preprocessor. A critical early decision was determining the optimal pouring orientation for this sand casting. Two distinct orientation schemes were evaluated computationally. Scheme 1 positioned the major flanges horizontally, while Scheme 2 oriented them vertically. The primary evaluation metric was the location and concentration of thermal hot spots, which are precursors to shrinkage defects.
The initial solidification simulation for both schemes, run without any gating or feeding system, provided clear insights. Scheme 1 resulted in several dispersed hot spots across the casting body. In contrast, Scheme 2 showed a more consolidated hot spot region near the top of the casting, specifically around two protruding nozzle sections. Although both orientations presented challenges, Scheme 2 was selected because concentrated hot spots are generally easier and more efficient to feed using well-placed risers, simplifying the overall feeding system design for this sand casting. The table below contrasts the two initial schemes.
| Scheme | Orientation Description | Hot Spot Characteristics | Assessment |
|---|---|---|---|
| 1 | Major flanges horizontal | Multiple, dispersed hot spots | Complex feeding required; less favorable. |
| 2 | Major flanges vertical | Consolidated hot spots at top nozzles | Simpler, localized feeding possible; selected. |
With the orientation fixed, the next phase was designing the feeding system—risers and gating. The simulation software’s integrated feeding module is invaluable for this task. Based on the modulus method and accounting for a solidification shrinkage of approximately 5% for this steel, the software recommended riser dimensions to effectively feed the identified hot spots. Two separate risers were designed: one elongated (elliptical) top riser for the larger hot spot volume and one circular top riser for the secondary region.
| Riser Type | Designed Dimensions (mm) | Calculated Modulus (mm) | Function |
|---|---|---|---|
| Elliptical Top Riser | Diameter: 510, Length: 760, Height: 640 | ~102.3 | Feed primary hot spot (Volume ~43.8 x 106 mm³) |
| Circular Top Riser | Diameter: 640, Height: 640 | ~104.3 | Feed secondary hot spot (Volume ~64.9 x 103 mm³) |
The gating system was designed to ensure a calm, controlled fill to minimize turbulence and oxide formation, which is especially important for high-alloy sand castings. A pressurized system was chosen with two downsprues, four runner bars, and eight ingates. The dimensions were calculated to achieve a desired fill time and velocity profile.
| Component | Quantity | Cross-Section Shape & Dimensions (mm) | Purpose |
|---|---|---|---|
| Downsprue | 2 | Circular, Ø70 | Deliver metal from pouring basin to runner system. |
| Runner | 4 | Trapezoidal, Top:50, Bottom:55, Height:45 | Distribute metal evenly to the ingates. |
| Ingate | 8 | Circular, Ø50 | Introduce metal into the mold cavity at controlled points. |
The complete system—casting, risers, and gating—was meshed with a finite element grid suitable for coupled fluid flow and heat transfer analysis. The initial simulation run encompassed the full pour and solidification sequence. The results for the solidification phase and defect prediction were revealing. While the risers successfully fed the main top hot spots, the Niyama criterion prediction highlighted a new issue: a band of micro-shrinkage (porosity) was predicted around the lower circumferential flange of the valve body. This occurred because this thicker section, though not an obvious hot spot initially, solidified last in its local area, creating isolated liquid pools. The table below summarizes the defect prediction from the first full simulation.
| Defect Type | Predicted Location | Severity (Niyama Value) | Probable Cause |
|---|---|---|---|
| Macro-shrinkage | Inside the two top risers | N/A (Desired location) | Shrinkage directed into risers as intended. |
| Micro-shrinkage (Porosity) | Lower circumferential flange | N < 1.0 in localized zones | Low thermal gradient (G) and moderate cooling rate (Ț) in isolated sections. |
This prediction underscored a significant advantage of simulation for sand castings: it can reveal unforeseen problem areas that are not apparent during traditional planning. To rectify this, the casting process required optimization. The most effective method to eliminate the porosity in the lower flange was to accelerate its solidification, thereby increasing the local temperature gradient $G$. This is classically achieved by applying chills—metal inserts placed in the sand mold that act as heat sinks. For this sand casting, a series of external iron chills were designed to be placed around the problematic flange section within the mold.
The modified mold design, incorporating these chills, was subjected to a second simulation. The material properties for the chill (gray iron) were added to the model, defining its high thermal conductivity and heat capacity relative to the sand. The results were markedly improved. The solidification sequence showed that the chilled regions solidified directionally towards the chills, preventing the formation of isolated liquid pools. A re-calculation of the Niyama criterion confirmed that the values in the lower flange region now exceeded the critical threshold, indicating a sound casting. The effectiveness of chills can be rationalized by their impact on the Niyama parameter. By drastically increasing the local cooling rate $\dot{T}$ and, more importantly, steering the solidification to create a steeper temperature gradient $G$, the value of $N$ is increased according to $N = G / \sqrt{\dot{T}}$.
A comparative analysis of key thermal parameters before and after chill application highlights the change. The following table summarizes data extracted from specific nodes within the previously problematic zone.
| Condition | Local Cooling Rate, $\dot{T}$ (K/s) | Local Temp. Gradient, $G$ (K/m) | Calculated Niyama, $N$ (K1/2·s1/2/m) | Porosity Prediction |
|---|---|---|---|---|
| Without Chills | 0.15 | ~120 | ~0.98 | Likely (N < 1.0) |
| With Chills | 0.40 | ~350 | ~1.75 | Unlikely (N > 1.0) |
The final, optimized process was adopted for the actual production of the sand casting. The physical pour was conducted, and the resulting valve body was inspected rigorously after shakeout and heat treatment. Non-destructive testing (NDT) methods confirmed the absence of shrinkage defects in the critical lower flange area. The risers performed as simulated, containing the major shrinkage. This successful outcome validated the entire simulation-driven design process, demonstrating that potential defects in sand castings can be identified and eliminated digitally before any metal is poured, saving tremendous time and cost.
Beyond this specific case, the application of simulation for sand castings extends to numerous other aspects. It can be used to predict mold erosion, core gas defects, misruns, cold shuts, and residual stresses. For instance, the filling analysis provides velocity and pressure fields that help optimize gate sizes and locations to avoid excessive turbulence. The temperature history from the simulation can be directly used as input for subsequent heat treatment and residual stress analysis, creating a fully integrated digital thread for manufacturing sand castings.
In conclusion, my foray into using advanced casting simulation software has solidified my conviction that it is an indispensable tool for modern foundries specializing in sand castings. It moves the process from an art reliant on experience to a science driven by predictive physics. The ability to virtually test multiple design iterations, visualize fluid flow and heat transfer in incredible detail, and accurately predict defects like shrinkage porosity transforms how we approach complex sand castings. The case of the large valve body is a testament to this power—a problem was identified in silico, solved through virtual engineering (chill design), and the solution was confirmed in the real world. As computational power increases and software algorithms become even more sophisticated, the fidelity and scope of simulation for sand castings will only expand, further reducing development risks and enabling the production of higher integrity, more reliable cast components across all industries.
The mathematical foundation remains key. The entire process is a numerical solution to the complex interplay described by the Navier-Stokes and energy equations under the unique boundary conditions of sand castings. The criteria functions, like the Niyama criterion, provide the essential link between computed thermal fields and practical foundry outcomes. For anyone involved in the production of sand castings, embracing this technology is no longer an option but a necessity for achieving competitiveness through quality, efficiency, and innovation. The journey from a 3D model to a sound sand casting is now a digitally guided one, where virtual prototypes undergo rigorous testing long before the first mold is assembled in the foundry.