
The production of high-integrity cast components, particularly for demanding applications like automotive engines, presents significant challenges in defect control. Among the various casting processes, sand casting remains a predominant method for manufacturing complex, medium-to-high volume sand casting products such as engine blocks and cylinder heads. The inherent flexibility and cost-effectiveness of sand molding are balanced by the complexity of the thermal and physical phenomena during metal pouring and solidification. Defects like shrinkage cavities and porosity are primary concerns, as they can severely compromise the mechanical performance and pressure tightness of the final component. This study employs advanced numerical simulation to delve into the effects of two critical thermal parameters—pouring temperature and initial mold temperature—on the formation of shrinkage holes in a cylinder head, a quintessential complex sand casting product.
Cylinder heads are geometrically intricate components characterized by varying wall thicknesses, enclosed cavities for coolant and oil passages, and regions of heavy sections (like valve bridges and fire decks). These heavy sections act as thermal hubs, or “hot spots,” where the last metal to solidify is located. If insufficient liquid metal feed is available to compensate for the volumetric contraction associated with the liquid-to-solid phase change, internal shrinkage defects form. In the context of sand casting products made from compacted graphite iron (CGI) or similar alloys, controlling this solidification shrinkage is paramount. Traditional trial-and-error methods for process optimization are time-consuming, costly, and often inadequate for predicting internal defect formation. Consequently, computational numerical simulation has become an indispensable tool. By virtually recreating the casting process, simulation allows for the pre-emptive analysis of solidification patterns, temperature gradients, and the prediction of defect-prone areas, enabling engineers to design robust gating and risering systems and optimize process parameters before any metal is poured.
1. Methodology: Virtual Experimentation via CAE Simulation
The core of this investigation relies on a virtual Design of Experiments (DoE) conducted using a specialized casting simulation system. The software utilized is a well-established CAE package renowned for its capabilities in modeling the filling and solidification processes of castings, with a particular strength in quantitatively predicting shrinkage and porosity defects through its gravity feeding and solidification shrinkage algorithms.
1.1 Virtual Prototype and Material Definition
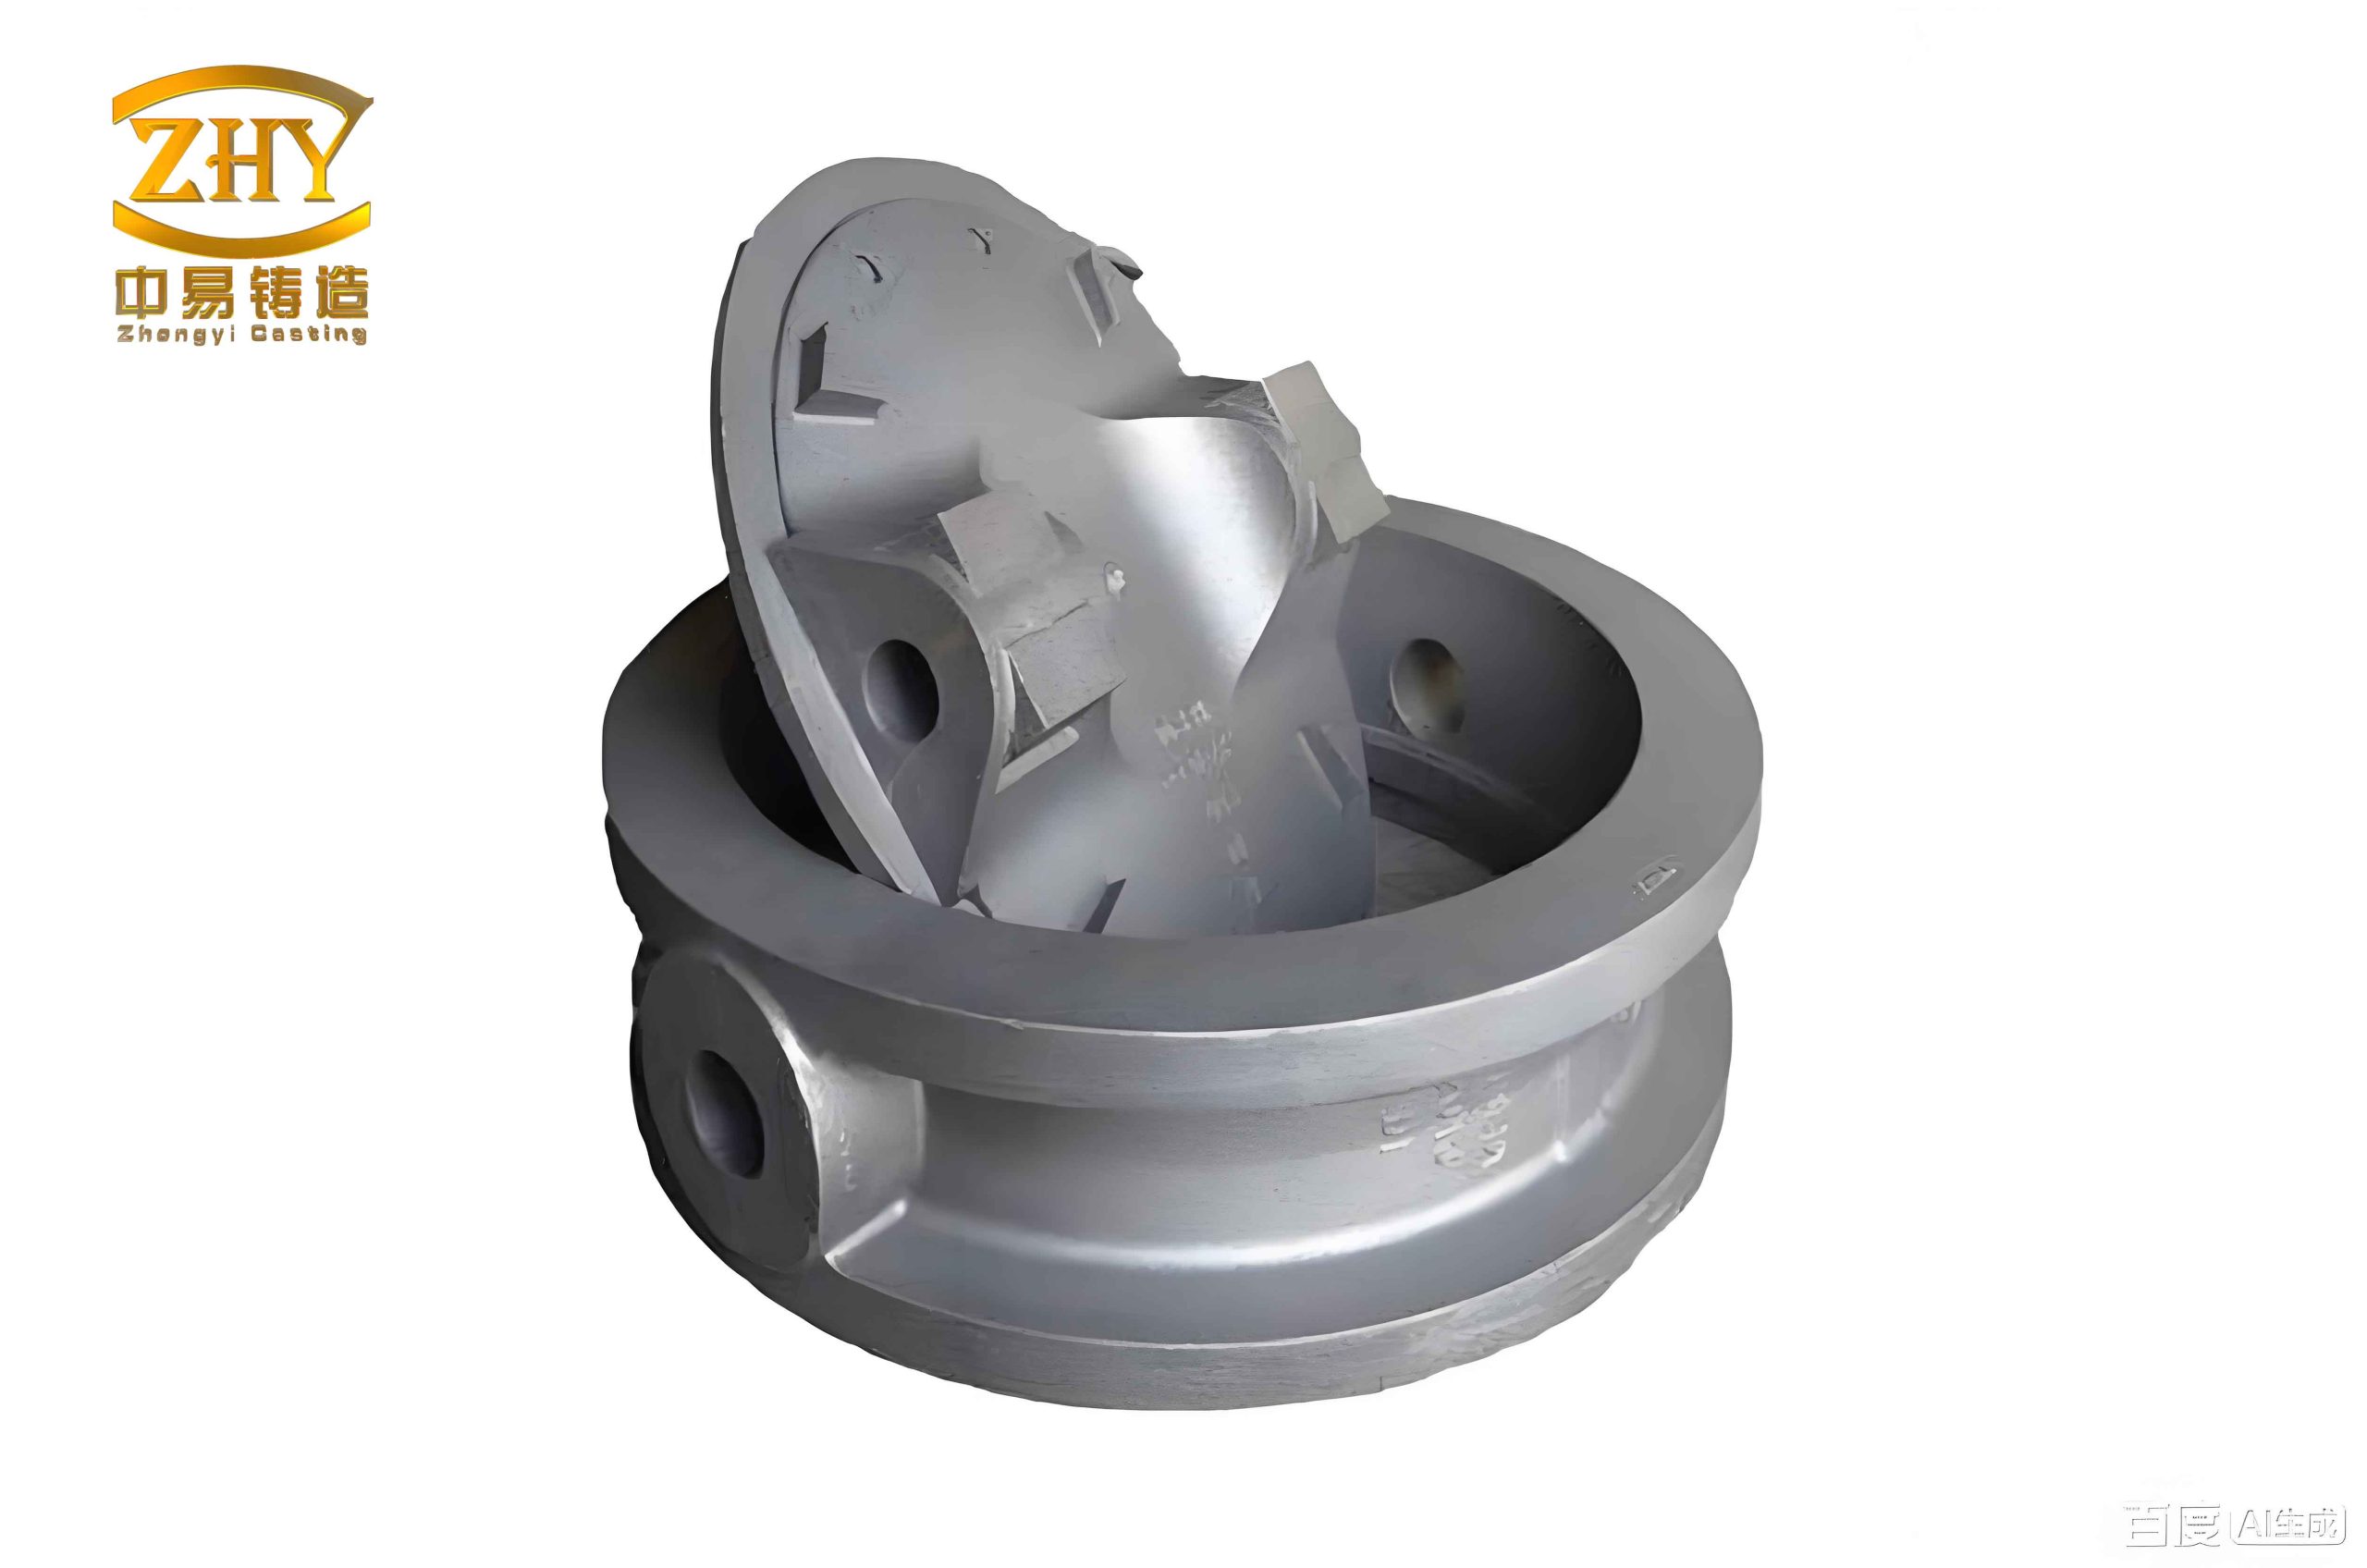
The subject of this study is a representative automotive engine cylinder head, a classic example of a high-value sand casting product. The casting geometry, including its gating system (designed as a bottom-filling system) and risers, was discretized using a finite-difference mesh. A uniform grid scheme was employed to ensure consistent resolution for accurate thermal and solidification calculations. The key meshing parameters are summarized in Table 1.
| Parameter | Value | Unit |
|---|---|---|
| Total Number of Cells | 13,296,465 | – |
| Number of Cells in Casting | 960,627 | – |
| Maximum Cell Edge Length | 3.5 | mm |
| Minimum Cell Edge Length | 3.5 | mm |
| Total Poured Weight | 408 | kg |
| Casting Finished Weight | 283 | kg |
| Estimated Yield | ~69.33 | % |
The alloy selected for the simulation is a Compacted Graphite Iron, grade RU450, a material commonly specified for cylinder heads due to its excellent combination of thermal conductivity, strength, and fatigue resistance. The thermophysical properties of RU450 (such as thermal conductivity, specific heat, latent heat, and solid fraction vs. temperature) were defined in the software’s material database. The mold material was defined as a typical green sand mixture, with appropriate thermal properties to model the heat extraction dynamics.
1.2 Definition of Process Parameters and Experimental Matrix
Based on industrial practice and preliminary studies, two key controllable thermal parameters were identified as the primary factors for this investigation: the metal’s pouring temperature ($T_p$) and the initial temperature of the sand mold ($T_m$). The realistic ranges for these parameters in the production of such sand casting products are provided in Table 2.
| Process Parameter | Symbol | Investigated Range | Unit |
|---|---|---|---|
| Pouring Temperature | $T_p$ | 1360 – 1400 | °C |
| Initial Mold Temperature | $T_m$ | 20 – 40 | °C |
A full-factorial experimental design was constructed within these ranges. Three levels were chosen for the mold temperature (20°C, 30°C, 40°C) and five levels for the pouring temperature (1360°C, 1370°C, 1380°C, 1390°C, 1400°C), resulting in a total of 15 distinct simulation runs. The complete experimental matrix is detailed in Table 3. The primary response variable for analysis is the predicted number of discrete shrinkage cavities (hereafter referred to as “shrinkage count,” $N_s$) within the casting volume, as identified by the software’s shrinkage prediction module.
| Simulation Run | Pouring Temp., $T_p$ (°C) | Mold Temp., $T_m$ (°C) | Primary Response: Shrinkage Count ($N_s$) |
|---|---|---|---|
| 1 | 1360 | 20 | To be determined |
| 2 | 1370 | 20 | To be determined |
| 3 | 1380 | 20 | To be determined |
| 4 | 1390 | 20 | To be determined |
| 5 | 1400 | 20 | To be determined |
| 6 | 1360 | 30 | To be determined |
| 7 | 1370 | 30 | To be determined |
| 8 | 1380 | 30 | To be determined |
| 9 | 1390 | 30 | To be determined |
| 10 | 1400 | 30 | To be determined |
| 11 | 1360 | 40 | To be determined |
| 12 | 1370 | 40 | To be determined |
| 13 | 1380 | 40 | To be determined |
| 14 | 1390 | 40 | To be determined |
| 15 | 1400 | 40 | To be determined |
2. Simulation Results and Analysis of Solidification Behavior
The post-processing of all 15 simulation runs provided detailed insights into the thermal history and defect formation. The pure solidification analysis, excluding fluid flow, confirmed that due to the bottom-gating and top-risering design, the cylinder head solidified in a largely progressive manner from the bottom sections towards the top and the risers. This directional solidification is generally desirable for feeding. The temperature field visualization (often represented by solidification “isochrons” or color-temperature maps) clearly identified the last regions to solidify, which correlated strongly with the heavy sections of the casting, such as the areas between valve seats and the deck face. These regions are the primary candidates for shrinkage defect formation in such sand casting products.
2.1 Prediction of Shrinkage Cavities
The software’s defect prediction module, applying a criterion based on the inability of liquid feed metal to reach a solidifying region, generated a map of potential shrinkage cavities for each simulation condition. Across all parameter combinations within the studied range, shrinkage defects were consistently predicted in the internal thick-walled sections of the cylinder head. The morphology and, more quantitatively, the number of these discrete shrinkage cavities ($N_s$) varied significantly with the input parameters $T_p$ and $T_m$.
2.2 Quantitative Analysis of Shrinkage Count vs. Pouring Temperature
The simulated shrinkage count ($N_s$) for each run was extracted and analyzed. The relationship between $N_s$ and $T_p$ is first examined by grouping the data according to the fixed mold temperature ($T_m$). The results are summarized in Table 4 and can be described by piecewise trends.
| Mold Temp. $T_m$ (°C) | Trend of $N_s$ vs. Increasing $T_p$ | Minimum $N_s$ (Count) at $T_p$ (°C) | Observations |
|---|---|---|---|
| 20 | Non-monotonic: Decreases then Increases | 22 @ $T_p$ = 1370 | Optimal $T_p$ exists within the range for this $T_m$. |
| 30 | Monotonic Increase | 24 @ $T_p$ = 1360 | Lower $T_p$ is beneficial. $N_s$ rises steadily with $T_p$. |
| 40 | Monotonic Increase | 22 @ $T_p$ = 1360 | Similar trend as for $T_m$=30°C. Lowest $T_p$ gives best result. |
Analysis: For a cold mold ($T_m$ = 20°C), there exists an optimal pouring temperature (1370°C in this study) that minimizes shrinkage. Pouring colder (1360°C) may lead to premature solidification in the gates, hindering feeding, while pouring hotter increases the total heat content, enlarging the mushy zone and potentially creating larger, more distributed shrinkage. For warmer molds ($T_m$ = 30°C and 40°C), the trend is clearer: a lower pouring temperature consistently yields a lower shrinkage count. The increased mold temperature itself reduces the initial thermal gradient, so coupling it with a high pouring temperature excessively slows solidification, worsening the feeding conditions for the thick sections in these complex sand casting products.
2.3 Quantitative Analysis of Shrinkage Count vs. Mold Temperature
Conversely, the effect of varying the initial mold temperature is analyzed by examining data at fixed pouring temperatures. The results are consolidated in Table 5.
| Pouring Temp. $T_p$ (°C) | Trend of $N_s$ vs. Increasing $T_m$ (20°C → 40°C) | Sensitivity to $T_m$ | Observations |
|---|---|---|---|
| 1360 | Weak Variation / Slight Decrease | Low to Moderate | $N_s$ changes minimally, potentially showing a slight improvement with warmer mold. |
| 1370 | Negligible Variation | Very Low (Insensitive) | $N_s$ remains almost constant (~22-23). |
| 1380 | Negligible Variation | Very Low (Insensitive) | $N_s$ remains almost constant. |
| 1390 | Negligible Variation | Very Low (Insensitive) | $N_s$ shows no consistent trend. |
| 1400 | Weak Variation | Low | $N_s$ is high but changes little across $T_m$. |
Analysis: A key finding is that for intermediate to high pouring temperatures (1370°C to 1400°C), the shrinkage count is remarkably insensitive to changes in the initial mold temperature within the 20-40°C range. This suggests that for a given gating/risering design on this cylinder head, the system’s feeding efficiency is dominated by the metal’s superheat rather than the initial state of the mold sand, once the mold is above ambient temperature. The influence of $T_m$ becomes slightly more noticeable only at the lowest pouring temperature (1360°C).
3. Sensitivity and Correlation Analysis
To objectively compare the relative influence of the two parameters on the shrinkage defect count ($N_s$), a statistical correlation analysis was performed. The linear correlation coefficient (Pearson’s $r$) was calculated for the relationship between $N_s$ and each parameter under constrained conditions. The formula for the correlation coefficient between variable $X$ (e.g., $T_p$) and $Y$ (e.g., $N_s$) is given by:
$$r_{XY} = \frac{\operatorname{Cov}(X,Y)}{\sigma_X \sigma_Y} = \frac{\sum_{i=1}^{n} (x_i – \bar{x})(y_i – \bar{y})}{\sqrt{\sum_{i=1}^{n} (x_i – \bar{x})^2 \sum_{i=1}^{n} (y_i – \bar{y})^2}}$$
where $\operatorname{Cov}(X,Y)$ is the covariance, and $\sigma_X$, $\sigma_Y$ are the standard deviations.
The calculated correlation coefficients are presented in Table 6. For cases where the variance of $N_s$ across $T_m$ was zero or near-zero, the correlation was deemed undefined or negligible.
| Analysis Condition | Correlated Variables | Correlation Coefficient ($r$) | Interpretation of Strength |
|---|---|---|---|
| $T_m$ fixed at 20°C | $N_s$ vs. $T_p$ | $r_1 \approx +0.73$ | Strong Positive Correlation |
| $T_m$ fixed at 30°C | $N_s$ vs. $T_p$ | $r_2 \approx +0.92$ | Very Strong Positive Correlation |
| $T_m$ fixed at 40°C | $N_s$ vs. $T_p$ | $r_3 \approx +0.91$ | Very Strong Positive Correlation |
| $T_p$ fixed at 1360°C | $N_s$ vs. $T_m$ | $r_4 \approx -0.99$ | Very Strong Negative Correlation |
| $T_p$ fixed at 1370°C | $N_s$ vs. $T_m$ | ~0 (Variance ~0) | No Correlation (Insensitive) |
| $T_p$ fixed at 1380°C | $N_s$ vs. $T_m$ | ~0 (Variance ~0) | No Correlation (Insensitive) |
| $T_p$ fixed at 1390°C | $N_s$ vs. $T_m$ | ~0 | No Correlation (Insensitive) |
| $T_p$ fixed at 1400°C | $N_s$ vs. $T_m$ | $r_5 \approx -0.87$ | Strong Negative Correlation |
Synthesis and Dominant Factor Identification: While Table 6 shows that $T_m$ can have a strong correlation at the extremes of the $T_p$ range (1360°C and 1400°C), its influence is absent for the majority of the intermediate $T_p$ settings which are most common in practice. In contrast, the correlation between $N_s$ and $T_p$ is consistently strong and positive for all fixed $T_m$ conditions (with $r$ values of 0.73, 0.92, and 0.91). This consistent, high-magnitude relationship unequivocally identifies the pouring temperature ($T_p$) as the more dominant and sensitive process parameter affecting the formation of shrinkage holes in this specific cylinder head sand casting product under the studied conditions. The mold temperature ($T_m$) plays a secondary, and often negligible, role unless the pouring temperature is at the lower or upper bounds of its operational window.
4. Discussion: Implications for Process Optimization in Sand Casting
The findings from this numerical study have direct implications for foundries producing complex, high-performance sand casting products. The identification of pouring temperature as the primary control lever for shrinkage defects is crucial. It underscores the importance of precise temperature management during metal treatment and transfer. For the studied cylinder head geometry and gating design, the results suggest an optimal process window:
- When using a standard, unheated mold (≈20°C): A pouring temperature of approximately 1370°C is predicted to minimize internal shrinkage.
- When mold temperature is less controlled or slightly elevated (e.g., 30-40°C in continuous production): Adopting a lower pouring temperature (1360°C) is beneficial to counteract the reduced solidification rate caused by the warmer mold.
The insensitivity of shrinkage to mold temperature over a wide range (20-40°C) for most pouring temperatures is a valuable practical insight. It indicates that for this class of sand casting products, minor day-to-day variations in the sand system’s initial temperature—within this band—are unlikely to be the root cause of shrinkage-related scrap fluctuations, provided the pouring temperature is stable. The process robustness is therefore more dependent on maintaining tight control over the metal superheat.
The physical rationale can be interpreted through the concept of the “feeding path” and solidification time. A higher $T_p$ increases the total enthalpy of the system, prolonging the solidification time of the entire casting, especially the thermal hubs. This extended mushy zone duration can compromise the effectiveness of the risers, as feeding channels may solidify before the thick sections are fully fed. Conversely, a very low $T_p$ risks premature freezing in the gating system itself, cutting off feed metal supply entirely. The initial mold temperature $T_m$ modifies the early-stage heat extraction rate, but for a thick sand mold, its effect on the overall solidification time of a heavy-section iron casting is less pronounced than a significant change in metal superheat.
This study also highlights the power of CAE simulation as a virtual optimization tool. By systematically exploring the parameter space, it identifies not just optimal set points but also the relative sensitivity of the casting process to different inputs. This knowledge is essential for implementing effective Statistical Process Control (SPC) in a foundry, directing attention and resources to monitoring and controlling the parameters that matter most for the quality of the final sand casting products.
5. Conclusion
This investigation utilized advanced numerical simulation to systematically analyze the impact of pouring temperature and initial mold temperature on the formation of shrinkage cavities in a complex cylinder head casting. The study yields several definitive conclusions for the sand casting of such components:
- Defect Localization: Shrinkage defects in the studied cylinder head, a critical automotive sand casting product, are consistently predicted to form in the internal thick-walled sections (thermal hubs), validating the focus of feeding system design on these areas.
- Optimal Parameter Windows: The optimal combination to minimize the number of shrinkage holes was found at (i) $T_p$ = 1370°C with $T_m$ = 20°C, and (ii) $T_p$ = 1360°C with $T_m$ = 30°C, both resulting in a predicted minimum of 22 discrete cavities. The relationship between $N_s$ and $T_p$ is highly dependent on the concomitant $T_m$.
- Parameter Insensitivity: For a wide range of practically relevant pouring temperatures (1370°C to 1400°C), the shrinkage defect count exhibited negligible sensitivity to variations in the initial mold temperature within the 20-40°C range. This indicates a degree of process robustness against typical sand temperature fluctuations.
- Dominant Process Factor: Through formal correlation analysis, pouring temperature ($T_p$) was unequivocally identified as the more dominant and sensitive parameter compared to initial mold temperature ($T_m$) in influencing the shrinkage defect count. The correlation between $N_s$ and $T_p$ was consistently strong and positive ($r > 0.72$), whereas the correlation with $T_m$ was often weak or nonexistent.
In summary, for foundries aiming to reduce shrinkage-related scrap in complex sand casting products like cylinder heads, this work emphasizes that primary focus should be placed on achieving precise, consistent, and optimally set pouring temperatures. Controlling metal superheat is a more effective strategy for defect mitigation than attempting to tightly regulate the initial temperature of green sand molds within the common ambient range. The methodology demonstrated serves as a template for the virtual optimization of other critical parameters, such as riser design, chilling, or alloy composition, to further enhance the quality and reliability of engineered sand casting products.