
Throughout my years of working in the foundry industry, I have encountered numerous challenges associated with sand casting defects. One of the most persistent issues has been the occurrence of shrinkage porosity and shrinkage cavities in ductile iron components, particularly in hydraulic system parts. This article presents my personal experience in optimizing the casting process for a hydraulic rear cover made of QT450-10 material, using MAGMA simulation software to analyze and eliminate sand casting defect problems. The goal was to reduce the rejection rate from 8 % to below 1 % while maintaining mechanical properties and ensuring sound internal quality.
Introduction
Sand casting is a widely used manufacturing process due to its flexibility, low cost, and ability to produce complex geometries. However, sand casting defect such as shrinkage, gas porosity, sand inclusion, and misruns can significantly affect the quality and reliability of castings. In the production of hydraulic components, internal defects are particularly critical because they can lead to leakage, reduced fatigue life, and catastrophic failure under pressure. The hydraulic rear cover studied here is an essential part of an excavator’s hydraulic system, which experiences dynamic loads during operation. The material specification requires QT450-10 ductile iron with minimum tensile strength of 450 MPa, elongation of 10 %, and nodularity above 85 %.
In the initial production runs, I observed that approximately 8 % of the castings were rejected due to internal shrinkage porosity detected by radiographic inspection and subsequent sectioning. This sand casting defect was localized in the thick sections near the oil ports and at the junction between the main body and the reduced-weight areas. To solve this problem, I turned to numerical simulation using MAGMA software, which allowed me to visualize the solidification sequence and identify the root cause of the defects.
Material and Experimental Methods
The hydraulic rear cover has dimensions of 160 mm × 130 mm × 50 mm with a casting weight of approximately 5.3 kg. The component features a main body with local weight-reduction pockets and two internal oil ports that require sand cores. I used a green sand molding process on a Künkel-Wagner (KW) high-pressure squeeze molding line. The chemical composition of the melt is shown in Table 1.
| Element | Range |
|---|---|
| C | 3.1 – 3.8 |
| Si | 2.0 – 3.0 |
| Mn | ≤ 0.5 |
| P | ≤ 0.05 |
| S | ≤ 0.025 |
| Cr | ≤ 0.07 |
| Cu | ≤ 0.3 |
| Mg | 0.030 – 0.055 |
Melting was carried out in an electric induction furnace with charge materials consisting of pig iron, steel scrap, and foundry returns. The melt was superheated to 1490 – 1520 °C, followed by inoculation and spheroidization treatment. Pouring temperature was controlled between 1360 °C and 1370 °C. After casting, the molds were held for 2–3 hours before shakeout. Test bars were cut from the castings for mechanical testing and metallographic examination. Tensile testing was performed on a universal testing machine, and hardness was measured using a Brinell hardness tester (three readings averaged). Nodularity and graphite morphology were evaluated under an optical microscope.
The mechanical property requirements are given in Table 2.
| Property | Value |
|---|---|
| Tensile strength, Rm (MPa) | ≥ 450 |
| Yield strength, Rp0.2 (MPa) | ≥ 310 |
| Elongation, A (%) | ≥ 10 |
| Brinell hardness (HB) | 160 – 210 |
| Nodularity (%) | ≥ 85 |
Initial Casting Design and Simulation Analysis
The original casting layout used a four-cavity mold with side risers. Each riser fed two castings, and chill blocks were placed near the thick sections to enhance the feeding distance. The gating system was designed to fill through the risers (riser-gated design) to ensure that the riser remained hot during filling. The total weight of the gating system was 52 kg, and the filling time was set to 8 s. The solidification simulation performed with MAGMA used the parameters listed in Table 3.
| Parameter | Value |
|---|---|
| Cast material | QT450-10 |
| Mold material | Green sand (moisture controlled) |
| Pouring temperature | 1360 – 1370 °C |
| Pouring time | 8 s |
| Heat transfer coefficient | Default MAGMA for sand |
| Solidification model | Niyama criterion / shrinkage porosity |
The simulation results revealed a serious sand casting defect: shrinkage porosity at the interface between the casting and the riser during the final stage of solidification. At 96 % solidification, the feeding path between the casting and riser became disconnected, meaning that the casting could no longer receive liquid metal from the riser. This led to isolated liquid pools inside the casting that eventually solidified as shrinkage cavities. The Niyama criterion map clearly indicated hot spots in the area near the oil ports and the weight-reduction pockets.
As shown in the solidification sequence, the riser lost its feeding efficiency because the connecting neck froze too early. This is a classic sand casting defect caused by improper riser placement and insufficient thermal gradient. The chill blocks originally intended to increase the freezing rate actually aggravated the problem by creating a premature solidification front that blocked the feeding channel. The rejection rate in production was 8 %, confirming the simulation predictions.
Process Optimization and Improved Design
To overcome the sand casting defect, I redesigned the gating and risering system with the following principles:
- Place the riser directly above the hottest spot (the thermal center) of the casting to ensure a continuous feeding path until the end of solidification.
- Eliminate the chill blocks because they interfered with directional solidification.
- Use a top riser instead of a side riser to improve feeding efficiency.
- Maintain the same number of cavities (four per mold) but change the mold layout so that each casting has its own dedicated riser.
The optimized layout is shown conceptually: each casting is poured with a cylindrical top riser located at the junction of the main body and the oil ports. The gating system was redesigned to fill the mold from the bottom, with ingates entering the casting through the riser neck. This ensures that the riser remains hot and fills last. The simulation parameters remained the same as in Table 3.
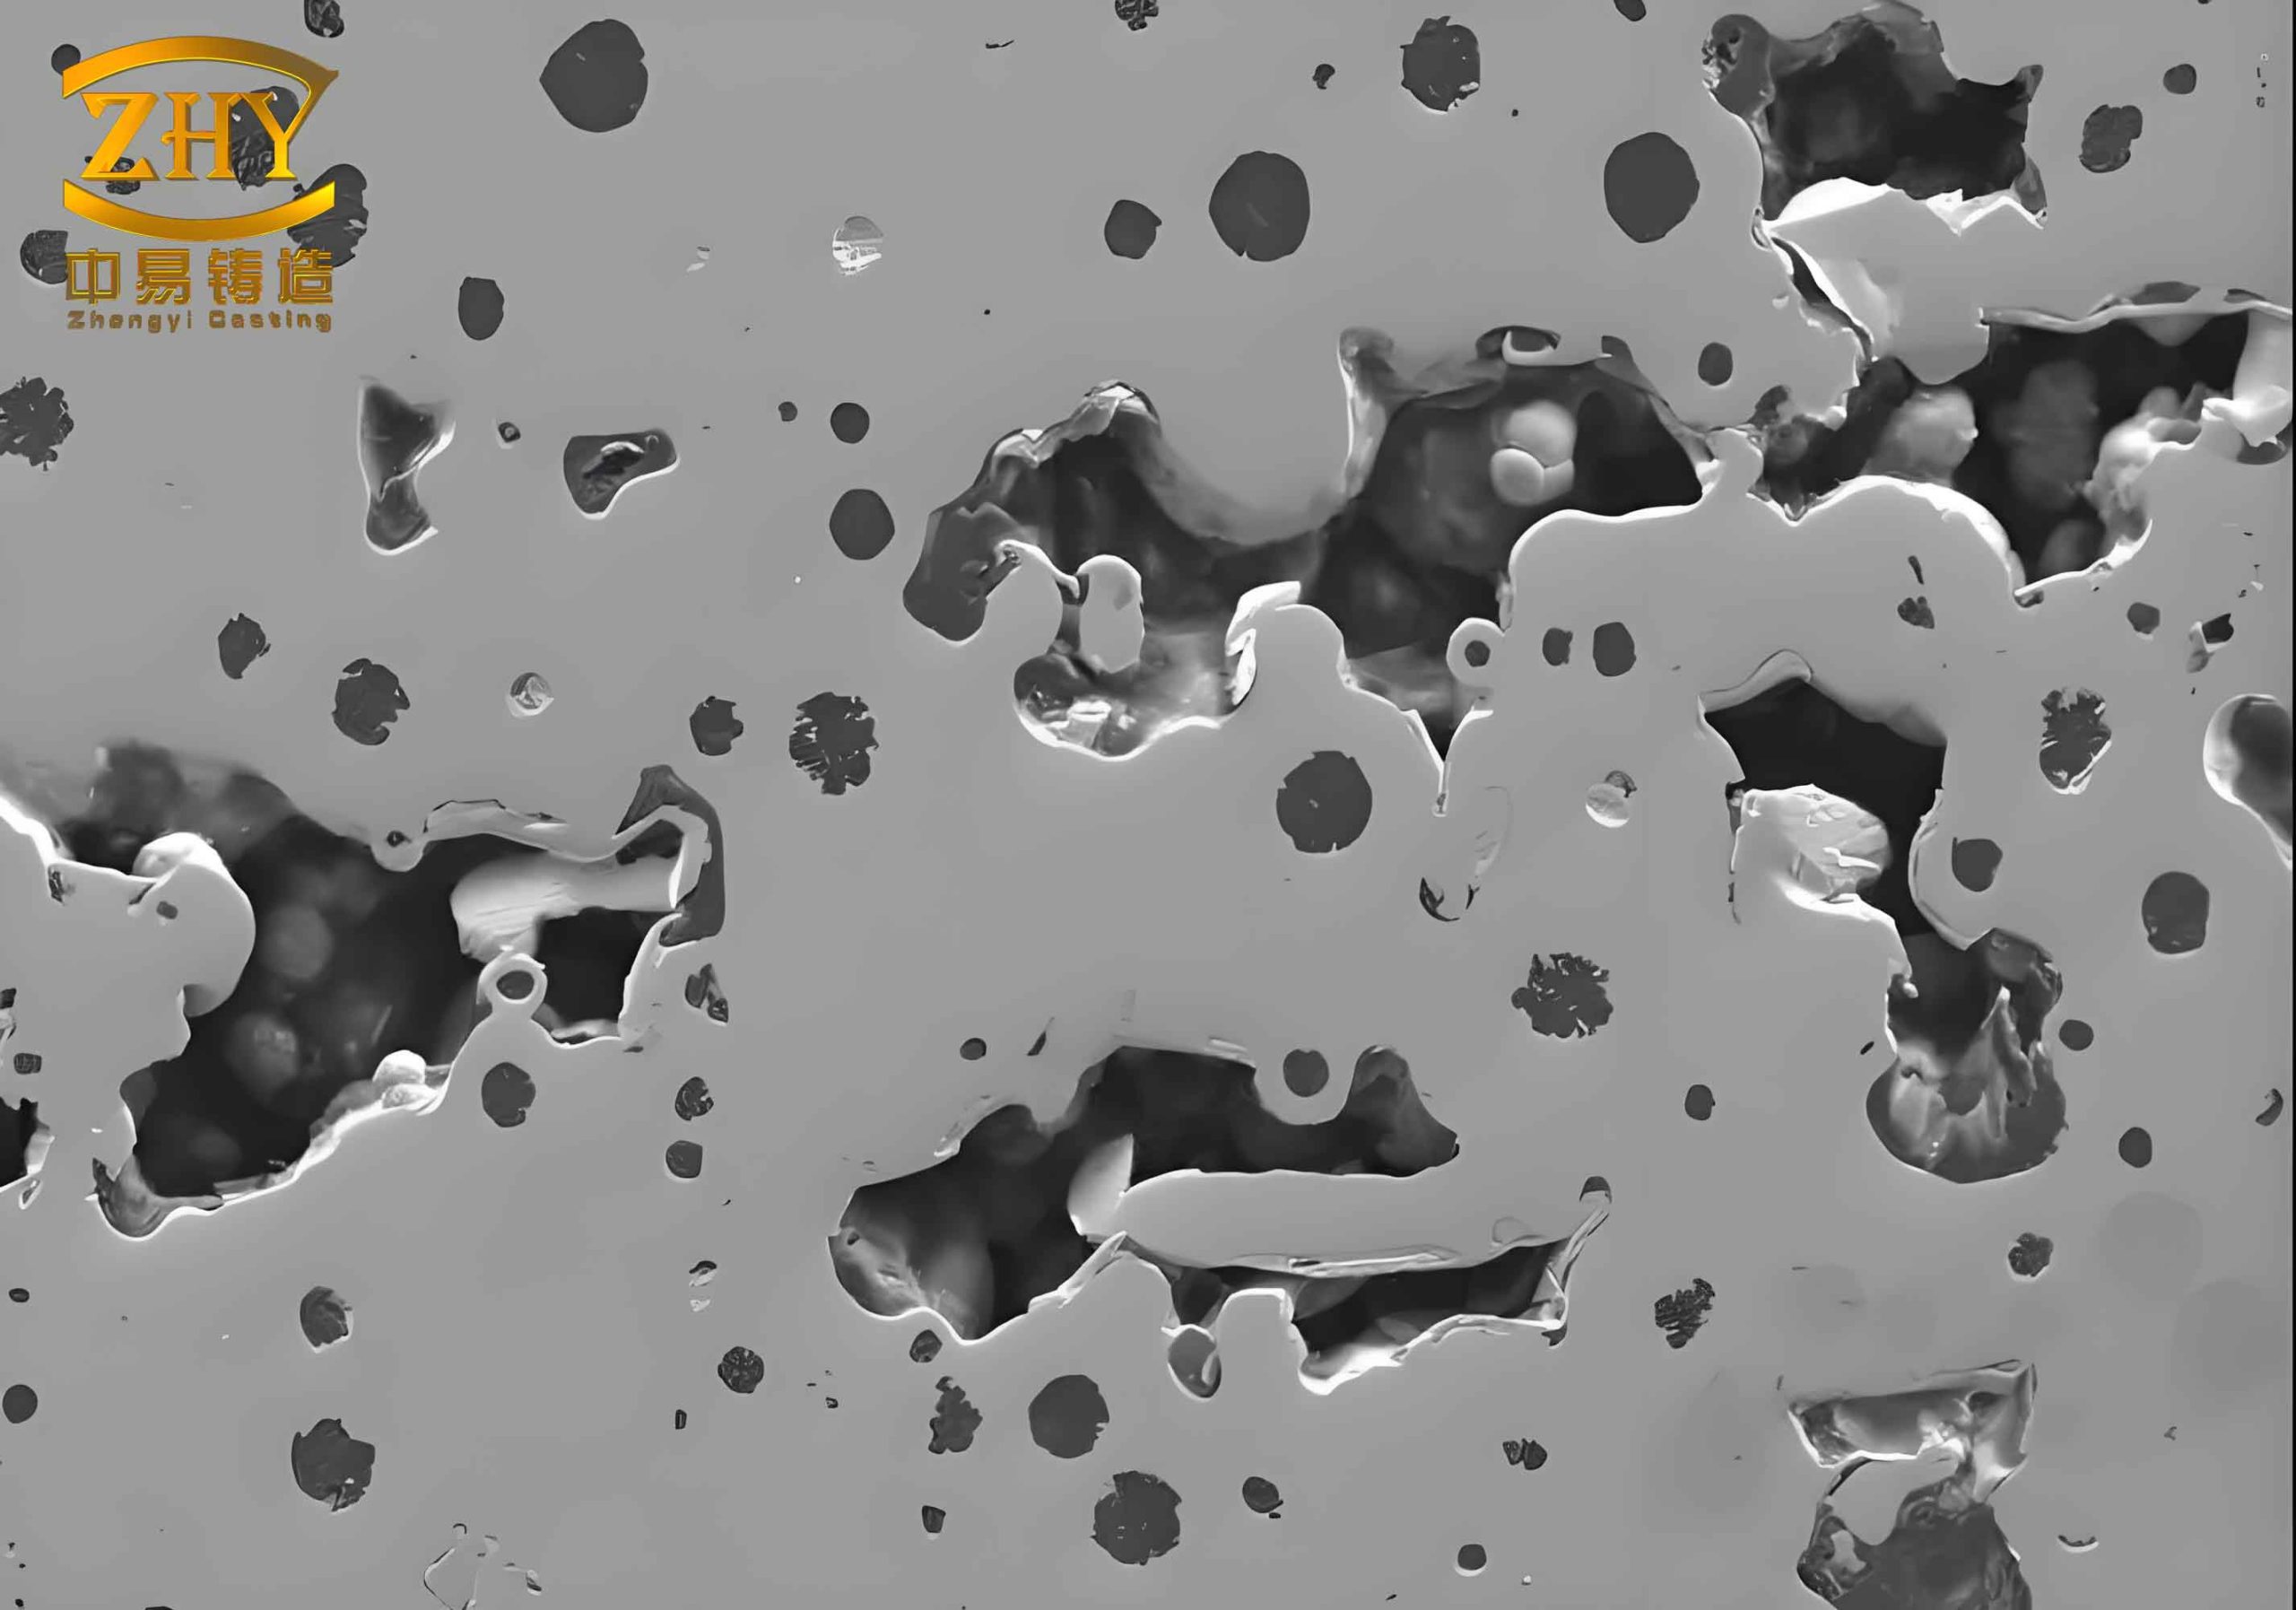
Figure above illustrates the typical appearance of a sand casting defect that we aimed to eliminate. The image shows a cross-section of a casting with shrinkage porosity, which is unacceptable for hydraulic components.
Simulation Results of the Optimized Design
The MAGMA simulation of the optimized design showed a completely different solidification pattern. During the filling stage (8 % and 24 % filled), the melt velocity in the mold cavity remained below 1 m/s, indicating a smooth, non-turbulent fill. The ingates were submerged quickly, preventing air entrainment. More importantly, the solidification sequence at 96 % and 98 % solidified fractions demonstrated that the casting solidified first, while the riser remained liquid until the very end. The feeding path stayed open throughout, and no isolated liquid pools formed inside the casting.
The shrinkage porosity simulation (Niyama criterion) predicted zero internal defects. All remaining liquid at the end of solidification was confined to the riser, which could be removed during fettling. The mechanical properties and microstructure were expected to meet the QT450-10 standard.
Production Validation and Quality Inspection
Based on the simulation, I implemented the optimized design in production. A batch of castings was produced and subjected to rigorous inspection. The castings were sectioned and dye-penetrant tested (PT) to reveal any surface-breaking defects. No indications of shrinkage, cracks, or sand inclusions were found. Internal soundness was confirmed by radiographic examination (X-ray) per ASTM E446, with no porosity exceeding level 1.
Test bars cut from the castings were evaluated for mechanical properties and microstructure. Results are summarized in Table 4.
| Property | Measured value | Requirement |
|---|---|---|
| Tensile strength, Rm (MPa) | 480 | ≥ 450 |
| Yield strength, Rp0.2 (MPa) | 330 | ≥ 310 |
| Elongation, A (%) | 13 | ≥ 10 |
| Brinell hardness (HB) | 195 | 160 – 210 |
| Nodularity (%) | 90 | ≥ 85 |
Metallographic examination revealed a well-graphitized matrix with nodular graphite of type I/II (spheroidal) in a ferritic-pearlitic matrix. Graphite size was predominantly class 6–7 per ISO 945. No carbide or flake graphite was observed. This microstructure is typical for a properly spheroidized and inoculated ductile iron.
The most significant outcome was the dramatic reduction in the rejection rate due to sand casting defect. Over a production period of three months, the scrap rate dropped from 8 % to 0.8 %, a reduction of 90 %. The process became robust and insensitive to minor variations in melt quality and molding conditions.
Thermal and Solidification Analysis
To further understand the elimination of sand casting defect, I performed a detailed thermal analysis using the MAGMA post-processor. The temperature gradient during solidification plays a crucial role in feeding efficiency. The optimized design achieved a favorable gradient: the casting temperature dropped quickly due to the green sand mold, while the riser maintained a higher temperature because of its larger modulus.
The feeding distance can be quantified by the Niyama criterion, which is defined as:
$$ \text{Niyama} = G / \sqrt{R} $$
where \(G\) is the temperature gradient and \(R\) is the cooling rate. A Niyama value below a certain threshold indicates a risk of microporosity. In the optimized design, the Niyama values across the casting were well above the critical limit, confirming soundness.
The solidification time of the casting was approximately 400 s, while the riser solidified around 600 s, providing ample liquid metal for compensation. The volume of the riser was designed based on the modulus method:
$$ M_{\text{riser}} \geq 1.2 \cdot M_{\text{casting}} $$
where \(M\) is the modulus defined as \(V/A\). The modulus of the casting’s hot spot was calculated as 1.8 cm, and the riser modulus was set to 2.2 cm, satisfying the requirement.
Comparison of Original and Optimized Designs
Table 5 compares the key parameters between the original and optimized processes.
| Parameter | Original design | Optimized design |
|---|---|---|
| Riser type | Side riser (one per two castings) | Top riser (one per casting) |
| Chill blocks | Yes | No |
| Feeding path | Blocked early | Open until end |
| Simulated shrinkage porosity | Present | None |
| Production scrap rate | 8 % | 0.8 % |
| Average mechanical properties | Met minimum | Exceeded minimum |
Discussion
The sand casting defect in the original design was primarily caused by inadequate riser positioning. The side riser, even with chills, could not provide a sufficiently high temperature gradient toward the riser. The thermal center of the casting was located away from the riser neck, and the chill blocks actually promoted earlier solidification at the neck, worsening the situation. This is a classic example where an attempt to increase feeding distance by using chills backfires if the chills are placed incorrectly.
By moving the riser directly above the hot spot, I achieved directional solidification from the casting toward the riser. The top riser design also allowed gravitational feeding, which is more effective than lateral feeding for ductile iron due to its pasty solidification nature. The elimination of chills simplified the mold assembly and reduced cost.
The simulation results were highly predictive. The Niyama criterion correctly identified the defect locations in the original design and predicted soundness in the optimized one. This validates the use of MAGMA as a tool to prevent sand casting defect before building the tooling. The time and cost saved by simulation are substantial compared to trial-and-error in the foundry.
Another factor that contributed to the success was the careful control of pouring parameters. Even with the optimized gating, a poorly controlled pouring can introduce defects such as slag inclusion or gas porosity. I maintained the pouring temperature within the narrow window of 1360–1370 °C. The pouring time of 8 s was verified by simulation to be optimal; too fast would cause turbulence, too slow would cause cold shut. The ingate velocity was kept below 0.5 m/s, minimizing erosion of the sand mold and preventing sand inclusion.
The microstructure of the optimized castings showed excellent nodularity and a ferritic-pearlitic ratio suitable for the required toughness and strength. The measured elongation of 13 % is well above the 10 % minimum, indicating a ductile matrix. The hardness of 195 HB is within the specification, providing sufficient strength without being too brittle.
Conclusion
Through systematic application of MAGMA simulation and process optimization, I successfully eliminated the sand casting defect that had plagued the production of hydraulic rear covers. The key changes were:
- Replacing side risers with top risers located at the thermal center of each casting.
- Removing chill blocks that interfered with directional solidification.
- Ensuring smooth filling with controlled velocity.
The optimized process reduced the scrap rate from 8 % to 0.8 %, a 10‑fold improvement. The mechanical properties and microstructure fully conformed to the QT450‑10 specification. This case study demonstrates that sand casting defect can be effectively addressed by combining simulation expertise with sound casting principles. The approach is generalizable to other ductile iron components with similar geometry and defect challenges. I recommend that foundries invest in simulation tools and train engineers to interpret the results, as this leads to robust processes, lower costs, and higher quality.
In conclusion, the journey from an 8 % rejection rate to 0.8 % was achieved not by guesswork but by understanding the physics of solidification and feeding. Every reduction in sand casting defect counts toward profitability and customer satisfaction. I hope my experience encourages others to adopt a similar data-driven methodology.