
In this study, I focus on the development of a casting process for a heavy-duty truck engine cylinder head using 3D sand printing technology. The conventional resin sand casting approach often suffers from poor dimensional accuracy of inner cavities, difficult core positioning, and labor-intensive cleaning operations. To overcome these limitations, I designed a complete casting process based on 3D sand printing, also known as sand binder jetting, which allows the fabrication of complex sand molds and cores directly from CAD data without any tooling. This approach significantly improves design freedom, shortens development cycles, and enhances product quality. Throughout this paper, I emphasize the role of 3D sand printing in every stage of process design, from concept to production validation.
The cylinder head under investigation is a six-cylinder integral structure with multiple internal chambers such as combustion chambers, water jackets, and bolt holes. It is a thin-walled complex box-type casting with an overall mass of approximately 206 kg, made of gray cast iron HT300. The major wall thickness is less than 30 mm, with the minimum wall thickness reaching only 5.4 mm. This geometry presents several casting challenges, including difficult core support, high risk of core displacement, and the tendency for shrinkage porosity in thick sections. My goal is to develop a robust casting process that ensures sound internal quality and meets strict dimensional requirements.
Initial Analysis of Casting Requirements
The chemical composition requirements for HT300 cylinder head are listed in Table 1. These values were used as the basis for melt quality control and process parameter design.
| Element | Required Range (wt%) |
|---|---|
| Carbon (C) | 3.10 – 3.45 |
| Silicon (Si) | 1.70 – 2.30 |
| Manganese (Mn) | ≤ 0.80 |
| Phosphorus (P) | ≤ 0.08 |
| Sulfur (S) | ≤ 0.15 |
| Chromium (Cr) | 0.15 – 0.28 |
| Molybdenum (Mo) | 0.25 – 0.40 |
| Copper (Cu) | 0.60 – 1.00 |
The basic geometric parameters and mechanical requirements are summarized in Tables 2 and 3 respectively. These tables define the boundary conditions for my process design.
| Parameter | Value |
|---|---|
| Mass (kg) | 206 |
| Length (mm) | 1139 |
| Width (mm) | 382 |
| Height (mm) | 158 |
| Maximum wall thickness (mm) | 21.5 |
| Minimum wall thickness (mm) | 5.4 |
| Property | Requirement |
|---|---|
| Tensile strength (MPa) | > 300 |
| Brinell hardness (HBW) | 220 – 275 |
| Graphite form | 85% – 95% flake |
| Pearlite | Fine lamellar > 98% |
| Phosphide eutectic | Binary phosphide < 2% |
After carefully studying the casting geometry, I identified three main technical challenges. First, the internal chambers are independent and intricately shaped, which makes core positioning extremely difficult. Any core shift would directly cause wall thickness deviations or even casting leakage. Second, the thin walls of only 5.4 mm between adjacent cavities demand excellent fluidity and controlled pouring parameters to avoid cold shuts and misruns. Third, thick sections around bolt bosses and mounting holes are prone to shrinkage porosity due to the formation of localized hot spots. Therefore, the casting process must include sophisticated feeding and cooling strategies.
Selection of Pouring Position and Parting Strategy
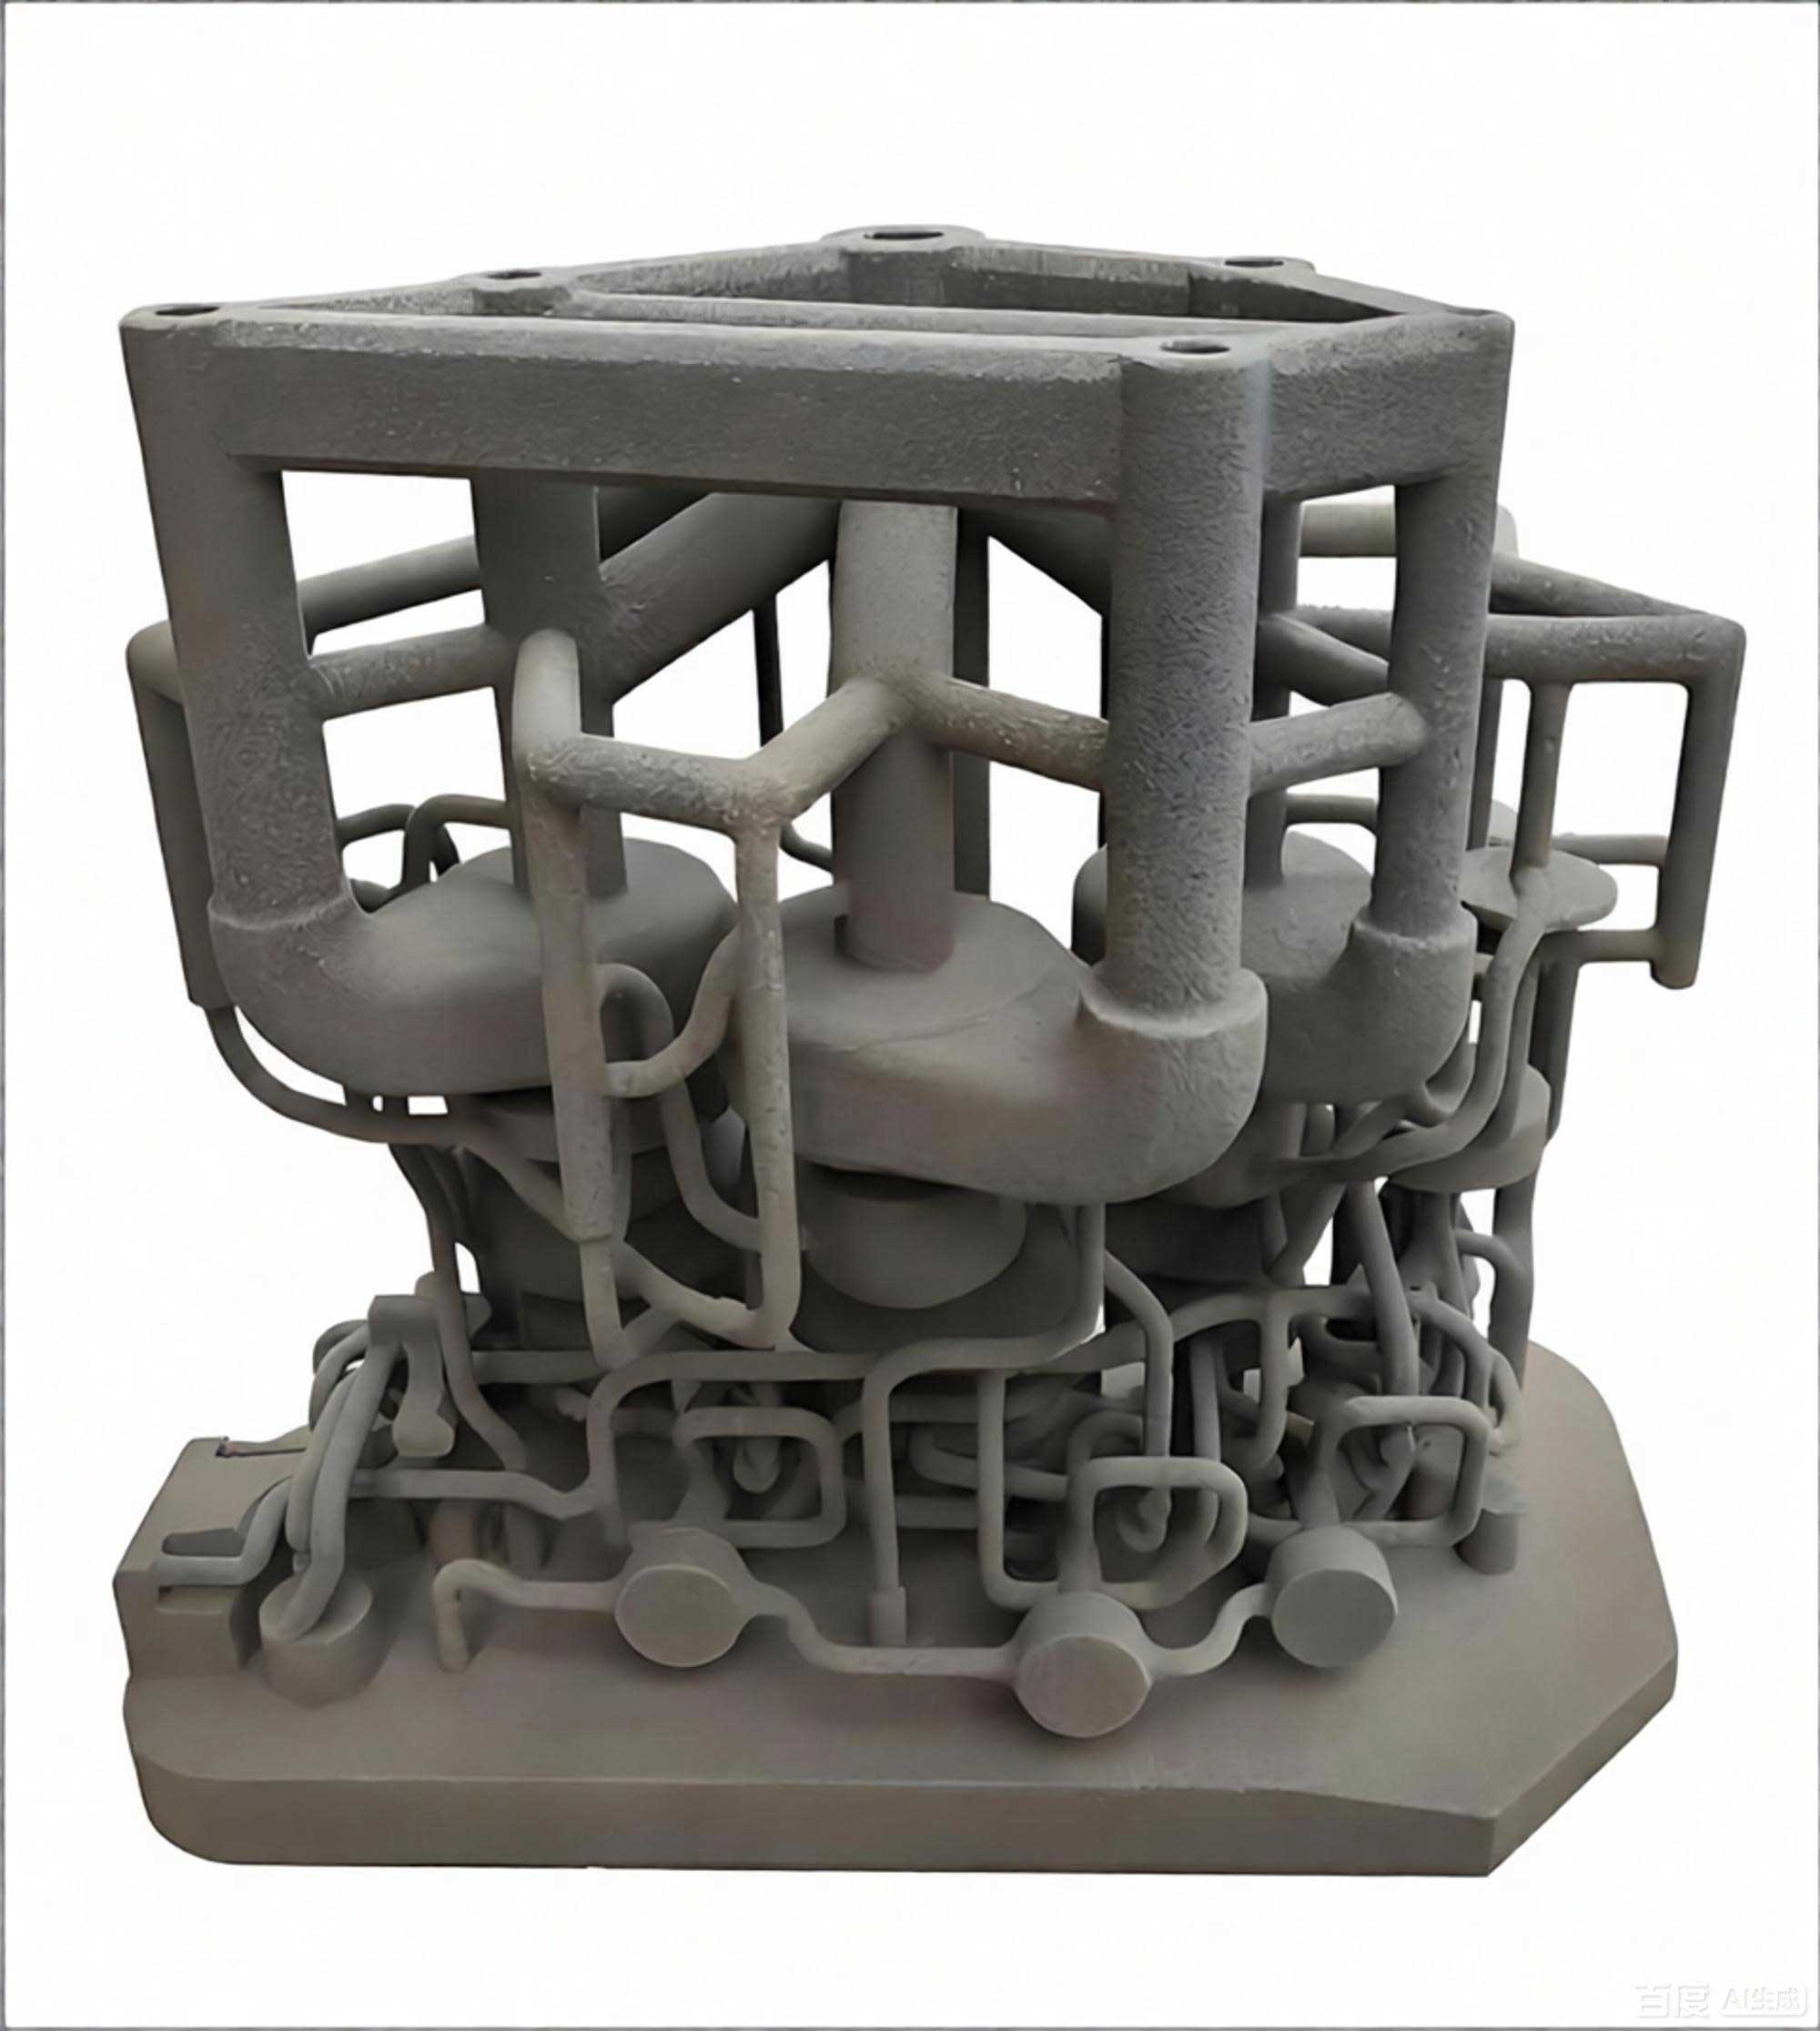
I selected the cylinder head mounting face as the top pouring position. This orientation offers several advantages from the perspective of 3D sand printing as well as conventional foundry practice. By placing the flange face upward, I could conveniently locate risers and vents on the top surface, enabling effective feeding and gas escape. The openings of the internal cores also face upward, which greatly facilitates core gas evacuation and prevents gas defects. In addition, the water jacket inlet and outlet are located on the side faces, allowing the water jacket core to be integrated with the external sand mold into one unit. This is a unique benefit of 3D sand printing because there is no need to consider mold release or draft angles.
The selected pouring position is illustrated in Figure 1. This schematic shows how the entire sand mold is assembled with the top part, bottom part, and side cores. Because 3D sand printing allows freeform geometries, I designed the part lines to follow the core cavities in a way that minimizes core count and reduces assembly errors.
Gating System Design
For the gating system, I employed an unpressurized (open) system to ensure smooth filling and to prevent sand erosion and core shifting. The cylinder head is quite long (1139 mm), so a dual sprue design with multiple flat ingates was chosen. This configuration helps maintain uniform temperature distribution during filling and reduces the risk of cold shuts. The gating system uses pouring cups, two ceramic foam filters, a main sprue, two cross runners, and multiple ingates. The ratio of the total cross-sectional areas of sprue, runner, and ingate was set as:
$$ \sum A_{sprue} : \sum A_{runner} : \sum A_{ingate} = 1 : 1.1 : 1.4 $$
The choke area was calculated using the well-known orifice equation for gravity pouring. For gray cast iron, I used a discharge coefficient \(\mu\) in the range of 0.45 to 0.55, and an effective static head \(H_p\) determined from the pour height. The pouring time was estimated from the empirical relationship:
$$ t = K \sqrt{m} $$
where \(m\) is the total pouring mass (including risers and gating) and \(K\) is a constant depending on the wall thickness and casting complexity. For this cylinder head, \(m\) was around 320 kg, and I took \(K = 2.2\), which gives a pouring time \(t = 2.2 \times \sqrt{320} \approx 39 \) seconds. The average filling rate can then be computed as:
$$ \dot{m} = \frac{m}{t} = \frac{320}{39} \approx 8.2 \, \text{kg/s} $$
With the selected pouring time, the choke area \(A_{\text{choke}}\) was determined by combining the continuity equation and Bernoulli’s principle:
$$ A_{\text{choke}} = \frac{m}{\mu t \rho \sqrt{2 g H_p}} $$
Taking \(\mu = 0.5\), \(\rho = 7.2 \times 10^3 \, \text{kg/m}^3\), \(g = 9.81 \, \text{m/s}^2\), and \(H_p = 0.35\) m, I obtained \(A_{\text{choke}} \approx 27 \, \text{cm}^2\). This value matched well with the final design. Two ceramic foam filters with dimensions of 100 mm × 100 mm each were placed after the sprue to ensure melt cleanliness and uniform flow distribution. The gating parameters are summarized in Table 4.
| Parameter | Value |
|---|---|
| Gating type | Unpressurized (open) |
| Total pouring mass (kg) | 320 |
| Pouring time (s) | 38 – 40 |
| Choke area (cm²) | 27 |
| Area ratio (sprue:runner:ingate) | 1 : 1.1 : 1.4 |
| Filter type | Silicon carbide foam |
| Filter dimension (mm) | 100 × 100 |
Riser and Chill Design
Gray cast iron has natural self-feeding ability due to graphite precipitation during solidification. However, with strict leak-tightness requirements and complex thin-walled structures, I still needed to place risers at strategic locations. I designed three insulating risers of \(\phi 140/170\) mm on the top of the casting, distributed uniformly along the combustion chamber side walls. A short and flat riser neck was used to improve feeding efficiency. Additionally, twelve degassing fins with dimensions of 60 mm × 15 mm were placed at thick wall locations on the top surface to facilitate gas escape and promote directional solidification.
To eliminate hot spots in the lower thick sections and around the installation bosses, I applied chills. Internal chills of \(\phi 30 \times 35\) mm were positioned at the bottom thick areas, and rectangular chills of 20 mm × 20 mm × 50 mm were placed near the bolt boss cores. The arrangement of risers and chills is summarized in Table 5.
| Feature | Dimension | Quantity | Location |
|---|---|---|---|
| Insulating riser | ϕ140/170 mm | 3 | Top, above combustion chambers |
| Venting fin | 60 × 15 mm | 12 | Top thick sections |
| Internal chill | ϕ30 × 35 mm | 4 | Bottom thick sections |
| Rectangular chill | 20 × 20 × 50 mm | 6 | Bolt boss locations |
The total feeding mass was calculated by adding the casting mass (206 kg), riser mass, and gating system mass, which resulted in approximately 320 kg of liquid metal poured per mold. The riser yield was checked using the modulus method. For a riser of diameter 140 mm and height 170 mm, the modulus \(M_r\) is approximately:
$$ M_r = \frac{V_r}{A_r} = \frac{\pi (0.07)^2 (0.17)}{2\pi (0.07)(0.17) + \pi (0.07)^2} \approx 0.035 \, \text{m} $$
This modulus is larger than the modulus of the casting hot spot, ensuring feeding before the neck freezes. The neck was designed as a wide and thin section to avoid shrinkage from premature freezing.
MAGEMA Simulation and Optimization
I used Magema simulation software to analyze the filling and solidification behavior of the casting. The simulation uses the finite volume method to solve the Navier-Stokes equations for incompressible flow and the Fourier heat conduction equation for heat transfer. The governing energy equation can be written as:
$$ \rho C_p \frac{\partial T}{\partial t} + \rho C_p \mathbf{u} \cdot \nabla T = \nabla \cdot (k \nabla T) + \rho L \frac{\partial f_s}{\partial t} $$
where \(T\) is temperature, \(\mathbf{u}\) is velocity, \(k\) is thermal conductivity, \(C_p\) is specific heat, \(L\) is latent heat, and \(f_s\) is the solid fraction. The simulation helps visualize flow velocities, temperature gradients, and porosity formation.
Figure 2 shows snapshots at different filling stages (15%, 30%, 60%, and 80% of the mold volume). The color contours represent temperature in degrees Celsius. It was observed that the metal front advanced smoothly without any sudden change in velocity, which confirmed the effectiveness of the unpressurized gating system. No jetting or aspiration phenomena were observed, which minimizes the risk of oxidation and slag entrainment.
Figure 3 illustrates the liquid fraction distribution at 10, 30, and 60 minutes after filling, along with the final macro-porosity prediction. The solidification sequence was progressive from thin walls to thick sections. The chills effectively moved the hot spots upward, allowing the risers to feed the late-solidifying regions. The porosity map showed almost no shrinkage defects in the critical inner-chamber areas.
Through iterative simulation, I adjusted the pouring temperature and pouring time. The optimum pouring temperature was determined to be 1390 ± 5 °C, and the filling time was around 38 seconds. The simulation results are summarized in Table 6.
| Parameter | Initial Trial | Final Optimized |
|---|---|---|
| Pouring temperature (°C) | 1420 | 1390 ± 5 |
| Filling time (s) | 45 | 38 |
| Maximum flow velocity (m/s) | 1.8 | 1.2 |
| Hot spot in combustion chamber area | Present | Eliminated |
| Porosity level at critical sections | 2.5% | < 0.5% |
The simulation also predicted the temperature distribution along the central cross-section. The temperature gradient satisfied the condition for directional solidification, with the riser remaining the last to solidify. This was achieved by adding chills in the lower areas and optimizing the riser neck geometry to delay solidification of the feeding path.
Design of 3D Printed Sand Cores and Molds
One of the greatest advantages of 3D sand printing is the ability to combine multiple cores into a single monolithic sand element, eliminating assembly errors and reducing the number of core prints. In my design, I took full advantage of this capability. The inner cavity core was printed as one complete unit without any splitting, which completely avoided the mismatch issue common in conventional core assembly. This monolithic core also simplified the cleaning process and improved dimensional consistency.
The 3D sand mold design included three main parts: the bottom mold, the top mold, and the side mold. The bottom mold integrated some of the runner channels and incorporated a venting system for the internal core. Venting holes were designed to allow core gases to escape through the bottom surface, preventing gas defects. The top mold included the combustion chamber cavity and had multiple vent holes at the core print locations. This open structure made inspection after casting much easier, because the internal cavities were directly accessible.
The side mold was designed as a removable segment in the top mold to form the water jacket side cavities. Because 3D sand printing does not require draft angles, the water jacket core could be printed as part of the side mold, thus eliminating the need for a separate core positioning system. The key features of the 3D sand mold design are listed in Table 7.
| Mold Component | Design Feature | Benefit |
|---|---|---|
| Bottom mold | Integrated runner and bottom vent holes | Prevents core gas accumulation |
| Top mold | Combustion chamber cavity integrated; vent holes at core prints | Easy core gas evacuation; open geometry for cleaning |
| Side mold | Water jacket cavity printed as part of side mold | Eliminates separate water jacket core; accurate positioning |
| Monolithic inner core | One-piece core for all internal chambers | No core parting line; minimal assembly tolerance |
Figure 4 shows the final 3D sand mold assembly ready for printing. The mold was manufactured using a large-format industrial sand 3D printer with furan resin binder. The layer thickness was 0.3 mm, and the print resolution was 600 dpi. After printing, the sand molds were immediately used for casting without overnight curing, which is another advantage over conventional resin sand molds.
Production Validation
Following the completion of the 3D sand mold design and simulation verification, I carried out actual casting production. The mold was assembled, closed, and poured with HT300 melt at 1390 °C. The pouring operation was performed carefully to maintain the simulated filling time of about 38 seconds. After pouring, the mold was allowed to cool for 12 hours before shakeout.
Figure 5 shows the casting immediately after shakeout and the finished product after subsequent processing. The as-cast surface was smooth, with no obvious sand sticking or burn-on defects. The internal cavities were inspected using an endoscope. The walls were clean and free from misruns, cold shuts, and gas porosity. The dimensional accuracy was verified using a 3D scanning system. The critical combustion chamber profile deviations were within the user tolerance range. Table 8 summarizes the measured properties of the casting.
| Property | Measured Value | Requirement |
|---|---|---|
| Tensile strength (MPa) | 315 | > 300 |
| Hardness (HBW) | 238 | 220 – 275 |
| Graphite form | 90% flake | 85% – 95% flake |
| Pearlite | > 98% fine lamellar | > 98% |
| Shrinkage porosity | None detected | No leaks |
The reject rate was remarkably low. In the initial production batch of ten castings, all passed the pressure tightness test and dimensional inspection. The use of 3D sand printing allowed the entire development cycle to be shortened from the conventional four months to just three weeks, including design, simulation, printing, casting, and inspection. This dramatic reduction in lead time was due to the elimination of pattern tooling and the ability to iterate quickly on the digital model.
Discussion and Technical Insights
Through this project, I confirmed that 3D sand printing is not merely a prototyping tool but a viable production technology for complex automotive castings. The key enablers for success were the integrated core design and the simulation-driven optimization process. By combining 3D sand printing with Magema simulation, I could virtually test multiple design variants and converge to a robust process before committing to physical prints. This approach reduces cost and risk, especially for high-value cylinder heads.
The calculations presented throughout this paper illustrate the importance of conventional casting principles even when using advanced manufacturing methods. For instance, the gating ratio and choke area calculations still follow the classical laws of fluid mechanics. Tables 1 through 7 summarize the critical parameters that any foundry engineer needs to consider when adopting 3D sand printing for similar products.
One additional advantage I observed was the reduction in sand usage. Because the mold was printed with a precise shell-like structure, I could generate hollow cores and cored out sand sections to reduce material consumption. This not only lowers the cost of sand and binder but also decreases the environmental burden. The mechanical strength of the printed sand was sufficient to withstand the ferrostatic pressure, as verified by the smooth filling simulation and successful production run.
The thermal behavior during solidification deserves further discussion. In gray cast iron, the austenite–graphite eutectic transformation is accompanied by an expansion because graphite has a lower density than the liquid. This internal expansion can compensate for solidification shrinkage to some extent. Therefore, the riser sizing can be smaller than that for steel. However, the thin-walled areas of the cylinder head cool faster and become rigid before the hot spots solidify, reducing the effectiveness of autogenous feeding. This is why I placed chills in the lower thick sections to promote directional solidification toward the top risers. The simulation clearly showed that without the chills, the porosity level in the combustion chamber wall would have exceeded the acceptable limit.
In terms of process cost, although 3D sand printing has a higher initial consumable cost per kilogram than conventional resin sand molding, the overall project cost is lower for small batches and new product development because there is no need for wooden or metal patterns. In this specific case, the cost of a full set of patterns for a six-cylinder cylinder head would have been tens of thousands of dollars and taken four to six weeks to machine. With 3D sand printing, the mold cost was roughly 30% higher per casting, but the total cost including engineering iterations was actually lower due to the short timeline and zero pattern modification cost.
Another important observation was the quality of the internal cavity surface. The printed sand core had a Ra surface finish of about 6.3 to 12.5 microns, which is comparable to conventional resin-coated sand but without any parting line flash. The absence of core parting lines completely eliminated the fettling work inside the water jacket, which is a common source of defects and a difficult manual operation. The integrated one-piece core also removed the risk of core shift between multiple core prints, which is notoriously difficult to control in traditional production.
For the foundry industry, this work demonstrates that 3D sand printing can be effectively integrated into existing casting workflows. The compatibility with standard foundry binders, sands, and cooling practices is excellent. I did not need to alter the melt treatment, inoculation, or heat treatment procedures from those used in conventional casting. The only significant changes were in the mold design philosophy, where I could exploit the freedom to print internal cooling channels or reinforce thin sand walls with ribs that would otherwise require a core.
I also performed sensitivity analyses on the pouring temperature and filling time. Table 9 shows the effect of varying pouring temperature on the shrinkage porosity index obtained from simulation. A pouring temperature that is too high increases the risk of hot tears and penetration, while a temperature that is too low leads to cold shuts. The optimum window was quite narrow: 1385 – 1395 °C.
| Pouring Temperature (°C) | Shrinkage Porosity Index (%) | Risk of Cold Shuts |
|---|---|---|
| 1360 | 0.8 | High |
| 1390 | 0.2 | Low |
| 1420 | 1.1 | Low |
The filling time also influences the temperature gradient. A longer filling time allows more heat to be lost to the sand mold, which can freeze the thin walls prematurely. A shorter filling time increases the pressure speed and may cause erosion. The simulation-based optimization helped me achieve the right balance.
Furthermore, the use of a single-piece core had an unexpected benefit: the core resin gas evolution was significantly lower because the core volume was less than the sum of multiple split cores due to the elimination of interlocking core prints. The reduced gas volume made the venting design simpler and more reliable. The vents placed at the top core print locations were sufficient to evacuate all gases, and no gas-related defects were found in the final castings.
From a dimensional accuracy perspective, the 3D printed sand mold maintained excellent stability during casting. The sand mold’s coefficient of thermal expansion is low, and the binder degradation during metal pouring creates a slight collapsibility that reduces hot tearing. Measurements on the first production casting showed that the critical distance between the combustion chamber and the water jacket was within ±0.3 mm, which is better than the typical ±0.6 mm achievable with conventional molding.
I also compared the cooling rate in the printed sand mold with that of a conventional furan resin sand mold. Because the printed sand mold can have a tailored permeability and thermal conductivity by adjusting the nozzle saturation, I was able to control the heat extraction rate locally. This is a unique feature of 3D sand printing: the ability to modify material properties voxel by voxel. In my design, I printed the mold with a higher binder content in the cores that required greater strength and a lower binder content in the outer mold to improve collapsibility. This degree of local control is impossible with traditional sand molding.
One practical aspect that I should mention is the need for careful cleaning of the print heads and binder supply system. Since foundries are dusty environments, the 3D printer must be installed in a relatively clean room or have protective enclosures. During my project, I maintained a strict preventive maintenance schedule to ensure consistent print quality. The printer’s binder jetting system uses a fine resin that can crystallize if not properly flushed. I recommend using high-purity furan resin and periodic calibration of the print head nozzles.
The post-casting cleaning process was also simplified. Because the internal cores were printed as a single unit, they collapsed and flowed out during shakeout more readily than multiple bonded cores. The residue was easily removed by shot blasting. No manual chiseling was required in the water jacket area. This reduced the cleaning time by roughly 60% compared to conventional cores.
In conclusion, this research and development activity has proved the effectiveness of 3D sand printing for producing a heavy-duty truck cylinder head with complex internal geometry. The combination of Magema simulation and innovative mold design led to a casting process that met all mechanical, metallurgical, and dimensional requirements. The production trial was successful, with zero defects in the first batch. This process reduces development lead time, lowers tooling costs, and provides excellent flexibility for design modifications. I believe 3D sand printing will play an increasingly important role in the manufacturing of high-performance automotive castings, especially for new energy vehicles where lightweight and complex designs are becoming the norm.
Finally, I would like to highlight that the methodology described here is generic and can be extended to other similar castings such as cylinder blocks, transmission housings, and brake components. The key is to exploit the design freedom of 3D sand printing while still applying rigorous physical simulation and classical casting principles. The empirical formulas and design tables I have presented can serve as a baseline for engineers who are new to this technology. By combining the art of casting with the digital revolution, we can achieve faster, cheaper, and better manufacturing outcomes.