
In the present investigation, we systematically explored the integration of sand mold three-dimensional (3D) printing with conventional casting methodologies to address the increasing demands for complex, high-precision, and lightweight metallic components. The study was structured into four primary thrusts: (i) optimization of spatial grid architectures within printed sand molds using response surface methodology (RSM); (ii) design and numerical validation of a casting process for a thin-walled, complex ZL101A aluminum alloy housing; (iii) comparative evaluation of microstructural evolution and mechanical properties between traditionally molded and 3D-printed sand mold castings; and (iv) development of a multi-cavity, multi-piece layout strategy to enhance the sand utilization ratio within a single print job. Our findings demonstrate that a carefully engineered grid structure—specifically employing circular voids with a clearance of 3.7 mm and a structural element size of 4.8 mm—yields an optimal balance of properties: compressive strength of 3.82 MPa, flexural strength of 2.02 MPa, permeability of 236.2, and gas evolution of 10.6 mL/g. The integrated casting process, featuring an open gating system with ratio \( \Sigma A_{\text{直}} : \Sigma A_{\text{横}} : \Sigma A_{\text{内}} = 1 : 2 : 2.2 \), produced castings with only 0.045 cc of shrinkage porosity, entirely within non-critical regions. This process reduced lead time by approximately 75% compared to traditional methods. Furthermore, the T6 heat-treated samples from 3D-printed molds exhibited superior tensile strength (288 MPa) and elongation (2.8%) relative to those from conventional molds (249 MPa and 2.2%). Finally, a mixed-layout configuration accommodating 23 different sand molds (7 large and 16 small) within a single build volume achieved a sand utilization ratio of 72.04%, significantly improving printing efficiency and reducing material waste. This comprehensive study validates the considerable potential of integrating 3D printing sand casting with traditional foundry practices for the rapid, high-quality production of complex castings.
1. Introduction
Casting remains a cornerstone of mechanical manufacturing due to its inherent advantages of low cost and high adaptability. However, the relentless advancement of industries such as aerospace, defense, and automotive has imposed stringent requirements on product complexity, manufacturing flexibility, lightweight characteristics, and dimensional precision. Traditional casting methods often struggle to meet these demands, particularly for intricate geometries, leading to challenges in precise forming, material wastage, and environmental concerns. In response to these limitations, sand mold 3D printing has emerged as a transformative technology, offering digital, intelligent, and green manufacturing pathways. This technology enables the direct fabrication of complex cavities and cores, facilitating the integrated forming of components that were previously difficult or impossible to produce using conventional techniques. By combining the flexibility of additive manufacturing with established casting principles, we can achieve high-quality, rapid manufacturing of complex parts.
The primary challenges encountered when employing sand mold 3D printing are the relatively low strength and poor permeability of the printed molds, coupled with elevated gas generation. Moreover, inefficient utilization of the build volume often results in lower printing productivity. To address these critical issues, our research was conducted with the following objectives:
- To investigate the influence of grid structures—specifically the hole geometry, clearance size, and structural size—on the performance of printed sand molds.
- To design and validate a sand mold 3D printing casting process for a complex, thin-walled casting, complementing it with numerical simulation for process optimization.
- To assess the microstructural and mechanical characteristics of castings produced via both traditional and 3D-printed sand molds.
- To optimize the spatial arrangement of multiple sand molds within the printer to improve the mold-sand utilization ratio and enhance overall printing efficiency.
2. Technical Background and Literature Review
2.1 Principles of Sand Mold 3D Printing
Sand mold 3D printing primarily relies on binder jetting technology (3DP). The process involves spreading a thin layer of sand, pre-mixed with a curing agent, onto a build platform. A printhead selectively deposits a liquid binder, typically furan resin, onto the sand layer based on the digital model’s cross-sectional data. The binder reacts with the curing agent to form adhesive bridges between sand grains, binding them together to form a solid structure. The platform then descends by one layer thickness, and the process is repeated, building the mold layer-by-layer. This technique offers significant advantages, including the freedom from pattern tooling, high geometric flexibility, and the ability to produce molds with complex internal channels or integrated cores.
2.2 Advancements and Challenges in 3D Printed Sand Molds
Recent advancements in sand mold 3D printing have focused on improving mold quality and process efficiency. Research has investigated the effects of sand grain size, binder type, layer thickness, and post-processing parameters on mold properties. While the technology enables unprecedented design freedom, several challenges persist:
- Strength and Permeability: Printed molds often exhibit lower strength compared to conventionally compacted molds, due to the inability to apply mechanical compaction. Conversely, the high porosity can be an advantage for permeability, but excessive void space can compromise strength.
- Gas Evolution: The higher binder content necessary to ensure adequate strength can increase gas generation during pouring, leading to potential gas defects in the final casting.
- Build Efficiency: The build chamber must be efficiently utilized to maximize productivity and minimize material waste, especially for small to medium-sized castings.
To overcome these obstacles, researchers have explored various approaches, including the design of hollow or truss-like structures to reduce sand consumption and enhance heat dissipation, as well as process parameter optimization using statistical methods like RSM. Our work builds upon these foundations by systematically addressing the grid structure and multi-piece layout.
2.3 Numerical Simulation in Casting
Computer simulation has become an indispensable tool in modern casting development. Software packages such as ProCAST enable the virtual modeling of mold filling, solidification, and defect formation. By accurately simulating the casting process, this technology enables engineers to predict and mitigate issues such as shrinkage porosity, gas entrapment, and misruns before physical trials, thus considerably reducing the time-to-market and experimental costs. Simulation is particularly instrumental when designing gating systems, risers, and chill placements for complex alloy castings.
2.4 Multi-Piece Casting and 3D Printing
In traditional casting, the “one box, multiple pieces” method is a common strategy to increase productivity and reduce costs by casting several identical or different parts within a single mold assembly. However, this approach often requires complex gating systems and can be challenging to design manually. 3D printing alleviates these challenges by allowing the rapid creation of intricate, combined mold assemblies. To quantify the efficiency of build space utilization, we define a key performance indicator known as the mold-sand ratio (\( R_s \)), which is given by:
$$ R_s = \frac{V_m}{V_b} \times 100\% $$
where \( V_m \) is the volume of sand used to form the molds, and \( V_b \) is the total volume of the build box. A higher \( R_s \) indicates greater build efficiency, reduced waste, and increased productivity. The optimization of the spatial arrangement of molds within the printer is therefore crucial.
3. Experimental Materials and Methods
3.1 Materials
In this research, we utilized a typical silica sand for the mold-making process, combined with a furan resin binder and a sulfonic acid-based catalyst. The key properties of these materials are presented in Table 1, Table 2, and Table 3, respectively.
Table 1. Properties of the silica sand used.
| Parameter | Value |
|---|---|
| AFS fineness | 85-95 |
| Clay content (%) | 0.1-0.15 |
| Moisture content (%) | ≤0.2 |
| SiO₂ content (%) | >90 |
| Bulk density (g/cm³) | ≥1.3 |
Table 2. Properties of furan resin binder.
| Parameter | Value |
|---|---|
| Density (g/cm³) | 1.12-1.18 |
| Viscosity (mPa·s) | 5-20 |
| Conductivity (μs/cm) | ≤20 |
| Surface tension (mN/m) | 35-40 |
| Primary component | Furfuryl alcohol |
Table 3. Properties of the curing agent.
| Parameter | Value |
|---|---|
| Total acid content (%) | 25.5-26.5 |
| Density (g/cm³) | 1.30-1.35 |
| Viscosity (mPa·s) | 20-40 |
| Free sulfuric acid (%) | <2.5 |
3.2 Equipment
The primary equipment used in this study is listed in Table 4 below. All printing experiments were conducted using a DZ2000C sand mold 3D printer, which has a maximum build volume of 2000 mm × 1100 mm × 800 mm.
Table 4. List of key equipment used in the experiments.
| Equipment | Model | Manufacturer |
|---|---|---|
| Sand 3D Printer | DZ2000C | Shanxi Deze Co., Ltd. |
| Universal sand strength tester | SWY-IIIS | Nanjing Hengrui Instruments |
| Gas evolution tester | SFL-IIS | Nanjing Hengrui Instruments |
| Permeability tester | STD-III | Nanjing Hengrui Instruments |
| Moisture analyzer | LC-DHC-20A | Nanjing Hengrui Instruments |
| Scanning Electron Microscope (SEM) | IE500M | Shunyu Optical (Group) Co., Ltd. |
| Sieve shaker | SSD-II | Nanjing Hengrui Instruments |
3.3 Sand Mold Printing
Sand molds were designed using Siemens NX software and exported as STL files. The STL file was then imported into the printer’s control software, where the slicing and support generation were performed. The printing parameters, including the layer thickness, were set to 0.5 mm. The printed molds were allowed to cure in the build box for a period to acquire sufficient green strength before handling. Subsequently, the molds were removed from the build box and cleaned using compressed air to remove any loose sand particles. For casting trials, the molds were then coated with a refractory coating, dried in an oven at 90°C for 1 hour, and assembled for pouring.
3.4 Testing of Sand Mold Properties
Standard specimens were printed to evaluate the mechanical and physical properties of the molds.
- Compressive Strength: Cylindrical specimens (50 mm diameter × 50 mm height) were tested using the SWY-IIIS strength tester.
- Flexural Strength: Standard rectangular beams (151 mm long) were tested under three-point bending.
- Gas Evolution: A 1 g sample of the mold material was heated to 850°C for 120 seconds in a gas evolution tester.
- Permeability: Cylindrical specimens were placed in a specialized holder, and the air flow rate through the specimen was measured.
5. Casting Experiment and Heat Treatment
The casting alloy used in this study was ZL101A aluminum alloy. Its chemical composition is given in Table 5. The alloy was melted in a medium-frequency induction furnace. After melting, the melt was refined, and a grain refiner (Al-5Ti-B) and a modifier (La/Ce-based rare earth) were added. The melt was degassed and skimmed before pouring at 725°C.
Table 5. Chemical composition of ZL101A alloy (wt. %).
| Si | Mg | Ti | Zr | Sr | Al |
|---|---|---|---|---|---|
| 6.909 | 0.359 | 0.163 | 0.049 | 0.011 | Balance |
The T6 heat treatment process involved solution treatment at 520°C for 2 hours, followed by quenching in 80°C water, and subsequent artificial aging at 200°C for 3 hours, followed by air cooling.
4. Optimizing Spatial Grid Structure in 3D Printed Sand Molds
4.1 Influence of Grid Geometry
In this section, we investigated the effect of different void geometries on the properties of printed sand molds. Circular, square, and hexagonal voids, each with a characteristic size of 5 mm and a constant clearance of 3 mm, were designed into standard test specimens. The results are summarized in Table 6.
Table 6. Performance comparison of sand molds with different hole structures.
| Hole Structure | Compressive Strength (MPa) | Bending Strength (MPa) | Gas Evolution (mL/g) | Permeability |
|---|---|---|---|---|
| Solid (reference) | 4.726 | 2.687 | 12.35 | 104.3 |
| Circle (5 mm) | 3.316 | 1.818 | 10.80 | 233.5 |
| Square (5 mm circumcircle) | 3.144 | 1.621 | 10.89 | 231.6 |
| Hexagon (5 mm circumcircle) | 2.769 | 1.474 | 11.01 | 220.5 |
As observed in Table 6, the circular void design exhibited the most favorable combination of properties, providing a higher strength and permeability compared to square and hexagonal geometries, while also emitting marginally less gas. Therefore, circular voids were selected for subsequent experiments.
4.2 Influence of Clearance Size
We then studied the effect of the clearance (wall thickness) between the voids. Specimens with circular, square, and hexagonal voids were printed with clearances ranging from 1 mm to 5 mm. The results for the circular structure are depicted in Figure 3. In general, both compressive and bending strengths increased with increasing clearance, while gas evolution also increased, and permeability decreased. This is attributed to the larger amount of binder and curing agent required for thicker walls, which enhances bonding but also increases organic content. The results are presented below (for circular structure).
$$ \text{Compressive Strength} \approx 2.26 \text{ MPa (at 1 mm)} \rightarrow 4.26 \text{ MPa (at 5 mm)} $$
$$ \text{Bending Strength} \approx 1.21 \text{ MPa (at 1 mm)} \rightarrow 2.02 \text{ MPa (at 5 mm)} $$
$$ \text{Gas Evolution} \approx 10.18 \text{ mL/g (at 1 mm)} \rightarrow 10.81 \text{ mL/g (at 5 mm)} $$
$$ \text{Permeability} \approx 245.2 \text{ (at 1 mm)} \rightarrow 233.5 \text{ (at 5 mm)} $$
These trends were consistent across all three void geometries, with the circular structure consistently demonstrating the highest strength and permeability.
4.3 Influence of Structural Size (Void Diameter)
Herein, we investigated the effect of the structural size (void dimension) on mold performance. Circular voids with diameters of 3, 4, 5, 6, and 7 mm were created while maintaining a clearance of 3 mm. The results are presented below.
As the void size increased, the strength of the mold decreased. This is because larger voids reduce the quantity of binder-bridged sand, thereby diminishing the load-bearing capability. Interestingly, gas evolution and permeability showed a minimum and maximum, respectively, at a void size of 5 mm. This can be attributed to the competing effects of reduced binder content and the geometric shape of the remaining structure. Consequently, an intermediate structural size of 5 mm was selected.
4.4 Response Surface Methodology (RSM) Optimization
To systematically optimize the grid parameters and their interactions, we employed Box-Behnken design (BBD) with RSM. The factor levels are detailed in Table 7, and the experimental matrix and measured responses are shown in Table 8.
Table 7. Factor levels used in the Box-Behnken design.
| Factor | Code | -1 Level | 0 Level | +1 Level |
|---|---|---|---|---|
| Hole Structure | A | Square | Round | Hexagon |
| Clearance Size (mm) | B | 2 | 3 | 4 |
| Structure Size (mm) | C | 4 | 5 | 6 |
Table 8. Box-Behnken design matrix and experimental results.
| Run | A | B | C | Compressive Strength (MPa) | Bending Strength (MPa) | Gas Evolution (mL/g) | Permeability |
|---|---|---|---|---|---|---|---|
| 1 | -1 | -1 | 0 | 2.628 | 1.36 | 10.63 | 235.0 |
| 2 | 0 | 0 | 0 | 3.273 | 1.813 | 10.81 | 231.9 |
| 3 | 0 | -1 | 1 | 2.549 | 1.369 | 10.76 | 223.8 |
| 4 | 1 | 0 | -1 | 2.989 | 1.659 | 11.37 | 220.0 |
| 5 | -1 | 1 | 0 | 3.423 | 1.903 | 10.75 | 231.2 |
| 6 | 1 | -1 | 0 | 2.433 | 1.288 | 10.79 | 231.1 |
| 7 | 0 | 0 | 0 | 3.306 | 1.830 | 10.79 | 232.4 |
| 8 | 0 | 0 | 0 | 3.362 | 1.796 | 10.78 | 233.4 |
| 9 | 1 | 0 | 1 | 2.395 | 1.422 | 11.20 | 209.8 |
| 10 | -1 | 0 | -1 | 3.429 | 1.779 | 11.24 | 222.1 |
| 11 | 0 | 0 | 0 | 3.259 | 1.816 | 10.83 | 234.5 |
| 12 | 0 | 0 | 0 | 3.398 | 1.835 | 10.82 | 233.5 |
| 13 | 0 | 1 | -1 | 3.937 | 2.010 | 11.11 | 229.6 |
| 14 | 0 | 1 | 1 | 3.587 | 1.844 | 10.93 | 221.3 |
| 15 | 1 | 1 | 0 | 3.206 | 1.768 | 11.08 | 228.5 |
| 16 | -1 | 0 | 1 | 2.605 | 1.538 | 11.09 | 219.0 |
| 17 | 0 | -1 | -1 | 3.239 | 1.615 | 10.89 | 227.0 |
4.4.1 Regression Model and ANOVA
Statistical analysis using ANOVA was conducted to identify the significant factors and their interactions for each response. The resulting quadratic regression equations are provided below in terms of the coded factors.
$$ Y_1 (\text{Compressive Strength}) = 3.3196 – 0.13275A + 0.413B – 0.30725C – 0.0055AB + 0.0575AC + 0.085BC – 0.4353A^2 + 0.382B^2 – 0.0298C^2 $$
$$ Y_2 (\text{Bending Strength}) = 1.818 – 0.055375A + 0.23663B – 0.11125C – 0.01575AB + 0.001AC + 0.02BC – 0.17413A^2 – 0.064125B^2 – 0.044375C^2 $$
$$ Y_3 (\text{Gas Evolution}) = 10.806 + 0.06625A + 0.125B – 0.07875C – 0.0075AB – 0.005AC – 0.0125BC + 0.1795A^2 – 0.123B^2 + 0.2395C^2 $$
$$ Y_4 (\text{Permeability}) = 233.14 – 2.2375A – 0.7875B – 3.15C + 0.3AB – 1.775AC – 1.275BC – 4.6955A^2 + 3.005B^2 – 10.72C^2 $$
For compressive strength, the model had an \( R^2 \) of 0.9866 and an adjusted \( R^2 \) of 0.9693, indicating excellent fit. The ANOVA (Table 9) shows that all linear factors (A, B, C), the quadratic term \( A^2 \), and the interaction terms have significant effects, with a clear influence hierarchy of \( B > C > A \).
Table 9. ANOVA for compressive strength.
| Source | Sum of Squares | df | Mean Square | F-Value | p-value |
|---|---|---|---|---|---|
| Model | 3.11 | 9 | 0.35 | 57.05 | <0.0001 |
| A | 0.14 | 1 | 0.14 | 23.25 | 0.0019 |
| B | 1.36 | 1 | 1.36 | 225.06 | <0.0001 |
| C | 0.76 | 1 | 0.76 | 124.56 | <0.0001 |
| AB | 0.0001 | 1 | 0.0001 | 0.020 | 0.8916 |
| AC | 0.013 | 1 | 0.013 | 2.18 | 0.1832 |
| BC | 0.029 | 1 | 0.029 | 4.77 | 0.0653 |
| A² | 0.80 | 1 | 0.80 | 131.59 | <0.0001 |
| B² | 0.0061 | 1 | 0.0061 | 1.01 | 0.3476 |
| C² | 0.0037 | 1 | 0.0037 | 0.62 | 0.4580 |
Similar ANOVA analyses were conducted for bending strength, gas evolution, and permeability. For permeability, the interaction between hole structure (A) and structure size (C) was found to be the most significant interaction, as evidenced by its lower p-value.
4.4.2 Parameter Optimization and Validation
Numerical optimization was performed to determine the factor levels that maximize compressive strength, bending strength, and permeability, while minimizing gas evolution. The optimal solution was found to be: circular hole structure (A=0), clearance size of 3.67 mm, and structure size of 4.76 mm. For practical application, these values were adjusted to 3.7 mm and 4.8 mm, respectively. The predicted properties at these settings were compressive strength 3.81 MPa, bending strength 2.01 MPa, gas evolution 10.8 mL/g, and permeability 235.9. We then conducted confirmation experiments, and the results are presented in Table 10.
Table 10. Confirmation experiment results at optimized parameters.
| Sample No. | Hole Structure | Clearance (mm) | Structure Size (mm) | Compressive Strength (MPa) | Bending Strength (MPa) | Gas Evolution (mL/g) | Permeability |
|---|---|---|---|---|---|---|---|
| 1 | Circle | 3.7 | 4.8 | 3.78 | 2.06 | 10.9 | 235.7 |
| 2 | Circle | 3.7 | 4.8 | 3.81 | 2.03 | 10.8 | 236.3 |
| 3 | Circle | 3.7 | 4.8 | 3.85 | 1.98 | 10.1 | 236.5 |
| 4 | Circle | 3.7 | 4.8 | 3.87 | 2.04 | 10.5 | 235.9 |
| 5 | Circle | 3.7 | 4.8 | 3.79 | 1.99 | 10.7 | 236.6 |
| Average | 3.82 | 2.02 | 10.6 | 236.2 |
The experimental results align well with the predicted values, demonstrating the reliability of the RSM model for optimizing 3D printing sand casting molds.
5. Development and Simulation of the 3D Printing Casting Process
5.1 Characteristics of the Thin-Walled Casting
The target component is a complex, thin-walled, non-symmetrical casting with dimensions of approximately 145 mm × 125 mm × 130 mm. It features a maximum wall thickness of 18 mm, a minimum wall thickness of 2 mm, and an average wall thickness of roughly 5.5 mm. The casting’s intricate geometry, with numerous projections, makes it challenging to produce by traditional molding. The mass of the casting, calculated with a density of 2.68 g/cm³ for ZL101A, is approximately 0.6 kg, keeping the total metal weight for the gating system around 1.51 kg.
5.2 Design of the Gating System
Given the high susceptibility of aluminum alloys to oxidation and rapid temperature loss, we opted for an open gating system where the cross-sectional area progressively increases from sprue to runner to ingate. The chosen area ratio was \( \Sigma A_{\text{sprue}} : \Sigma A_{\text{runner}} : \Sigma A_{\text{ingate}} = 1 : 2 : 2.2 \). The minimum cross-sectional area of the ingate (\( A_{\text{ingate}} \)) was calculated using the following formula:
$$ A_{\text{ingate}} = \frac{G_L}{\rho_L \mu t \sqrt{2 g h_p}} $$
where \( G_L \) is the total weight of the liquid metal (including gating system, approx. 2.5 kg), \( \rho_L \) is the density, \( \mu \) is the flow loss coefficient, \( t \) is the pouring time, and \( h_p \) is the effective pressure head. The effective pressure head is given by:
$$ h_p = \frac{k_2^2}{1 + k_1^2 + k_2^2} H_p $$
where \( k_1 \) and \( k_2 \) are the area ratios between sprue/runner and sprue/ingate, respectively. The average static pressure head \( H_p \) for bottom gating was calculated as \( H_p = H_0 – 0.5 h_c \), with \( H_0 \) being the total height of the sprue and pouring cup, and \( h_c \) the casting height. Pouring time was estimated using the empirical equation:
$$ t = S \sqrt{G_C} $$
For small aluminum castings (<2 kg), the coefficient S is 2.3. This yielded a pouring time of about 4 seconds and an ingate area of approximately 3.2 cm². The final gating system design is illustrated in subsequent figures.
5.3 Numerical Simulation of Initial Design
The initial casting design, including the pouring cup, sprue, runner, and six ingates, was modeled in UG NX. This geometry was then imported into ProCAST for meshing. A box of 200 mm × 200 mm × 200 mm was used to represent the sand mold. The casting and gating system were meshed with 5 mm elements, while the mold used 20 mm elements. The simulation parameters are listed in Table 11.
Table 11. Simulation parameters used in ProCAST.
| Parameter | Value |
|---|---|
| Pouring temperature | 725°C |
| Pouring time | 4 s |
| Mold material | Resin Bonded Sand |
| Interface heat transfer coefficient (mold/casting) | 500 W/(m²·K) |
| Heat transfer coefficient (casting/chill) | 2000 W/(m²·K) |
| Casting alloy | EN AC-42100 (AlSi7Mg0.3) |
The filling simulation of the initial design revealed a stable and smooth mold filling process, with the mold filling in approximately 4.6 seconds. However, the solidification simulation indicated that isolated liquid pools formed in the thicker sections. These regions remained molten after the surrounding thinner sections had solidified, leading to a lack of feeding and a high potential for shrinkage porosity. The simulation predicted a total defect volume of 0.102 cc, as summarized in Table 12.
5.4 Optimization of Casting Process
To mitigate the solidification shrinkage defects, we modified the casting design by strategically placing chills and risers. Since the initial design showed stable filling, the bottom-gating system was retained. We added three chills at the bottom, one at a complex central location, and three chills on the top thick sections. In addition, we enlarged the top riser and added three blind risers to improve feeding. These features were positioned as shown in Figure 7.
After implementing these modifications, we repeated the simulation. The optimized filling process remained similar in duration (~4.6 s). The solidification sequence was significantly improved: the presence of chills promoted directional solidification from the extremities towards the risers. The enlarged and additional risers effectively fed the isolated thick sections. As a result, the total shrinkage porosity volume decreased dramatically to 0.045 cc, a 55.88% reduction. The final simulation results comparing the initial and optimized designs are presented in Table 12. Crucially, the porosity that remained was located in the gating system and non-critical areas of the casting, ensuring the structural integrity of the component.
Table 12. Comparison of simulated defects between initial and optimized designs.
| Parameter | Initial Design | Optimized Design |
|---|---|---|
| Total porosity volume (cc) | 0.102 | 0.045 |
| Porosity weight (mg) | 0.122 | 0.054 |
5.5 Rapid Casting Using 3D Printed Sand Molds
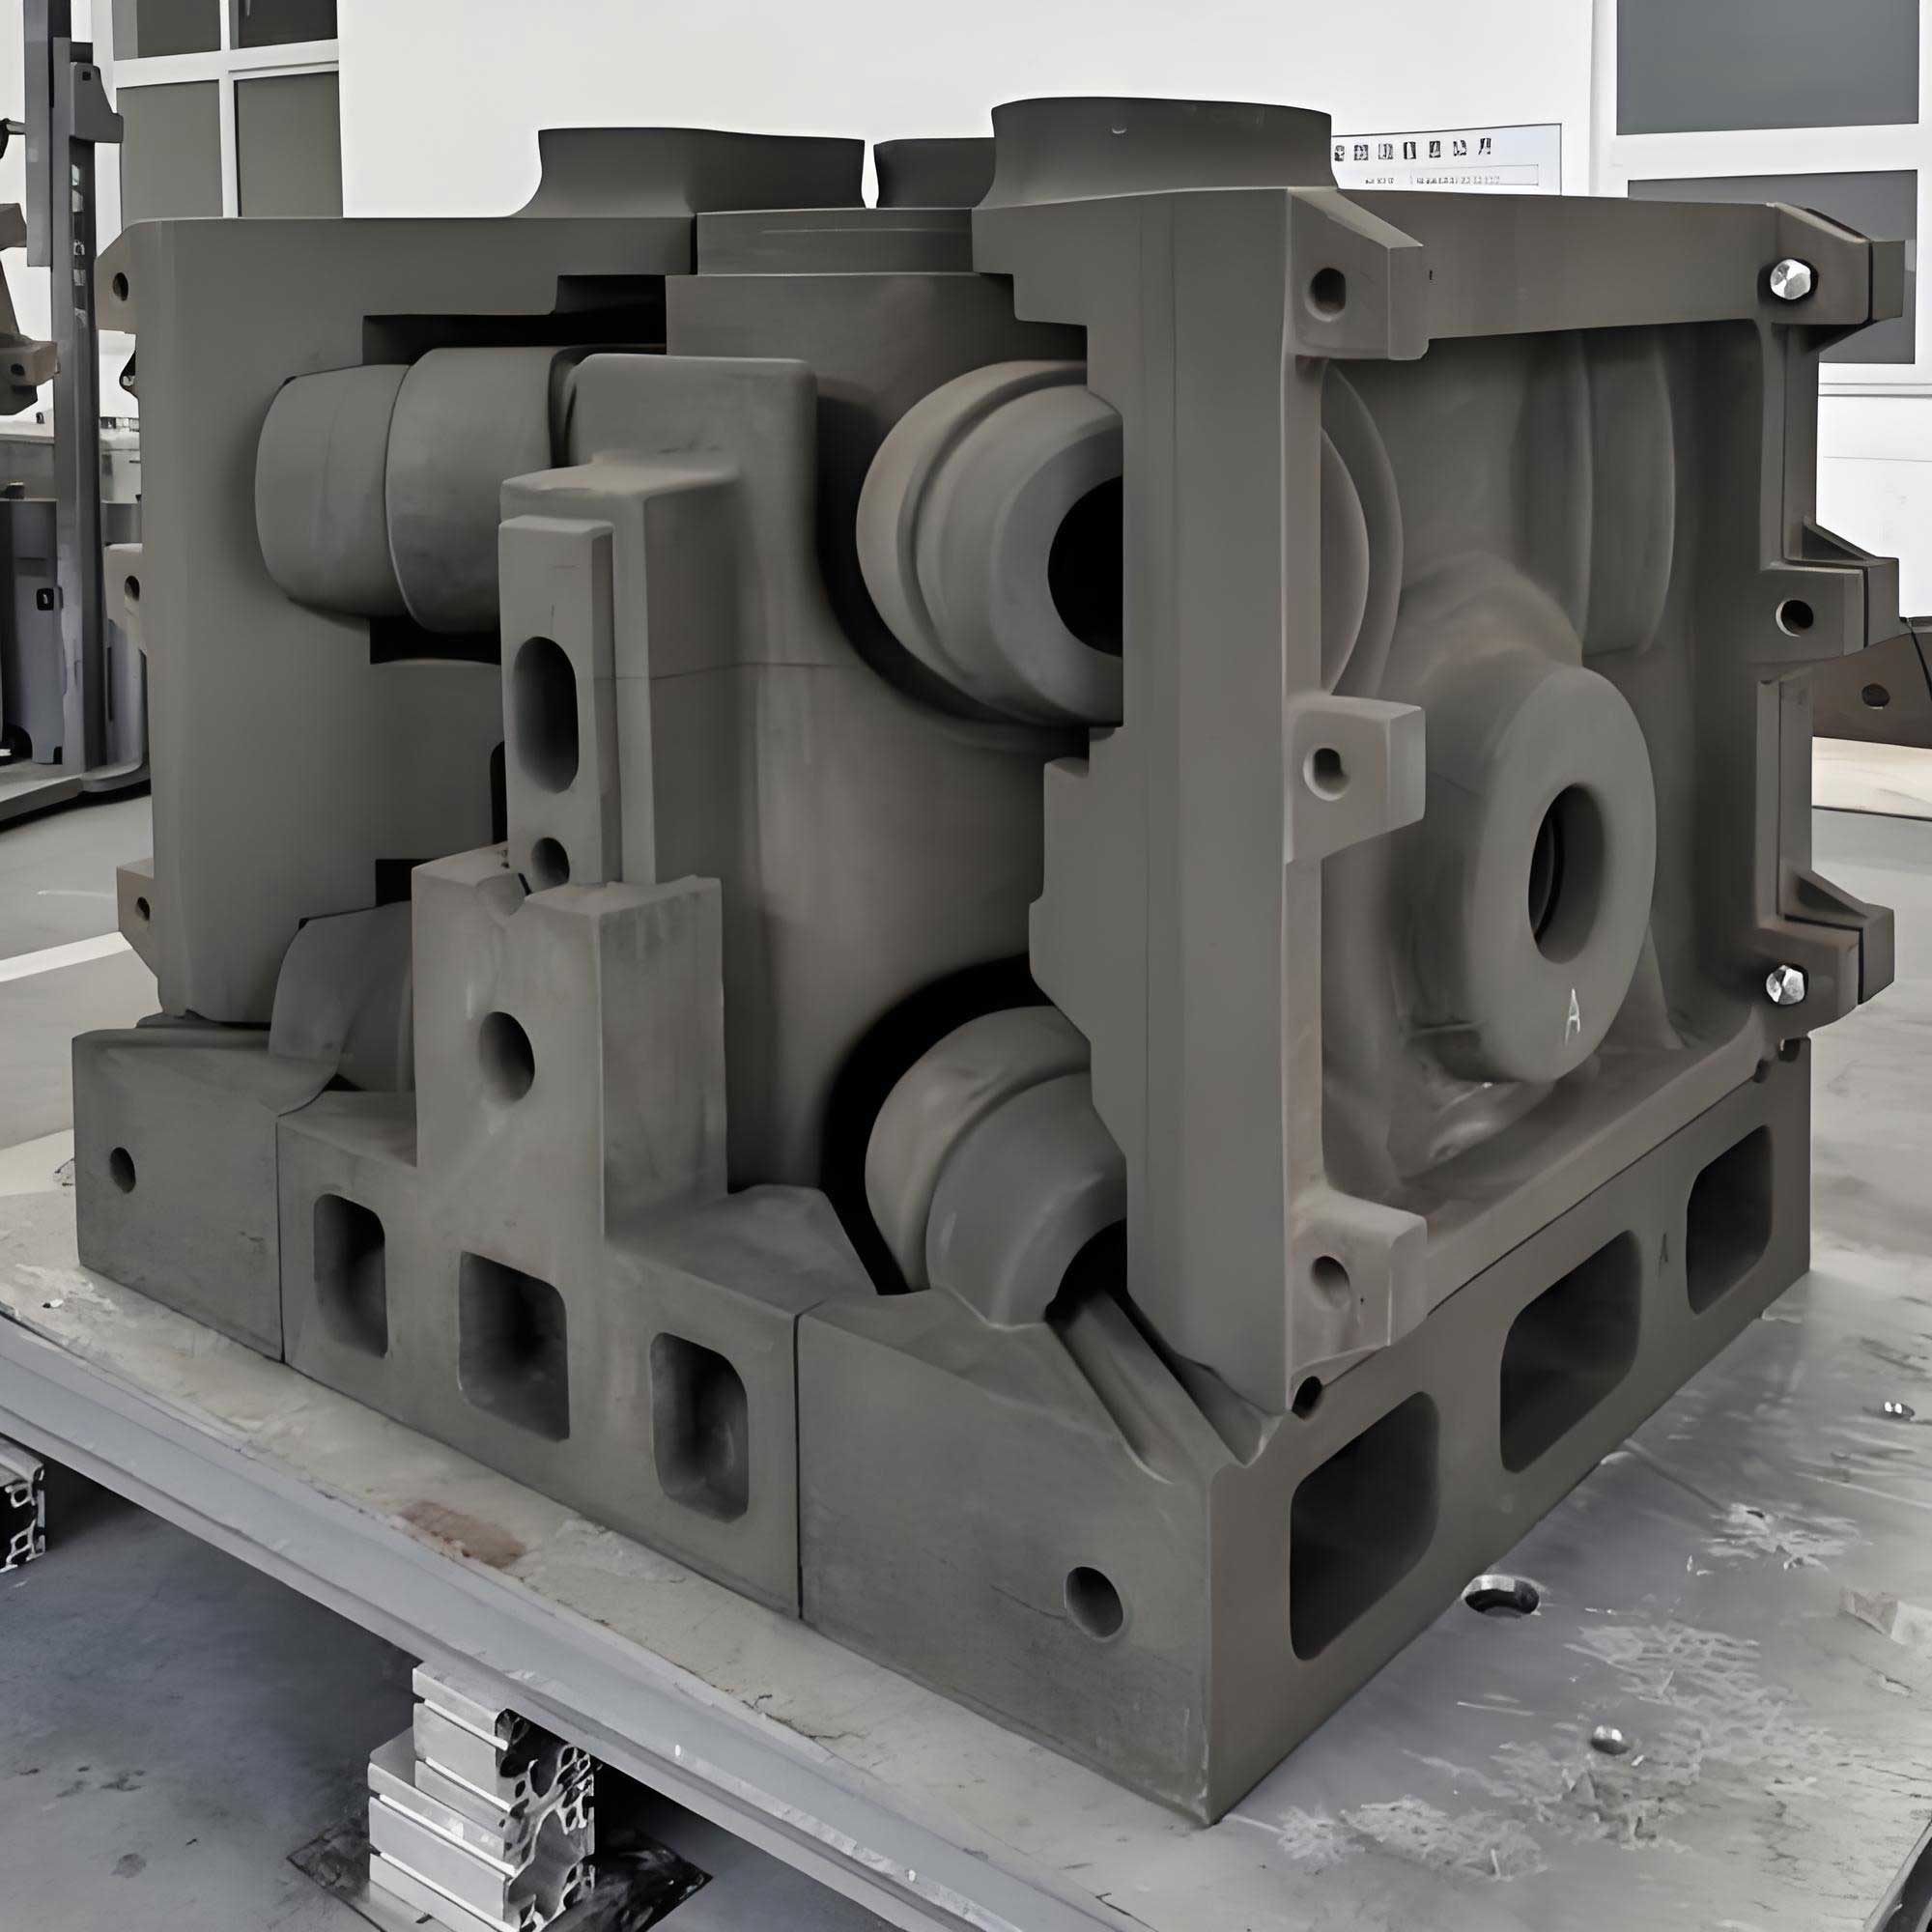
The optimized casting process with the gating system and risers was used to design the 3D printed sand mold assembly. The mold was divided into four parts to facilitate assembly and core placement, as schematically illustrated in Figure 11. These parts featured precise locating pins and slots to ensure accurate alignment. A shrinkage allowance of 1% was applied to the model.
The sand molds were printed using the optimized grid structure (as per Section 6) to minimize weight and enhance permeability. The printing of all four parts took approximately 6 hours. After printing, the molds were cleaned, coated with a refractory wash, and dried. They were then assembled with the chills and a filter placed in the runner system.
The assembly was preheated to 100°C for 2 hours, and approximately 1.51 kg of ZL101A aluminum melt was poured. After casting, the mold was allowed to cool for 30 minutes before being broken out. The resulting casting exhibited a smooth surface finish with no visible defects. Subsequent X-ray inspection (or dye penetrant testing) did not reveal any internal porosity or cracks in critical areas. The entire rapid casting process, from design to finished part, was completed in just 3 days, which is significantly shorter than the traditional prototyping route.
5.6 Microstructure and Mechanical Properties Comparison
To further evaluate the efficacy of 3D printing sand casting, we produced test samples using both traditional silica sand molds and 3D-printed sand molds under identical casting conditions. Samples were sectioned and prepared for microstructural analysis in both as-cast and T6 heat-treated states, as shown in Figure 14.
In both molding conditions, the as-cast microstructure consisted of primary α-Al dendrites with a needle-like eutectic silicon phase distributed in the interdendritic regions. After T6 treatment, the eutectic silicon spheroidized and became more rounded, a typical morphological evolution that contributes to improved ductility and strength. Notably, the 3D-printed mold castings exhibited a finer secondary dendrite arm spacing (SDAS). The secondary dendrite arm spacing was measured using the intercept method:
$$ d = \frac{\sum_{i=1}^{m} \frac{l_i}{n_i-1}}{m} $$
where \( l_i \) is the line intercept length, \( n_i \) is the number of dendrite arms intercepted, and \( m \) is the number of measurements. The finer SDAS in the 3D printed mold samples indicates a faster cooling rate, which is attributed to the higher thermal diffusivity and the potentially thinner walls of the grid-structured mold, facilitating quicker heat dissipation. This finer microstructure typically promotes better mechanical properties.
Tensile tests were conducted on T6-treated specimens. The results are presented in Table 13. The 3D-printed mold castings exhibited a higher ultimate tensile strength (US) of 288 MPa and higher elongation of 2.8% compared to the traditional mold castings, which achieved 249 MPa and 2.2%. This corresponds to a strength increase of nearly 16% and a notable improvement in ductility. A Weibull analysis of the tensile data, if available, would further confirm the improved reliability. The tensile fracture surfaces, as shown in Figure 15, indicated a mixed-mode fracture in both cases. However, the traditional-mold samples displayed more pronounced cleavage facets, suggesting more brittle behavior, whereas the 3D print samples showed a higher density of dimples, which is consistent with their higher ductility.
Table 13. Tensile properties of ZL101A alloy under different molding methods (T6 condition).
| Molding Method | Heat Treatment | Ultimate Tensile Strength (MPa) | Elongation (%) |
|---|---|---|---|
| Traditional Sand Mold | T6 | 249 | 2.2 |
| 3D Printed Sand Mold | T6 | 288 | 2.8 |
The improved performance of the castings from 3D-printed molds is a direct result of the finer and more uniform microstructure. This demonstrates that the 3D printing sand casting approach is not only capable of producing complex geometries but can also provide enhanced material properties, making it advantageous for high-performance applications.
6. Space Layout Optimization for Multiple Pieces in One Box
6.1 Definition and Significance of Mold-Sand Ratio
As previously defined, the mold-sand ratio (\( R_s \)) is crucial for 3D printing economics. A higher ratio signifies better utilization of the build chamber, which leads to reduced material waste and enhanced productivity. For small to medium-sized sand molds, optimizing the spatial layout is essential to maximize this ratio. In this section, we describe the layout strategies for a single thin-walled casting and a larger multi-way valve casting, both designed for “one-box-multiple-pieces” printing.
6.2 Layout of Thin-Walled Castings
The thin-walled casting’s sand mold had a size of 410 mm × 350 mm × 201 mm, designed to hold six castings per box. We explored three distinct layout arrangements to optimize the use of the 2000 mm × 1100 mm × 800 mm build volume. The results are summarized in Table 14.
Table 14. Layout alternatives for thin-walled casting sand molds.
| Layout Type | Description | Number of Molds | Mold-Sand Ratio (%) |
|---|---|---|---|
| Horizontal (1) | 3 columns × 5 rows × 2 layers | 30 | 49.17 |
| Horizontal (2) | 3 columns × 4 rows × 3 layers | 36 | 59.00 |
| Vertical (1) | 1 column × 9 rows × 3 layers | 27 | 44.25 |
| Vertical (2) | 4 columns × 9 rows × 1 layer | 36 | 59.00 |
| Mixed (1) | Horizontal 3 layers + Vertical 2 layers | 40 | 65.55 |
| Mixed (2) | 2 layers, 22 molds per layer | 44 | 72.11 |
We found that the mixed layout (2) provided the highest mold-sand ratio at 72.11%, significantly outperforming the horizontal and vertical arrangements.
6.3 Layout of Multi-way Valve Castings
The multi-way valve casting, intended for ductile iron, was a larger component. Its sand mold had dimensions of 750 mm × 600 mm × 256 mm and was designed to hold four castings per box. Although the mold dimensions are larger, the build volume allows for a high degree of flexibility. Table 15 summarizes the layout options explored.
Table 15. Layout alternatives for multi-way valve casting sand molds.
| Layout Type | Description | Number of Molds | Mold-Sand Ratio (%) |
|---|---|---|---|
| Horizontal (1) | 3 columns × 2 rows × 1 layer | 6 | 39.27 |
| Horizontal (2) | 3 columns × 3 rows × 1 layer | 9 | 58.91 |
| Vertical (1) | 1 column × 7 rows × 1 layer | 7 | 45.82 |
| Vertical (2) | 4 columns × 2 rows × 1 layer | 8 | 52.36 |
| Vertical (3) | 4 columns × 3 rows × 1 layer | 12 | 78.55 |
| Mixed (1) | Horizontal 3 layers + Vertical 1 layer | 10 | 65.45 |
| Mixed (2) | Horizontal 3 layers + Vertical 1 layer | 12 | 78.55 |
Again, the vertical layout (3) and mixed layout (2) achieved the highest mold-sand ratio of 78.55%, showcasing the advantage of stacking molds vertically.
6.4 Mixed Casting Layout for Different Components
In a final optimization, we explored the concurrent printing of different castings (thin-walled aluminum housing and multi-way valve ductile iron) in the same build box. This approach is highly beneficial for foundries with diverse order demands. The layout, shown in Figure 22, was designed around the large multi-way valve molds, with the smaller thin-walled molds occupying the remaining spaces. Our final configuration placed 7 large molds and 16 small molds, totaling 23 molds in one build cycle, achieving a mold-sand ratio of 72.04%. While this ratio is slightly lower than the 78.55% achieved with a homogeneous layout, it offers significant operational advantages, such as the ability to produce multiple different components simultaneously, reducing lead times and increasing overall flexibility.
7. Conclusions
Our comprehensive investigation into the development and application of 3D printing sand casting for complex castings yielded the following key conclusions:
- Grid Structure Optimization: The use of a spatial grid structure in sand molds significantly impacts their properties. Among the tested geometries, circular voids provided the best overall performance. Through Box-Behnken RSM, we established regression models for compressive strength, bending strength, gas evolution, and permeability. The optimal parameters were identified as a circular hole structure, a clearance size of 3.7 mm, and a structural size of 4.8 mm. The experiment at these settings produced a compressive strength of 3.82 MPa, bending strength of 2.02 MPa, permeability of 236.2, and gas evolution of 10.6 mL/g, closely matching the model predictions. This optimized grid structure allows for a significant reduction in material consumption and an increase in permeability without compromising the mold’s structural integrity.
- Combined Casting Process: The developed casting process for the thin-walled casting, which involved an optimized open gating system, risers, and chills, produced numerically sound results. Simulation accurately predicted a filling time of 4.6 s for the casting and a final shrinkage porosity volume of only 0.045 cc, confined to non-critical regions. The experimental casting production time was only 3 days, a reduction of ~75% compared to traditional methods, demonstrating the formidable advantage of this combined approach in terms of development speed.
- Superior Material Properties: The castings produced from 3D-printed molds exhibited a finer and more uniform microstructure than those from traditional molds. Consequently, the T6-treated samples from 3D-printed molds showed superior tensile properties (UTS 288 MPa, elongation 2.8%) compared to their traditionally molded counterparts (UTS 249 MPa, elongation 2.2%). This underscores that 3D printing sand casting not only enables complex geometries but also results in enhanced mechanical performance.
- Enhanced Production Efficiency: We successfully demonstrated the “one-box-multiple-pieces” strategy within layer-by-layer printing. For the thin-walled casting, a mixed layout achieved a mold-sand ratio of 72.11%. For the larger multi-way valve casting, a highest possible ratio of 78.55% was achieved. Crucially, we showcased a mixed layout for two distinct castings, achieving a highly commendable mold-sand ratio of 72.04% while printing 23 pieces. This strategy significantly improves build-volume utilization, reduces material waste, and increases the throughput of the 3D printer.
8. Future Outlook
While our study has successfully addressed several significant challenges in sand mold 3D printing, certain areas warrant further investigation. For example, more complex sand core designs with integrated structures could benefit from further optimization to improve their drop-in assembly robustness and prevent damage during transport. The potential of integrating multiple different materials (e.g., different sand types or binders) within a single print job is another promising avenue for extending the capabilities of this technology. Continued advances in printer technology and material formulations will undoubtedly broaden the adoption of this remarkable manufacturing approach across more demanding industrial sectors.
Keywords: 3d printing sand casting, sand mold 3D printing, casting process design, numerical simulation, response surface method, one-box-multiple-pieces, aluminum alloy