
In my research, the technology of 3D printing sand casting has been systematically investigated from the perspective of process parameter optimization, casting design, numerical simulation, and production efficiency enhancement. The casting industry has long been a fundamental pillar of mechanical manufacturing, offering advantages such as low cost and high adaptability. However, with the rapid advancement of industries such as aerospace, national defense, and marine engineering, traditional casting methods face significant challenges in producing highly complex, precise, and lightweight components. It was this pressing industrial demand that motivated my research into how 3D printing sand casting technology can overcome these limitations. The core of my work involved using binder jetting additive manufacturing to directly fabricate sand molds, eliminating the need for expensive and time-consuming tooling, while enabling the production of complex geometries that would be impossible or extremely difficult to achieve using conventional mold-making techniques.
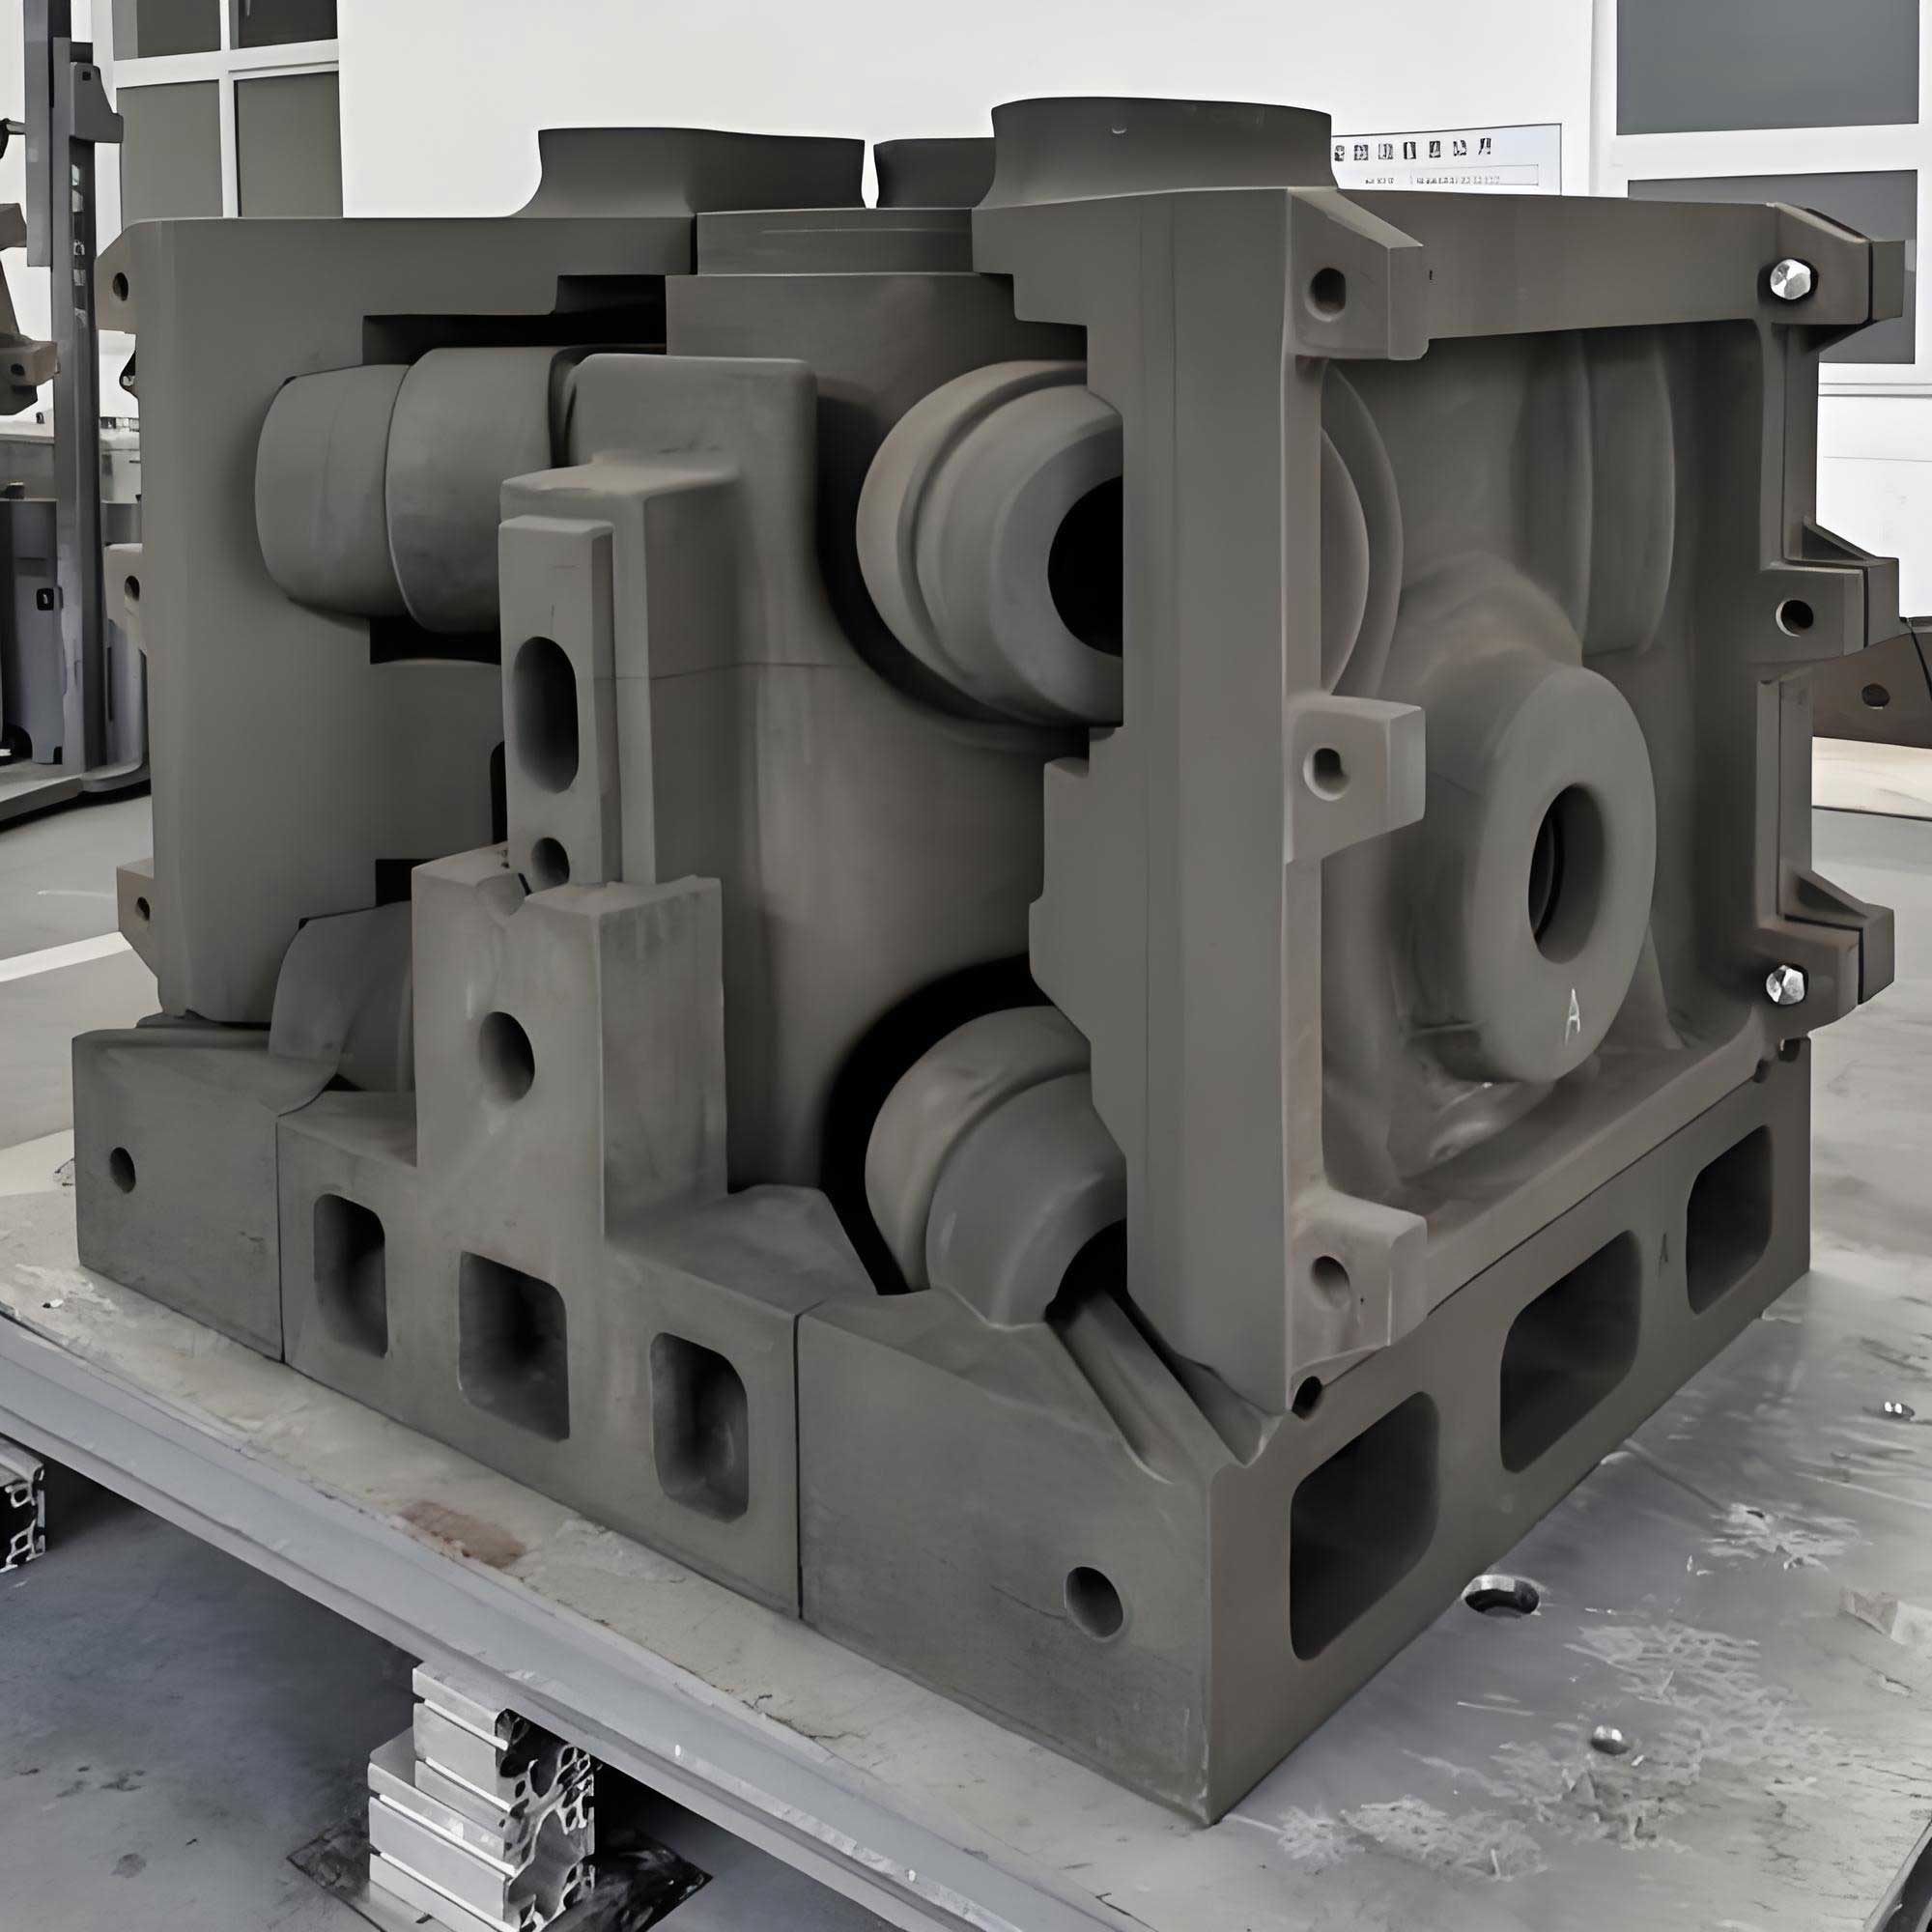
My investigation began with a comprehensive review of the current state of 3D printing sand casting. I found that while this technology has gained significant traction in recent years, several critical challenges remain unsolved. These include inadequate mechanical strength of printed sand molds, poor permeability, excessive gas evolution during pouring, and low printing efficiency due to inefficient utilization of the build volume. The central hypothesis of my research was that these challenges could be addressed through a combination of strategic mold design, optimization of printing parameters, and intelligent spatial arrangement of multiple molds within a single print job. I structured my research into four main phases: first, the influence of grid structures on sand mold performance was systematically studied and optimized using response surface methodology; second, a complete casting process for a thin-walled complex aluminum alloy casting was designed and verified through simulation; third, the microstructure and mechanical properties of castings produced via 3D printed sand molds were compared with those from traditional molding; and finally, a multi-cavity layout strategy was developed to maximize the sand utilization ratio within the printer’s build chamber.
Experimental Materials and Testing Methods
All experiments in my research were conducted using equipment and materials provided by a collaborating industrial partner specializing in sand mold 3D printing. I began by characterizing the base materials used in the printing process. The primary material was silica sand with a fineness number ranging from 85 to 95 AFS, containing less than 0.15% clay and less than 0.2% moisture, with a bulk density of approximately 1.3 g/cm³. For the binder system, I employed furan resin as the binding agent and a sulfonic acid-based catalyst as the hardener. The furan resin exhibited a density of 1.12 to 1.18 g/cm³, a viscosity of 5 to 20 mPa·s, and a surface tension of 35 to 40 mN/m. The catalyst had a total acidity ranging from 25.5% to 26.5%, a density of 1.30 to 1.35 g/cm³, and a free sulfuric acid content of less than 2.5%.
| Parameter | Sand (silica) | Furan Resin | Sulfonic Acid Catalyst |
|---|---|---|---|
| AFS fineness / density | 85–95 | 1.12–1.18 g/cm³ | 1.30–1.35 g/cm³ |
| Clay content / viscosity | 0.1–0.15% | 5–20 mPa·s | 20–40 mPa·s |
| Moisture / total acidity | ≤0.2% | — | 25.5–26.5% |
| SiO₂ content | >90% | — | — |
The sand molds for all experiments were fabricated using a DZ2000C industrial sand 3D printer. This printer operates with a layer thickness range of 200 to 500 μm and achieves a dimensional accuracy of ±0.3 mm. I set the layer thickness to 0.5 mm for mold printing, which corresponded to approximately 502 layers for the typical mold heights used in my experiments. The printing principle involved a cyclic process where the print head traversed in the X-direction while the recoater distributed sand in the Y-direction. After each layer was spread, the platform descended by the preset layer thickness in the Z-direction. The furan resin binder was selectively deposited onto the sand bed according to the cross-sectional geometry of the 3D model, and the curing agent catalyzed the polymerization reaction, forming strong bonding bridges between adjacent sand grains.
For testing the mechanical properties of the printed sand molds, I prepared standard specimens according to industry protocols. Compressive strength specimens were cylindrical, measuring 50 mm in diameter and 50 mm in height. Bending strength specimens were rectangular bars with dimensions of 151 mm in length and 11.2 mm in diameter at the semicircular ends. Tensile strength specimens had the characteristic “8” shape. All strength measurements were conducted using a SWY-IIIS intelligent sand strength testing machine, which automatically applied load until specimen failure and recorded the maximum strength values. I printed five specimens for each parameter combination and used the average values for analysis to minimize variability.
Gas evolution measurements were carried out using an SFL-IIS intelligent gas evolution tester. For each measurement, I precisely weighed 1 ± 0.01 g of sand sample taken from freshly fractured surfaces of the printed molds. The sample was placed in a steel boat and inserted into the preheated instrument at 850°C for 120 seconds. The gas generation curve was recorded, and the final value was read once the curve stabilized. Permeability testing was performed using an STD-III electric permeability tester, where the specimen was sealed within a rubber sleeve and subjected to a standardized airflow. Moisture content was determined using a dedicated moisture analyzer operating at 105°C, and grain size distribution was verified using a mechanical sieve shaker following standard procedures.
| Testing Equipment | Model | Purpose |
|---|---|---|
| Sand 3D printer | DZ2000C | Fabrication of sand molds |
| Strength testing machine | SWY-IIIS | Compressive, bending, tensile strength |
| Gas evolution tester | SFL-IIS | Gas generation measurement |
| Permeability tester | STD-III | Air permeability measurement |
| Moisture analyzer | LC-DHC-20A | Moisture content determination |
| Scanning electron microscope | IE500M | Microstructure observation |
| Sieve shaker | SSD-II | Grain size distribution analysis |
Influence of Grid Structure on 3D Printing Sand Casting Mold Performance
One of the fundamental problems I identified in 3D printing sand casting is that printed molds often have uniform strength throughout their structure, which is not always necessary or beneficial. In conventional sand mold making, the facing sand, which comes into direct contact with the molten metal, is designed to have high strength and hardness to withstand the thermal and mechanical erosion of the liquid metal. In contrast, the backing sand, which fills the space between the facing sand layer and the flask, primarily functions to support the mold structure and requires high permeability rather than maximum strength. Since 3D printing creates molds with homogeneous properties throughout, there is an inherent inefficiency where certain regions possess excessive strength while permeability is compromised throughout the entire mold.
To address this issue, I proposed and systematically investigated a spatial grid design for 3D printed sand molds. The concept involved creating internal cavities within the sand mold, which would reduce material consumption, increase permeability, and decrease gas evolution, all while maintaining sufficient structural integrity for the casting process. I designed three different cavity geometries: circular holes with a diameter of 5 mm, square holes with an outer circumscribed circle of 5 mm diameter, and hexagonal holes with the same circumscribed circle. The grid gap, representing the wall thickness between adjacent cavities, was set to 3 mm for these initial investigations. After printing and allowing the specimens to cure for 24 hours, I conducted comprehensive testing of their properties.
The experimental results demonstrated significant differences in performance based on cavity geometry. The solid reference specimen without any grid structure exhibited a compressive strength of 4.726 MPa, a bending strength of 2.687 MPa, a gas evolution of 12.35 mL/g, and a permeability of 104.3. When circular cavities were introduced, the compressive strength decreased to 3.316 MPa, representing a 29.8% reduction from the solid specimen. Similarly, the bending strength fell to 1.818 MPa, which was a 32.3% reduction. However, the benefits were equally substantial: gas evolution dropped to 10.8 mL/g (1.55 mL/g reduction), and permeability increased dramatically to 233.5, representing a 123.9% improvement. Square cavities yielded compressive and bending strengths of 3.144 MPa and 1.624 MPa respectively, while hexagonal cavities produced the lowest strength values at 2.769 MPa and 1.474 MPa. This clear trend demonstrated that circular cavities provided the best combination of retained strength and improved permeability among the three geometries tested.
| Cavity Geometry | Compressive Strength (MPa) | Bending Strength (MPa) | Gas Evolution (mL/g) | Permeability |
|---|---|---|---|---|
| Solid | 4.726 | 2.687 | 12.35 | 104.3 |
| Circle (5 mm) | 3.316 | 1.818 | 10.80 | 233.5 |
| Square (circumscribed 5 mm) | 3.144 | 1.621 | 10.89 | 231.6 |
| Hexagon (circumscribed 5 mm) | 2.769 | 1.474 | 11.01 | 220.5 |
The superiority of circular geometries can be attributed to the more uniform stress distribution around circular openings compared to sharp-cornered polygons. Stress concentrations at the corners of square and hexagonal cavities lead to premature failure under load, whereas the smooth curvature of circular cavities allows stresses to be distributed more evenly through the connecting walls. Additionally, the circular geometry appears to promote better resin bonding during the printing process, as the curvature creates a more favorable meniscus effect during binder infiltration, resulting in stronger intergranular bond bridges.
Following the identification of circular cavities as the optimal geometry, I proceeded to investigate the influence of gap size (wall thickness between cavities) on sand mold properties. I prepared specimens with gap sizes of 1 mm, 2 mm, 3 mm, 4 mm, and 5 mm, using the same three cavity geometries with fixed cavity sizes. For circular cavities, the compressive strength exhibited a strong positive correlation with gap size, increasing from approximately 2.26 MPa at 1 mm gap to approximately 4.26 MPa at 5 mm gap. Similarly, bending strength increased from approximately 1.21 MPa to 2.02 MPa over the same range. This trend was consistent across all three cavity geometries, with circular cavities always maintaining the highest strength values. The underlying mechanism is straightforward: larger gap sizes imply more sand and resin material between cavities, which enhances the load-bearing cross-section and provides more numerous bonding bridges that can resist external forces.
The gas evolution response to increasing gap size followed a gradual increasing trend, rising from approximately 10.18 mL/g at 1 mm gap to approximately 10.81 mL/g at 3 mm gap for circular cavities. However, further increases in gap size from 3 mm to 5 mm produced only marginal changes in gas evolution. This plateau effect occurred because the additional resin required for wider walls reached a saturation point where further additions no longer contributed significantly to the total organic content. Permeability showed the inverse relationship, decreasing from approximately 245.2 at 1 mm gap to approximately 233.5 at 3 mm gap, as the increased wall thickness created longer and more tortuous paths for gas flow.
In the third phase of this investigation, I varied the structural size (cavity diameter) from 3 mm to 7 mm while maintaining a constant gap size of 3 mm. For circular cavities, the compressive strength decreased from approximately 4.47 MPa at 3 mm diameter to approximately 2.31 MPa at 7 mm diameter. The bending strength similarly decreased from approximately 2.29 MPa to 1.02 MPa. As cavity size increased, the amount of sand material and resin binder per unit volume decreased, directly reducing the number of load-bearing bonds available. The gas evolution behavior was particularly interesting, initially decreasing from approximately 11.24 mL/g at 3 mm to approximately 10.77 mL/g at 5 mm, before increasing again to approximately 10.99 mL/g at 7 mm. This non-monotonic behavior can be explained by the competing effects of reduced resin content (leading to lower gas evolution) and the increased effective surface area of the larger cavities, which may trap more binder during printing.
| Gap Size (mm) | Compressive Strength (MPa) | Bending Strength (MPa) | Gas Evolution (mL/g) | Permeability |
|---|---|---|---|---|
| 1 | 2.26 | 1.21 | 10.18 | 245.2 |
| 2 | 2.89 | 1.52 | 10.49 | 239.4 |
| 3 | 3.32 | 1.82 | 10.80 | 233.5 |
| 4 | 3.78 | 1.93 | 10.87 | 230.1 |
| 5 | 4.26 | 2.02 | 10.92 | 228.7 |
Response Surface Methodology for Process Optimization
Based on the single-factor experimental results, I selected the optimal ranges for the response surface analysis. The three factors investigated were cavity geometry (A: square, circle, hexagon), gap size (B: 2 to 4 mm with center at 3 mm), and structural size (C: 4 to 6 mm with center at 5 mm). I employed a Box-Behnken experimental design implemented through Design-Expert software, which generated 17 experimental runs including 5 center point replicates for estimating experimental error. The response variables measured were compressive strength (Y₁), bending strength (Y₂), gas evolution (Y₃), and permeability (Y₄).
| Factor | Code | -1 Level | 0 Level | +1 Level |
|---|---|---|---|---|
| Cavity Geometry | A | Square | Circle | Hexagon |
| Gap Size (mm) | B | 2 | 3 | 4 |
| Structural Size (mm) | C | 4 | 5 | 6 |
The experimental results from the 17 runs were analyzed using ANOVA to establish regression models for each response variable. The regression equation for compressive strength was determined as:
$$Y_1 = 3.3196 – 0.13275A + 0.413B – 0.30725C – 0.0055AB + 0.0575AC + 0.085BC – 0.4353A^2 + 0.382B^2 – 0.0298C^2$$
The ANOVA results for this model showed a highly significant F-value of 57.05 with a p-value less than 0.0001, confirming the model’s statistical significance. The lack-of-fit p-value of 0.1793 indicated that the model provided an adequate fit to the experimental data without significant lack of fit. The coefficient of determination R² was 0.9866, meaning that 98.66% of the variability in compressive strength could be explained by the model. The adjusted R² of 0.9693 and predicted R² of 0.8487 had a difference of approximately 0.12, which is within acceptable limits (much less than 0.2). The coefficient of variation was only 2.50%, indicating excellent precision and reliability of the experimental results.
From the ANOVA table, I observed that all three linear terms (A, B, C) were highly significant with the influence ranking: B (gap size) > C (structural size) > A (cavity geometry). The interaction terms AB, AC, and BC did not show significant effects on compressive strength, suggesting that the factors acted largely independently. Among the quadratic terms, only A² was highly significant, while B² and C² were not significant. In terms of bending strength, the regression model was:
$$Y_2 = 1.818 – 0.055375A + 0.23663B – 0.11125C – 0.01575AB + 0.001AC + 0.02BC – 0.17413A^2 – 0.064125B^2 – 0.044375C^2$$
This model exhibited excellent statistical properties with an F-value of 127.02 and p-value less than 0.0001. The R² value of 0.9939 confirmed that 99.39% of the variability was explained. The influence ranking for bending strength followed the same pattern as compressive strength: B > C > A. However, for bending strength, all three quadratic terms were highly significant, indicating more complex curvature in the response surface.
For gas evolution, the regression model was:
$$Y_3 = 10.806 + 0.06625A + 0.125B – 0.07875C – 0.0075AB – 0.005AC – 0.0125BC + 0.1795A^2 – 0.123B^2 + 0.2395C^2$$
This model also demonstrated strong statistical significance with F = 62.47 and p < 0.0001, with R² = 0.9877. The influence ranking for gas evolution was B > C > A, consistent with the strength responses. However, for permeability, the regression model was different:
$$Y_4 = 233.14 – 2.2375A – 0.7875B – 3.15C + 0.3AB – 1.775AC – 1.275BC – 4.6955A^2 + 3.005B^2 – 10.72C^2$$
The permeability model had an F-value of 47.09 and p < 0.0001 with R² = 0.9838. Notably, the influence ranking for permeability was C (structural size) > A (cavity geometry) > B (gap size), which differed from the other response variables. This highlights that structural size had the most profound impact on permeability, likely because larger cavities create larger continuous void channels that facilitate gas flow, while larger gap sizes have a comparatively lesser effect on the overall permeability of the structure. Among the interaction terms, only AC was significant for permeability (p = 0.033), while AB and BC interactions were not significant. For all other responses, no significant interaction effects were found.
| Response | F-value | P-value | R² | Adjusted R² | Influence Ranking |
|---|---|---|---|---|---|
| Compressive Strength | 57.05 | <0.0001 | 0.9866 | 0.9693 | B > C > A |
| Bending Strength | 127.02 | <0.0001 | 0.9939 | 0.9861 | B > C > A |
| Gas Evolution | 62.47 | <0.0001 | 0.9877 | 0.9719 | B > C > A |
| Permeability | 47.09 | <0.0001 | 0.9838 | 0.9629 | C > A > B |
The three-dimensional response surface plots allowed me to visualize the relationships between factors and responses. For compressive strength, the response surface with gap size and cavity geometry as variables showed a convex shape, with maximum strength achieved at circular geometry and higher gap sizes. The contour plot exhibited a slightly elliptical shape, suggesting mild interaction between these two factors. When examining structural size and cavity geometry, the response surface displayed a clear ridge along the circular geometry axis, reinforcing the superiority of circular cavities. The steepest descent was observed in the direction of increasing structural size, consistent with the significant negative coefficient for C in the regression model.
Using the numerical optimization module of the software, I set the optimization criteria to maximize compressive strength, bending strength, and permeability, while minimizing gas evolution, with equal importance weights for all four responses. The optimization routine identified the optimum conditions as: circular cavity geometry, gap size of 3.67 mm, and structural size of 4.76 mm. At these optimum parameters, the predicted values were compressive strength of 3.81 MPa, bending strength of 2.01 MPa, gas evolution of 10.8 mL/g, and permeability of 235.9. Since the printer allows precise control of dimensions, I slightly rounded these to gap size of 3.7 mm and structural size of 4.8 mm for practical implementation, maintaining circular geometry.
Four additional specimens were printed at these optimized parameters to validate the model predictions. The experimental results showed excellent agreement with the predicted values: compressive strength averaged 3.82 MPa, bending strength averaged 2.02 MPa, gas evolution averaged 10.6 mL/g, and permeability averaged 236.2. Compared to the solid reference specimen, the optimized grid structure achieved a 19.2% reduction in compressive strength and a 25% reduction in bending strength, but these values remained well above the minimum requirements for sand mold application. More importantly, the gas evolution was reduced by 12.5%, and permeability was improved by an impressive 126.9%, representing substantial improvements in mold quality and casting performance. These enhancements directly contribute to reduced casting defects such as gas porosity and blowholes in the final components. In terms of material savings, the grid structure reduced sand consumption by more than 30%, translating to significant cost reductions for an industrial-scale operation.
Design and Simulation of 3D Printing Sand Casting Process for Thin-Walled Castings
The second major phase of my research focused on the practical application of 3D printing sand casting for a complex thin-walled aluminum alloy casting. The component I selected as my research vehicle was a ZL101A aluminum alloy casting with overall dimensions of approximately 145 mm × 125 mm × 130 mm. This casting exhibited a maximum wall thickness of 18 mm, a minimum wall thickness of 2 mm, and an average wall thickness of 5.5 mm. The presence of multiple surface protrusions, asymmetric geometries, and numerous thin sections made this component an ideal candidate for demonstrating the advantages of 3D printing sand casting over traditional methods, as such complex geometries would require extensive core tooling and multiple parting lines in conventional manufacturing.
For the gating system design, I followed the traditional casting design principles while adapting them for the capabilities of 3D printing. Since aluminum alloys are prone to oxidation and have relatively low heat capacity, I selected an open gating system design where the cross-sectional areas increase progressively from the sprue to the runner to the ingate. Through preliminary calculations, I determined the optimal cross-sectional area ratio as ΣA_sprue : ΣA_runner : ΣA_ingate = 1 : 2 : 2.2. The minimum cross-sectional area of the gating system was calculated using the established formula:
$$A_{ingate} = \frac{G_L}{\rho_L \mu t \sqrt{2 g h_p}}$$
Where G_L is the total mass of metal including gating and riser system, ρ_L is the density of the molten alloy, μ is the flow loss coefficient, t is the pouring time, g is gravitational acceleration, and h_p is the effective pressure head. For this casting, I estimated a total metal mass of approximately 2.5 kg, giving a pouring time of approximately 4 seconds and an ingate area of approximately 3.2 cm². Based on these calculations, I designed a bottom gating system with a 40 mm-high sprue cup having a diameter of 60 mm, and a total sprue height of 158 mm, resulting in a total height of 180 mm from the sprue cup to the casting.
The initial casting design was modeled in three-dimensional CAD software and exported for numerical simulation using the ProCAST simulation package. The simulation model consisted of the casting with gating system, surrounded by a 200 mm × 200 mm × 200 mm sand mold, which was discretized into finite elements with a maximum element size of 5 mm for the casting and 20 mm for the sand mold. The total mesh comprised 27,124 surface elements and 353,209 volume elements. Material properties were assigned as EN AC-42100 (AlSi7Mg0.3) for the casting components, resin-bonded sand for the mold, and cast iron for chills. The interface heat transfer coefficients were set to 500 W/(m²·°C) between the mold and casting, and 2000 W/(m²·°C) between the casting and chills. The casting parameters included a pouring temperature of 725°C, a pouring time of 4 seconds, and an initial mold temperature of 25°C.
The initial simulation results revealed significant issues with the casting design. During the filling analysis, the molten metal exhibited a stable and laminar flow pattern, rising uniformly from the bottom of the cavity toward the top without observable splashing or turbulence, which confirmed the effectiveness of the bottom gating configuration. The filling time for the casting body was approximately 4 seconds, which matched my design calculations well. However, the solidification analysis exposed severe problems. The cooling was highly inhomogeneous, with thin sections solidifying rapidly while thicker sections and complex geometries remained in the liquid state for extended periods. At t = 27.06 s, the thin walls had completely solidified, but several isolated liquid pools remained isolated from the feed path, establishing ideal conditions for shrinkage porosity formation. By t = 57.06 s, these isolated zones were surrounded by solid metal, preventing any possibility of liquid metal feeding. By t = 96.65 s, the casting solidified, complex and thick parts remained liquid, and by t = 386.06 s, all parts including the pouring system were fully solidified.
The defect prediction from the initial simulation showed substantial shrinkage porosity distributed throughout the casting, with the worst areas located at the intersections of thin walls and at complex geometric features. The total defect volume was calculated as 0.102 cc. Because these defects were located in structurally critical areas of the casting, this design needed optimization to achieve a usable casting.
Based on the simulation findings, I redesigned the casting process with additional feeding and cooling elements. The optimized design incorporated chills at strategic locations: three chills at the bottom of the casting to accelerate local cooling and promote directional solidification, one chill in the middle complex section to mitigate hot spot formation, and three additional chills at the top thick sections. Moreover, I enlarged the top riser and added three blind risers at critical junctions to provide feeding channels. These modifications aimed to establish a more favorable solidification sequence, from thin sections to thick sections, eventually ending with the risers, thereby ensuring adequate feeding throughout the solidification process.
The optimized casting design was re-simulated to verify the improvements. The filling analysis showed that the casting body was completely filled in approximately 4.6 seconds, consistent with the pouring time calculation. During solidification, the chills and risers worked synergistically to guide directional solidification from the extremities toward the risers. The simulation results confirmed that by t = 90.05 s, the casting body had completely solidified, with the risers and gating system remaining partially liquid to provide feeding capability. The total defect volume was reduced dramatically to 0.045 cc, representing a 55.88% reduction from the initial design. Importantly, the remaining defects were confined to the runner and riser systems, while the casting itself exhibited no significant defects in critical areas. The casting solidification time distribution clearly showed a more ordered, directional pattern compared to the chaotic sequence observed in the initial design.
| Parameter | Initial Design | Optimized Design |
|---|---|---|
| Porosity volume (cc) | 0.102 | 0.045 |
| Defect weight (mg) | 0.122 | 0.054 |
| Filling time (s) | ~4.0 | 4.6 |
| Complete solidification time (s) | 386 | 400 |
| Defect location | Throughout critical areas | Only in gating/riser system |
Fabrication, Testing, and Comparative Analysis of Castings
With the optimized casting design validated through simulation, I proceeded to fabricate the sand molds using 3D printing. The mold was designed in four separable sections with alignment features including locating bosses and recesses at the corners to ensure precise assembly. The gap between mating sections was maintained at 0.1 to 0.2 mm to accommodate any minor thermal dimensional changes, while the entire assembly was designed with a 1% shrinkage allowance to compensate for the solidification contraction. The mold model was processed through the printer’s slicing software at a layer thickness of 0.5 mm, generating 502 layers. The printing process completed in approximately 6 hours, after which the molds were allowed to stand for a period to acquire adequate green strength before being removed from the printing chamber.
After removal, I carefully cleaned the molds with compressed air to eliminate loose sand particles from the cavities. The surface of the mold cavities was then coated with a refractory casting coating using spray application to prevent sand erosion and improve the surface finish of the final casting. The coated molds were dried in an oven at 90°C for 1 hour. Following drying, the chills were placed into their designated slots within the mold sections, and a ceramic foam filter was installed in the runner system to remove oxides and other inclusions from the molten metal. The four mold sections were then assembled, and the complete mold was preheated to 100°C for 2 hours before pouring to reduce the thermal shock at the sand surface and improve metal flow.
The ZL101A alloy was melted in a medium frequency induction furnace. Prior to melting, the furnace chamber was preheated for 90 minutes. Once the aluminum ingots were completely melted, a refining flux was added to remove dissolved hydrogen and oxide inclusions. For grain refinement, 1.4% Al-5Ti-B master alloy was added, and for modification, 0.085% rare earth element-based modifier (containing La and Ce) was introduced to refine the eutectic silicon phase. The melt composition was verified using optical emission spectroscopy, which confirmed the primary elements as 6.909 wt.% Si, 0.359 wt.% Mg, 0.163 wt.% Ti, 0.049 wt.% Zr, 0.011 wt.% Sr, with the balance being aluminum. The molten metal was degassed and skimmed, then maintained at approximately 720°C before pouring. A total of approximately 1.51 kg of molten alloy was poured into the mold to fill the casting, gating system, and risers.
The filled molds were allowed to cool and solidify for 30 minutes before being broken out. The castings were then subjected to initial processing to remove the gates and risers. After surface cleaning and visual inspection, the casting showed excellent surface finish and accurate dimensional reproduction, confirming the fidelity of the 3D printed mold. To verify the quality of the casting, a pneumatic leak test was performed by sealing all openings except one pressure inlet and pressurizing the internal cavity to 0.2 MPa, then submerging the casting in water. No bubbles were observed, indicating the casting was free from through-wall porosity and other leak paths, which verified the soundness of the optimized casting process.
For metallurgical evaluation, I prepared samples from castings produced using both the 3D printed sand molds and traditional sand molds. The samples were examined in both the as-cast condition and after T6 heat treatment. The T6 treatment consisted of solution treatment at 520°C for 2 hours followed by quenching in water at 80°C, and subsequent aging at 200°C for 3 hours followed by air cooling. Microstructural observation revealed that in both molding conditions, the as-cast microstructure exhibited a primary α-Al matrix with eutectic silicon phases having a sharp, acicular morphology. After T6 treatment, the eutectic silicon became spheroidized and rounded, appearing more as fine particles distributed uniformly in the aluminum matrix. This morphological change is responsible for the enhanced ductility and fracture toughness observed after heat treatment.
Comparing the two molding methods, I found that the secondary dendrite arm spacing was visibly different. The castings produced from 3D printed sand molds exhibited more uniform and refined grain structures with smaller dendrite spacing. This improvement is primarily attributed to the differences in thermal conductivity and heat transfer characteristics between the 3D printed sand and conventionally packed sand. The 3D printed sand mold displayed better and more uniform thermal conductivity due to more consistent particle packing and binder distribution, resulting in faster cooling rates during solidification. The faster cooling promoted nucleation and limited dendrite growth, leading to a more refined and homogeneous microstructure. This refinement has been quantitatively confirmed through the secondary dendrite arm spacing measurement, where the 3D printed mold samples showed consistently smaller SDAS values than traditional mold samples across both heat treatment conditions.
$$d = \frac{1}{m} \sum_{i=1}^{m} \frac{l_i}{n_i – 1}$$
In the above equation, d represents the secondary dendrite arm spacing in μm, l_i is the measured length of the i-th dendrite group, n_i is the number of dendrites counted, and m is the total number of dendrite groups measured. This standard metallographic characterization technique enabled quantitative comparison of structural refinement between the two molding processes.
Mechanical testing of tensile specimens extracted from the castings showed significant differences. After T6 heat treatment, the average ultimate tensile strength of specimens from traditional sand molds was approximately 249 MPa with an elongation of 2.2%, while specimens from 3D printed sand molds exhibited an average ultimate tensile strength of approximately 288 MPa with an elongation of 2.8%. The tensile strength of the 3D printed mold castings not only exceeded that of the traditional mold castings by approximately 15.7%, but they also achieved higher ductility, which is beneficial for structural applications. The superior mechanical properties of the 3D printed sand mold castings can be attributed to the refined grain structure, more uniform distribution of secondary phases, and reduced porosity achieved through better feeding during solidification.
Fractographic analysis using scanning electron microscopy revealed distinct fracture surface characteristics between the two molding conditions. Fracture surface of specimens from traditional sand molds exhibited more pronounced cleavage facets and tearing ridges, indicating a more brittle fracture mode. This brittle behavior is consistent with coarser microstructures and the presence of larger brittle eutectic silicon particles. In contrast, fracture surface of specimens from 3D printed sand molds displayed a greater proportion of fine dimples, suggesting a more ductile fracture mechanism with better energy absorption capability. This mixed fracture mode, with characteristics of both ductile and brittle failure, indicates a more homogeneous deformation and damage process within the material. My conclusion from this thorough comparative investigation is that 3D printing sand casting technology produces castings with superior microstructural characteristics and mechanical properties compared to traditional molding methods, confirming its viability as a manufacturing process for structural components.
| Molding Method | Heat Treatment | Tensile Strength (MPa) | Elongation (%) |
|---|---|---|---|
| Traditional | T6 | 249 | 2.2 |
| 3D Printed | T6 | 288 | 2.8 |
Multi-Cavity Layout and Sand Utilization Optimization
The final phase of my research addressed the challenge of efficient spatial utilization in 3D printing sand casting. A significant limitation of current sand printing technology is that the build chambers are large (my printer had a working volume of 2000 mm × 1100 mm × 800 mm), but individual castings are often much smaller. Printing a single sand mold at a time results in poor utilization of the build volume, longer effective production times, and higher relative cost per mold. To address this economically important issue, I developed a comprehensive strategy for arranging multiple sand molds within a single printing job, a concept analogous to the “multi-cavity” approach used in conventional sand casting. I introduced the sand mold ratio (SMR) as a quantitative metric to evaluate the efficiency of spatial utilization:
$$\text{SMR} = \frac{\text{Sand volume in molds}}{\text{Total sand volume in build chamber}} \times 100\%$$
The SMR metric allowed me to objectively compare different layout configurations and identify the most efficient arrangement for each type of casting. For the thin-walled aluminum alloy casting, I designed a one-box-six-pieces gating system where six casting cavities shared a common sprue and runner system. The overall sand mold dimensions were 410 mm × 350 mm × 201 mm, divided into four layers with heights of 60 mm, 45 mm, 51 mm, and 45 mm respectively. The complete mold incorporated alignment features and location proofs similar to those used for single cavity molds. I then explored three distinct placement strategies within the printer’s build chamber: horizontal arrangement, vertical arrangement, and mixed horizontal-vertical arrangement.
In the horizontal arrangement, I considered two configurations. The first placed 15 molds in a single layer (5 columns × 3 rows), totaling 15 molds per layer. Considering the available vertical build height, a second layer could be stacked, yielding a total of 30 molds in the build chamber. The resulting SMR was calculated as 49.17%. The second horizontal configuration arranged 12 molds per layer (4 columns × 3 rows), with 3 layers stacked vertically to fit within the build height, producing 36 total molds and an SMR of 59%. This represented a 20% improvement over the first horizontal arrangement. For the vertical arrangement, the first configuration placed 9 molds per layer (9 columns × 1 row) with 3 layers stacked, totaling 27 molds and 44.25% SMR. The second vertical configuration arranged 12 molds per layer with 3 layers, also achieving 36 molds and 59% SMR.
The mixed arrangement proved to be the most efficient. In the first mixed configuration, I arranged 7 molds horizontally and 2 molds vertically in alternating layers, achieving 14 molds per layer with multiple layers, totaling 40 molds and an SMR of 65.55%. The second mixed configuration utilized 22 molds per layer for 2 layers, totaling 44 molds, which produced a substantially improved SMR of 72.11%. This arrangement effectively filled the build chamber by combining horizontal placement (which maximizes floor area utilization) with vertical stacking (which maximizes build height utilization), demonstrating that thoughtful three-dimensional space planning is key to maximizing print efficiency.
| Arrangement Type | Molds per Configuration | Total Molds | Sand Mold Ratio (%) |
|---|---|---|---|
| Horizontal 1 | 15 per layer × 2 layers | 30 | 49.17 |
| Horizontal 2 | 12 per layer × 3 layers | 36 | 59.00 |
| Vertical 1 | 9 per layer × 3 layers | 27 | 44.25 |
| Vertical 2 | 12 per layer × 3 layers | 36 | 59.00 |
| Mixed 1 | 20 per layer × 2 layers | 40 | 65.55 |
| Mixed 2 | 22 per layer × 2 layers | 44 | 72.11 |
I also applied this multi-cavity approach to a substantially larger casting: a multi-way valve component made of ductile iron QT600-3. This casting had dimensions of approximately 313 mm × 252 mm × 156 mm, with wall thicknesses ranging from 6 mm to 32.5 mm and an average thickness of 19.25 mm. The casting volume was 1912.62 cm³ with a mass of approximately 13.77 kg. Due to its larger size, I designed a one-box-four-pieces gating system with overall mold dimensions of 750 mm × 600 mm × 256 mm, divided into three layers of 80 mm, 79 mm, and 97 mm heights. The mold incorporated 16 vent holes to improve gas evacuation during pouring. For this larger mold, the best horizontal arrangement achieved 9 molds in the build chamber with an SMR of 58.91%. However, the most efficient vertical arrangement placed 12 molds in a 3-column by 4-row configuration, achieving 78.55% SMR, the highest value obtained among the uniform arrangements tested. The mixed arrangement also achieved 12 molds with the same 78.55% SMR, demonstrating that the maximum packing density for this geometry approaches this value.
Finally, I investigated mixed-casting arrangements where both the thin-wall casting and the multi-way valve casting were printed in a single job. Since the multi-way valve molds were larger, I used them as the primary structures and fitted the smaller thin-wall casting molds around them. In one configuration, I placed 9 multi-way valve molds arranged in a 3 × 3 pattern, and 8 thin-wall casting molds arranged in a 2-layer × 4-column pattern, totaling 17 molds in the print job. The SMR for this configuration was 72.02%. In an alternative configuration, I arranged 7 multi-way valve molds in a single vertical column and placed 16 thin-wall casting molds in a 2-layer × 8-column pattern, totaling 23 molds with an SMR of 72.04%. This arrangement was interesting because it offered a lower total mold count than the single-casting arrangements but enabled simultaneous production of two different casting types in one print job, thereby improving factory responsiveness and reducing work-in-progress inventory.
| Casting Configuration | Multi-Valve Molds | Thin-Wall Molds | Total Molds | Sand Mold Ratio (%) |
|---|---|---|---|---|
| Horizontal best | 9 | 0 | 9 | 58.91 |
| Vertical best | 12 | 0 | 12 | 78.55 |
| Mixed same-type | 12 | 0 | 12 | 78.55 |
| Mixed different-type 1 | 9 | 8 | 17 | 72.02 |
| Mixed different-type 2 | 7 | 16 | 23 | 72.04 |
The results of this multi-cavity investigation demonstrated that significant efficiency gains are achievable through thoughtful spatial planning in 3D printing sand casting. The SMR metric proved to be an effective tool for quantitatively evaluating different layout strategies. For both casting types, mixed configurations that combined horizontal and vertical placement consistently outperformed purely horizontal or purely vertical arrangements. The ability to print different casting types in a single job also provides operational flexibility, enabling factories to respond to custom demands with minimal waste and reduced lead time. The techniques developed in this part of my research are directly applicable to industrial production planning for 3D printing sand casting and contribute to making this technology more cost-competitive with traditional sand casting, particularly for small-batch and prototype production.
Overall, my research has demonstrated that 3D printing sand casting technology, when properly optimized and efficiently implemented, can deliver significant advantages over traditional sand casting in terms of design freedom, lead time reduction, material efficiency, and mechanical property enhancement. Through my systematic investigation of grid structures, I established quantitative relationships between geometric parameters and mold performance, enabling predictive optimization of mold design. The response surface methodology proved invaluable in identifying optimal parameter combinations with a minimum number of experiments, saving both time and resources. The successful application of this technology to produce thin-walled complex castings with superior mechanical properties confirmed the practical viability of the approach. The multi-cavity strategy provided a roadmap for industrial implementation, addressing the economic constraints that often limit the adoption of additive manufacturing technologies in casting applications. Taken together, the findings of this research provide a solid engineering foundation for the broader adoption of 3D printing sand casting in modern foundry practice, and pave the way for future innovations in this rapidly advancing field.