
1. Introduction
Traditional casting processes involve numerous tedious and intricate procedures, with mold design being a critical bottleneck in casting process development. The difficulty of mold design primarily depends on the structural characteristics of the cast component. However, with the acceleration of high-end equipment upgrading, an increasing number of castings are developing toward lightweight and precision-oriented directions, particularly in advanced equipment manufacturing fields such as aerospace and national defense. The comprehensive performance requirements for castings continue to rise, and traditional casting methodologies can no longer satisfy the production demands of such components.
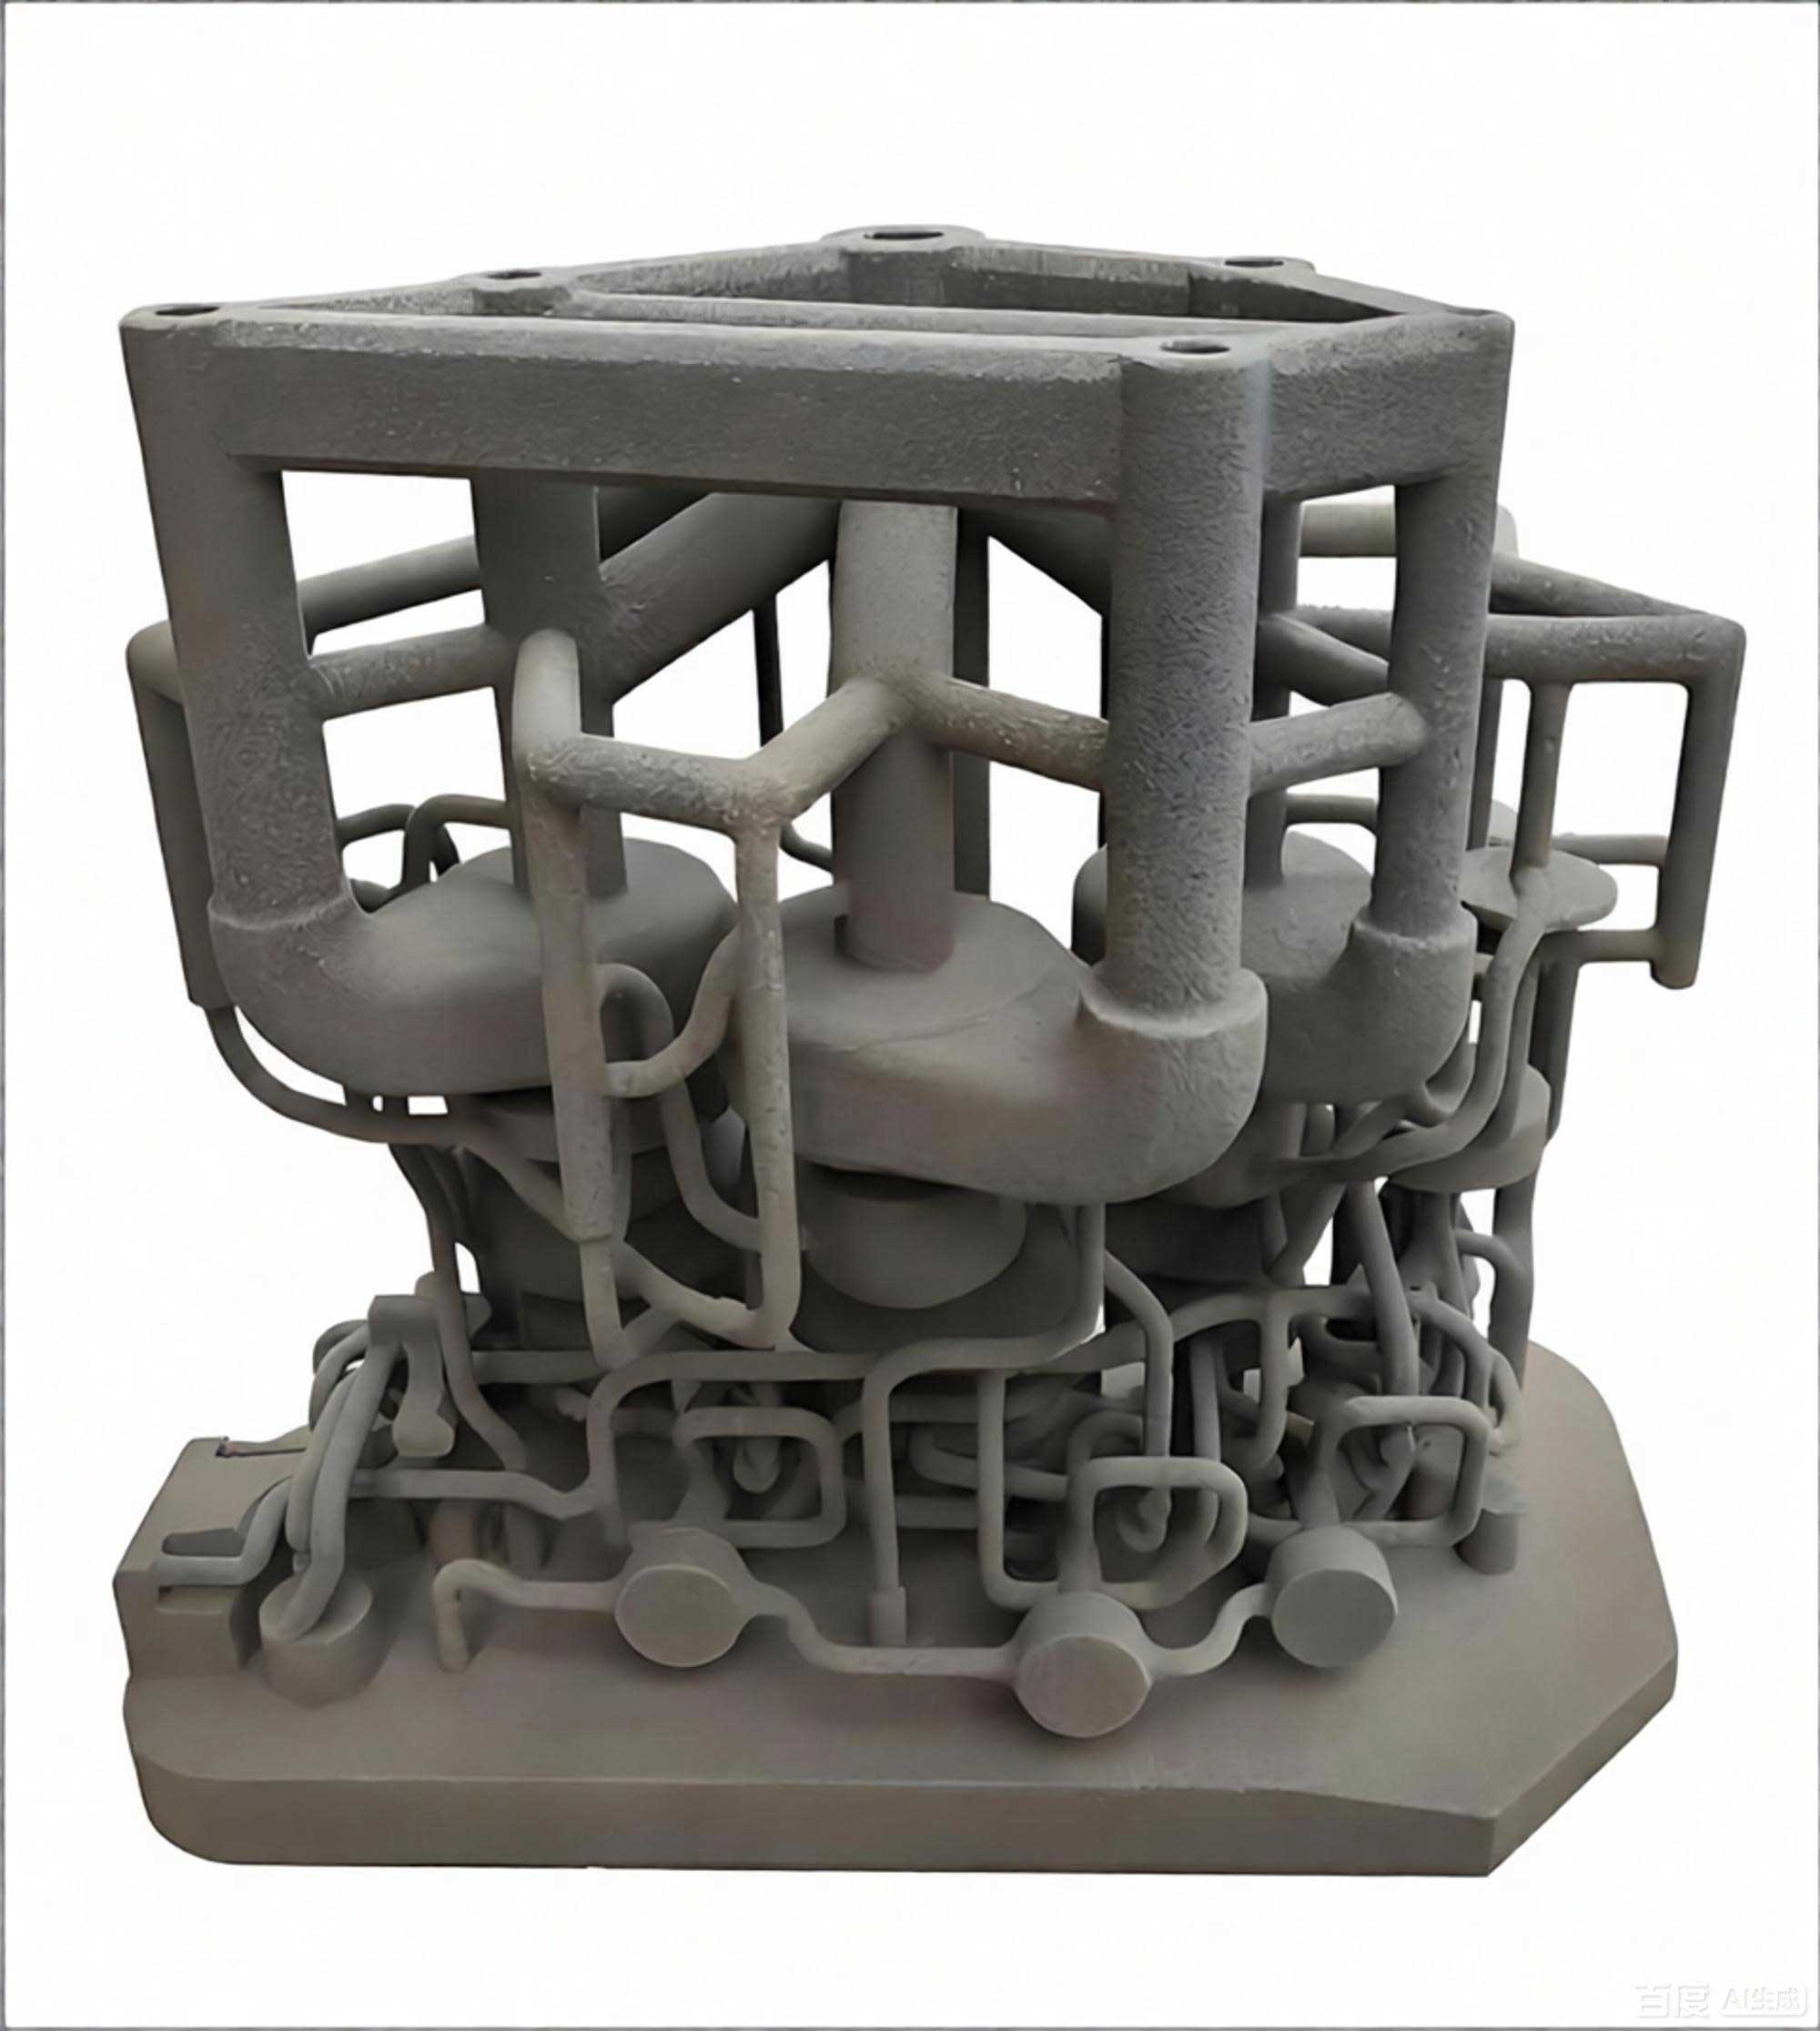
This study focuses on the application of 3D printing sand casting technology to a thin-walled, complex shell casting used in the aviation sector. The research systematically investigates the optimization of 3D printing sand mold forming processes and validates the low-pressure die casting process. By developing smart casting processes centered on 3D printing sand casting, this work aims to solve problems encountered in traditional casting, including difficulties in precisely controlling the shape and properties of complex castings, poor quality stability, significant resource waste, and severe environmental pollution.
The primary objectives of this research include: optimizing 3D printing process parameters through response surface methodology; studying the effects of low-pressure casting parameters on the microstructure and mechanical properties of ZL101A aluminum alloy; designing and validating a complete casting process for the shell component using simulation and experimental verification.
2. Materials and Experimental Methods
2.1 Raw Materials and Equipment
The experimental materials and equipment used in this study were provided by Kangshuo (Shanxi) Intelligent Manufacturing Co., Ltd. The sand mold 3D printing equipment was the ExOne S-Max Pro, with a build volume of 1800 mm × 1000 mm × 700 mm. The layer thickness control range was 0.20 mm to 0.50 mm, and the printhead motion control accuracy was ±0.3 μm.
The characteristics of the primary materials employed in the 3D printing sand casting process are summarized below:
| Parameter | Value |
|---|---|
| Silica content (%) | 90 ~ 92 |
| AFS fineness | 64 ~ 72 |
| Angularity coefficient | < 1.25 |
| Bulk density (g/ml) | 1.35 ~ 1.45 |
| Parameter | Value |
|---|---|
| Viscosity (mP·s) | 6 ~ 8 |
| Density (g/cm³) | 1.12 ~ 1.18 |
| Electrical conductivity (μs/cm) | ≤ 20 |
| Surface tension (mN/m) | 35 ~ 40 |
2.2 Sand Mold Performance Testing
Sand mold tensile strength testing was performed in accordance with GB/T 2684-2009. The standard “8”-shaped specimens were tested on a SWY-B digital hydraulic strength testing machine. For gas evolution testing, 1.0 g of sample was taken from the fracture surface of the “8”-shaped specimen and placed in a specimen boat within a GET-Ⅲ intelligent gas evolution tester. Dimensional deviation was characterized using cylindrical specimens, with an outer diameter of Φ50 mm × 50 mm and a plate thickness of 10 mm, measuring the positional tolerance between each cylinder center.
2.3 Alloy Melting and Heat Treatment
The ZL101A aluminum alloy ingots were melted in a low-pressure casting crucible holding furnace. Refining was conducted using a suspended degassing machine with a refining gas flow of 12–30 NL/min and a rotor speed of 800 r/min. The chemical composition of the ZL101A alloy is presented below:
| Element | Si | Mg | Ti | Sr | Zr | Cu | Al |
|---|---|---|---|---|---|---|---|
| Content (wt. %) | 6.909 | 0.359 | 0.163 | 0.009 | 0.049 | 0.005 | Balance |
All castings were subjected to T6 heat treatment. Solution treatment was performed at 535°C for 13 hours, followed by quenching in 80°C water. Aging was conducted at 200°C for 5 hours, followed by air cooling.
3. Effect of 3D Printing Process Parameters on Sand Mold Properties
3.1 Single-Factor Analysis
3.1.1 Effect of Resin Inkjet Content
The resin inkjet content, representing the mass fraction of furan resin relative to the sand in each printed layer, was varied from 1.2% to 2.0% while maintaining a layer thickness of 0.30 mm and activator content of 0.30%. The experimental results revealed that as resin inkjet content increased, the tensile strength of printed specimens increased linearly. This occurs because tensile strength is provided by binder bridges between sand particles. When resin content increases, the number and bonding surface area of binder bridges increase correspondingly. Conversely, gas evolution increased with increasing resin content due to the thermal decomposition of organic furan resin compounds. Dimensional deviation also increased with resin content, attributed to enhanced lateral diffusion of resin from printed to non-printed areas, binding excess sand particles.
3.1.2 Effect of Layer Thickness
Layer thickness was varied from 0.25 mm to 0.45 mm while maintaining resin content at 1.6% and activator content at 0.30%. Results demonstrated that tensile strength decreased with increasing layer thickness. This behavior is related to the degree of resin penetration in the vertical direction. For thinner layers, vertical diffusion reaches saturation before lateral diffusion, allowing complete curing reactions. For thicker layers, extended vertical diffusion paths may be blocked by pre-cured binder bridges, reducing bonding effectiveness. Gas evolution decreased slightly with increasing layer thickness, while dimensional deviation decreased significantly—thicker layers reduce lateral resin diffusion, limiting excess sand particle binding.
3.1.3 Effect of Activator Content
Activator content varied from 0.20% to 0.40% with a resin content of 1.6% and layer thickness of 0.30 mm. The tensile strength exhibited a bell-shaped relationship with activator content. At low activator levels, the acidic environment necessary for resin cross-linking is insufficient. At excessive levels, accelerated curing rates lead to incomplete binder bridge formation, increasing brittleness. Gas evolution increased up to 0.35% activator content before stabilizing. Dimensional deviation showed minimal variation with activator content.
3.2 Response Surface Methodology Optimization
Based on single-factor experiments, a three-factor, five-level central composite design was established using Design Expert software. The parameter variables and their coded levels are presented below:
| Variable | Code | -α | -1 | 0 | 1 | α |
|---|---|---|---|---|---|---|
| Resin inkjet content (%) | A | 1.2 | 1.4 | 1.6 | 1.8 | 2.0 |
| Layer thickness (mm) | B | 0.25 | 0.30 | 0.35 | 0.40 | 0.45 |
| Activator content (%) | C | 0.20 | 0.25 | 0.30 | 0.35 | 0.40 |
The regression model equations derived from ANOVA analysis for each response are presented below:
For tensile strength (Y₁):
$$Y_1 = 2.44 + 0.4786A – 0.1128B + 0.0257C + 0.0075AB – 0.01AC + 0.0075BC + 0.0079A^2 + 0.0097B^2 – 0.0098C^2$$
For gas evolution (Y₂):
$$Y_2 = 10.74 + 1.72A – 0.165B + 0.3358C – 0.0225AB – 0.06AC – 0.0175BC – 0.1793A^2 – 0.0326B^2 – 0.0891C^2$$
For dimensional deviation (Y₃):
$$Y_3 = 0.3153 + 0.0632A – 0.0392B + 0.0005C – 0.0075AB + 0.005AC – 0.005BC – 0.0074A^2 – 0.0039B^2 – 0.0074C^2$$
| Source | Sum of Squares | df | Mean Square | F-value | P-value | Significance |
|---|---|---|---|---|---|---|
| Model | 3.32 | 9 | 0.3685 | 65.84 | < 0.0001 | ** |
| A | 3.13 | 1 | 3.13 | 558.92 | < 0.0001 | ** |
| B | 0.1737 | 1 | 0.1737 | 31.03 | 0.0002 | ** |
| C | 0.009 | 1 | 0.009 | 1.61 | 0.2336 | – |
| Residual | 0.056 | 10 | 0.056 | – | – | – |
| Lack of Fit | 0.0392 | 5 | 0.0078 | 2.34 | 0.1861 | – |
| Pure Error | 0.0167 | 5 | 0.0033 | – | – | – |
Note: ** highly significant (P<0.01); * significant (P<0.05)
| Source | Sum of Squares | df | Mean Square | F-value | P-value | Significance |
|---|---|---|---|---|---|---|
| Model | 42.97 | 9 | 6.26 | 229.51 | < 0.0001 | ** |
| A | 40.49 | 1 | 40.49 | 1946.11 | < 0.0001 | ** |
| B | 0.3719 | 1 | 0.3719 | 17.87 | 0.0017 | ** |
| C | 1.54 | 1 | 1.54 | 74.03 | < 0.0001 | ** |
| Residual | 0.2080 | 10 | 0.2080 | – | – | – |
| Lack of Fit | 0.1770 | 5 | 0.0354 | 5.69 | 0.3960 | – |
| Pure Error | 0.0311 | 5 | 0.0062 | – | – | – |
| Source | Sum of Squares | df | Mean Square | F-value | P-value | Significance |
|---|---|---|---|---|---|---|
| Model | 0.078 | 9 | 0.0071 | 31.33 | < 0.0001 | ** |
| A | 0.0546 | 1 | 0.0546 | 197.40 | < 0.0001 | ** |
| B | 0.0210 | 1 | 0.0210 | 75.88 | < 0.0001 | ** |
| C | 2.966E-06 | 1 | 2.966E-06 | 0.0107 | 0.9196 | – |
| Residual | 0.0028 | 10 | 0.0028 | – | – | – |
| Lack of Fit | 0.0022 | 5 | 0.0004 | 4.03 | 0.0761 | – |
| Pure Error | 0.0006 | 5 | 0.0001 | – | – | – |
3.3 Optimization and Verification
Using the Numerical optimization function of Design Expert software, the optimal process parameters were determined. The verification results are presented below:
| Parameter Combination | Tensile Strength (MPa) | Gas Evolution (mL/g) | Dimensional Deviation (±mm) |
|---|---|---|---|
| Resin: 1.46%, Layer: 0.35 mm, Activator: 0.25% | 2.13 | 9.32 | 0.24 |
The optimized 3D printing sand casting parameters achieved: tensile strength ≥ 1.8 MPa, gas evolution ≤ 10.0 mL/g, and dimensional deviation ≤ ±0.3 mm. Compared to single-factor optimization, the response surface method reduced resin consumption by 8.75% and activator consumption by 16.67%, while increasing printing efficiency by 14.29% through increased layer thickness.
4. Effect of Low-Pressure Casting Parameters on ZL101A Alloy
4.1 Influence of Pouring Temperature
Pouring temperature significantly affects the microstructure and mechanical properties of ZL101A alloy. The microstructure analysis revealed that at 700°C, the aluminum matrix was dispersed with predominantly cellular crystals, and eutectic silicon appeared as large platelet structures. Between 720°C and 740°C, the aluminum matrix became denser with increased secondary dendrite arm numbers, and eutectic silicon transformed into fine, uniformly distributed flakes. At 760°C, the matrix distribution became disordered and eutectic silicon coarsened.
Quantitative measurements using Nano measure software showed the following trends:
| Pouring Temperature (°C) | Cell Crystal Size (μm) | Secondary Dendrite Arm Size (μm) |
|---|---|---|
| 700 | 43 | 28 |
| 720 | 48 | 41 |
| 740 | 48 | 41 |
| 760 | 49 | 42 |
The mechanical properties of ZL101A alloy at different pouring temperatures are shown below:
| Pouring Temperature (°C) | Tensile Strength (MPa) | Elongation (%) |
|---|---|---|
| 700 | 289 | 2.1 |
| 720 | 326 | 2.8 |
| 740 | 312 | 2.5 |
| 760 | 296 | 2.2 |
The optimum pouring temperature range for 3D printing sand casting low-pressure casting was determined to be 720°C to 740°C.
4.2 Influence of Sand Mold Preheating Temperature
The preheating temperature of the 3D printed sand mold was varied from 60°C to 120°C while maintaining a pouring temperature of 740°C. Microstructural observation revealed similar defect-free structures across all conditions. As preheating temperature increased, the degree of undercooling decreased, providing sufficient time for matrix growth. Cellular crystals gradually developed secondary dendrites, forming columnar dendrites with progressive coarsening.
| Preheating Temperature (°C) | Cell Crystal Size (μm) | Secondary Dendrite Arm Size (μm) |
|---|---|---|
| 60 | 32 | 43 |
| 80 | 46 | 51 |
| 100 | 46 | 51 |
| 120 | 45 | 50 |
| Preheating Temperature (°C) | Tensile Strength (MPa) | Elongation (%) |
|---|---|---|
| 60 | 318 | 3.0 |
| 80 | 337 | 3.6 |
| 100 | 325 | 3.1 |
| 120 | 309 | 2.6 |
The optimum sand mold preheating temperature range for this 3D printing sand casting application was determined to be 80°C to 100°C.
4.3 Comparison Between Traditional and 3D Printed Sand Molds
Comparing ZL101A alloy specimens prepared using traditional and 3D printed sand molds under identical low-pressure casting conditions:
| Parameter | Traditional Sand Mold | 3D Printed Sand Mold |
|---|---|---|
| Cell crystal size (μm) | 58 | 47 |
| Secondary dendrite arm size (μm) | 46 | 36 |
| Tensile strength (MPa) | 298 | 315 |
| Elongation (%) | 2.4 | 2.7 |
The results demonstrate that 3D printing sand casting produces superior microstructures and mechanical properties compared to traditional sand mold casting, attributed to the precise performance control and potentially better thermal conductivity of 3D printed sand molds.
5. Casting Process Design and Verification for the Shell Component
5.1 Casting Characteristics Analysis
The selected shell casting has overall dimensions of 335 mm × 335 mm × 197 mm. Wall thickness analysis revealed a maximum thickness of 24.7 mm and minimum of 2.8 mm, with uneven thickness distribution. The casting weighs 7.5 kg and is made of ZL101A alloy. The casting must meet HB 963 Class II acceptance requirements and dimensional tolerances per HB 6103-86 CT9, with excellent internal cavity airtightness.
5.2 Gating System Design
Utilizing the design freedom of 3D printing sand casting, the gating system was designed to follow the casting geometry. The gating system employed an open configuration with the following cross-sectional area ratios:
$$\Sigma A_{直} : \Sigma A_{横} : \Sigma A_{内} = 1.0 : 1.5 : 1.8$$
The design incorporated six vertical cylindrical gates with a diameter of Φ45 mm, uniformly distributed around the casting periphery. Inner gates featured a combination of slotted, stepped, and vertical-cylinder structures. The distance between the inner gate and the casting ranged from 26.5 mm to 42.2 mm. The vertical cylinders were designed to extend above the casting height, enhancing filling and feeding capability while also serving as slag collection reservoirs.
5.3 Riser and Cooling System Design
Zero-process simulation using ProCAST software identified hot spots at the casting bottom and thick-section cavities. Two process schemes were designed:
Process Scheme A: Eight risers at the casting top with heights of 53.3 mm and 70.0 mm. The neck diameters at the riser roots were Φ20 mm and Φ30 mm. Fifteen chills were strategically placed to guide directional solidification.
Process Scheme B: Six inner gates and two risers at the top, with risers connected to the vertical cylindrical gates. The remaining top sections used chills to guide solidification sequence and improve feeding channels.
5.4 Simulation Analysis
The ProCAST simulation software was employed with the following key parameters: casting material AlSi7Mg0.3, sand mold material furan resin sand (CBFMS-M series), and chill material gray iron. The interface heat transfer coefficient between casting and sand mold was 500 W/m²·K, while the coefficient between casting and chill was 2000 W/m²·K.
The filling simulation used a two-stage pressure control: filling pressure of 38 kPa with filling time of 8 seconds, followed by holding pressure of 43 kPa for 600 seconds. Simulation showed both schemes provided smooth filling without jetting or splashing, minimizing the risk of gas entrapment and oxide film formation.
Solidification simulation revealed critical differences between schemes. Scheme A exhibited isolated liquid regions at the casting internal cavity at 240 seconds (total solidification time 285 seconds), creating potential shrinkage porosity. Scheme B demonstrated better thermal gradient control with no isolated liquid regions throughout solidification (total time 240 seconds).
The defect simulation results are summarized below:
| Parameter | Scheme A | Scheme B |
|---|---|---|
| Total shrinkage volume (cc) | 6.779 | 6.063 |
| Average result (%) | 3.240 | 2.462 |
| Porosity volume (cc) | 0.219 | 0.149 |
| Weight (mg) | 0.263 | 0.179 |
Scheme B was selected due to its superior feeding capability, improved solidification sequence, and reduced defect probability. The simulation confirmed that gates feeding thick sections are more effective than risers, and connecting risers to the runner system increases feeding distance while reducing shrinkage defects at riser roots.
5.5 Sand Mold and Core Design
Traditional mold-making methods limit design freedom due to demolding requirements. In contrast, 3D printing sand casting enables integrated molding of casting contours with gating systems. The complex core forming the shell’s internal cavity was printed as a single piece, eliminating dimensional accumulation errors from assembly processes. The core positioning used a combination of vertical and horizontal core prints to prevent displacement or rotation during filling.
The 3D printing sand casting approach achieved mold assembly clearances of 0.1 mm to 0.2 mm, compared to 0.5 mm minimum for traditional methods. The casting mold consisted of 7 sand mold parts and 2 sand cores. With a layer thickness of 0.35 mm, the sand molds were divided into 1600 layers, and printing completed in 8 hours.
5.6 Casting Trials and Results
The shell casting was trial-produced using optimized 3D printing sand casting technology. The complete trial production cycle took only 4 days, representing a nearly 70% reduction compared to traditional casting methods. The casting parameters were: lift pressure of 28 kPa for 21 seconds, filling pressure of 40 kPa for 9 seconds, crust formation pressure of 50 kPa for 3 seconds, and holding pressure of 50 kPa for 500 seconds.
The trial-produced shell castings underwent comprehensive quality inspections:
Dimensional Accuracy: Laser scanning measurement confirmed dimensional tolerances within ±0.9 mm, meeting HB 6103-86 CT9 requirements.
X-Ray Inspection: No significant internal casting defects were found, with critical areas free from shrinkage porosity, gas porosity, and oxide inclusions. The thin-walled pipe sections formed successfully without shrinkage defects.
Air Tightness Test: At a test pressure of 0.18 MPa, the casting was submerged in water for 13 to 16 minutes with no bubbles observed, confirming excellent internal quality and absence of pinhole defects.
Mechanical Properties: The as-cast microstructure was characterized by dense aluminum matrix, finely distributed eutectic silicon, and uniform grain structure. Cell crystal size measured 37 μm and secondary dendrite arm spacing was 30 μm. The mechanical properties obtained from specimens taken directly from the casting were:
| Property | Value |
|---|---|
| Tensile strength (MPa) | 323 |
| Elongation (%) | 2.8 |
| Brinell hardness (HB) | 98 |
Fracture surface analysis by scanning electron microscopy revealed a mixed fracture mode combining cleavage facets and dimples, characteristic of acceptable ductility for this alloy system.
6. Conclusion
This research systematically investigated the 3D printing sand casting process for complex thin-walled aluminum alloy shell castings, yielding the following conclusions:
(1) Single-factor experiments demonstrated that resin inkjet content has the most significant influence on tensile strength, gas evolution, and dimensional deviation of printed sand molds. Layer thickness showed secondary influence on tensile strength and dimensional deviation, while activator content primarily affected gas evolution and exhibited a bell-shaped effect on tensile strength.
(2) Through response surface methodology and central composite design, the optimal 3D printing sand casting parameters were determined: resin inkjet content of 1.46% of sand mass, layer thickness of 0.35 mm, and activator content of 0.25% of sand mass. Under these conditions, the printed sand mold achieved tensile strength ≥ 1.8 MPa, gas evolution ≤ 10.0 mL/g, and dimensional deviation ≤ ±0.3 mm.
(3) Under low-pressure die casting conditions, the optimal pouring temperature range for ZL101A alloy was 720°C to 740°C, yielding cell crystal sizes of approximately 48 μm and secondary dendrite arm spacing of approximately 41 μm. At 720°C, the alloy achieved the best combination of 326 MPa tensile strength and 2.8% elongation. Optimal sand mold preheating temperature ranged from 80°C to 100°C, producing maximum tensile strength of 337 MPa and elongation of 3.6% at 80°C.
(4) Specimens prepared via 3D printing sand casting exhibited superior properties compared to traditional sand mold casting: 47 μm versus 58 μm cell crystal size, 36 μm versus 46 μm secondary dendrite arm spacing, 315 MPa versus 298 MPa tensile strength, and 2.7% versus 2.4% elongation, respectively.
(5) The gating system for the shell casting was designed with cross-sectional area ratios of ΣA直:ΣA横:ΣA内 = 1.0:1.5:1.8, incorporating conformal gate design with slotted, stepped, and vertical-cylinder structures. Simulation confirmed that gate feeding of thick sections is superior to riser feeding, and connecting risers to runners increases feeding distance and reduces root shrinkage defects.
(6) The trial-produced shell casting verified the effectiveness of the optimized 3D printing sand casting process. Dimensional tolerances remained within ±0.9 mm meeting HB 6103-86 CT9. X-ray inspection and air tightness testing confirmed the absence of significant defects. The casting exhibited excellent comprehensive properties with 323 MPa tensile strength, 2.8% elongation, and 98 HB hardness, fully satisfying service requirements.
This research demonstrates that 3D printing sand casting technology combined with low-pressure die casting is extremely well-suited for the rapid development and trial production of thin-walled complex castings, offering significantly shortened development cycles and reliable product performance. The integration of response surface methodology, numerical simulation, and 3D printing technology provides a robust framework for intelligent, green, and high-performance casting manufacturing.