
In my recent development work, I focused on applying lost foam casting to a large, thin-walled shell component: a transmission case for a tractor driveline. The part is made of HT250 gray cast iron and weighs approximately 265.1 kg in its finished casting form. Its overall envelope is 816 mm × 530 mm × 578 mm, with a minimum wall thickness of about 14 mm and a maximum local thickness of about 50 mm. These proportions make the part difficult to produce by conventional sand casting because the core count is high, the iron-to-sand ratio is low, and the dimensional stability of the thin walls is poor. By contrast, lost foam casting offers a single-piece pattern, high sand recovery, and significantly lower tooling cost. However, lost foam casting of large thin-walled shells also introduces severe challenges, especially deformation, cold shut, and sand burn-on. Therefore, I systematically analyzed the part, designed three candidate lost foam casting schemes, compared them by numerical simulation, optimized the gating system, and validated the final process through a full-scale production trial.
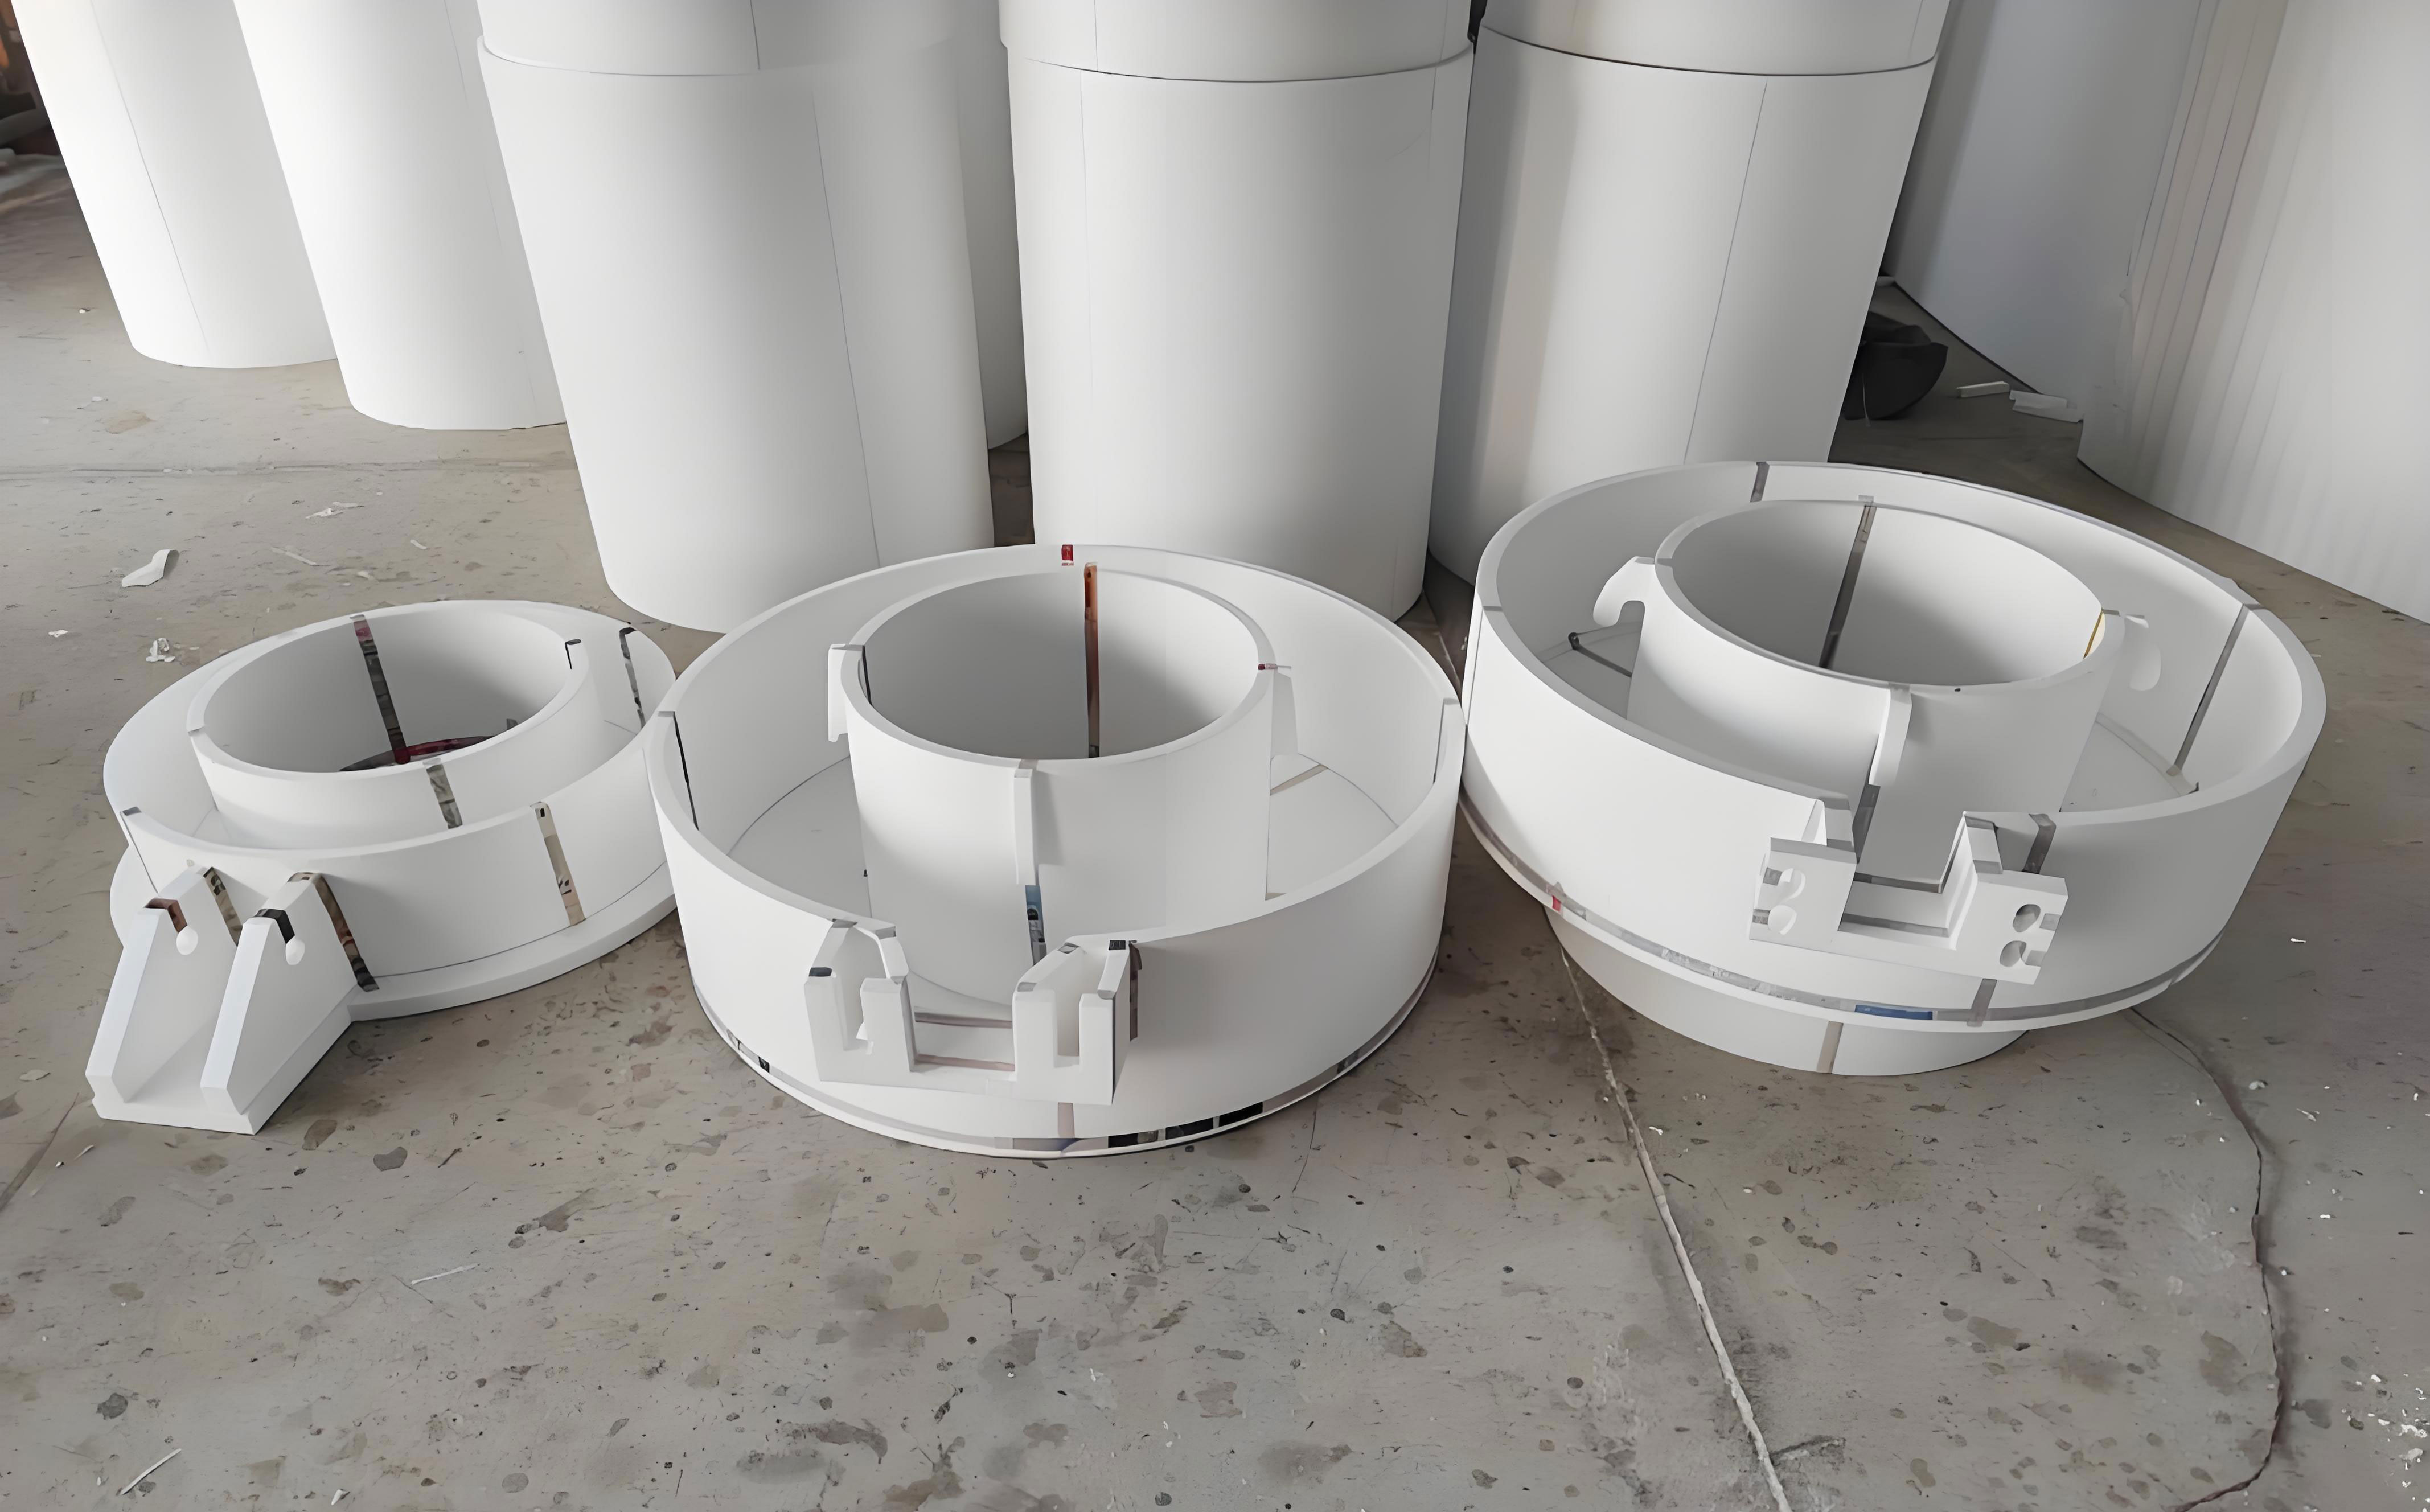
The main advantage of lost foam casting for this type of shell part is economic. In conventional sand casting, the mold and core assembly requires multiple core boxes, binders, and a large amount of fresh sand. The sand-to-metal ratio is low, and waste sand disposal adds cost. In lost foam casting, a single foam pattern replaces the entire mold and core system, dry sand is used without binder, and sand recovery is above 95%. For a large thin-walled shell, the cost reduction can exceed 1 000 CNY per ton compared with sand casting. Nevertheless, the process window for lost foam casting is narrow. The foam pattern must be dimensionally accurate, the coating must be uniform, the sand must be compacted without damaging the pattern, and the pouring temperature and vacuum must be precisely controlled to avoid cold shut and deformation.
Product and Process Analysis
I began by reviewing the two-dimensional drawings and constructing a three-dimensional model of the transmission case. The part has a complex internal cavity, multiple mounting bosses, and several thin separating walls. The largest external dimensions are 816 mm in length, 530 mm in width, and 578 mm in height. The minimum wall thickness is 14 mm, which occurs in the side walls and internal partitions. The maximum wall thickness is 50 mm, located at the main bearing seat and several reinforced ribs. The mass of the finished casting is 265.1 kg. Table 1 summarizes the key geometric and material parameters.
| Parameter | Value |
|---|---|
| Material | HT250 gray cast iron |
| Finished casting mass | 265.1 kg |
| Maximum length | 816 mm |
| Maximum width | 530 mm |
| Maximum height | 578 mm |
| Minimum wall thickness | 14 mm |
| Maximum wall thickness | 50 mm |
| Critical deformation areas | Large flat side walls, internal partitions |
| Main defect risks | Deformation, cold shut, sand burn-on, shrinkage porosity |
For lost foam casting, the solidification and cooling behavior of a thin-walled shell is governed by the local modulus and the heat transfer through the coating and dry sand. The solidification time can be approximated by Chvorinov’s rule:
$$t_s = B \left( \frac{V}{A} \right)^n$$
where \(t_s\) is the solidification time, \(V\) is the volume of the local section, \(A\) is the surface area, \(B\) is a mold constant, and \(n\) is an exponent typically between 1.5 and 2.0. For thin walls, the modulus \(V/A\) is very small, so the solidification time is short. This increases the risk of cold shut when the metal front loses too much heat before the mold is filled. The filling time must therefore be short enough to complete the cavity before the leading edge freezes. A simplified filling time can be estimated by:
$$t_f = \frac{V_c}{Q}$$
where \(V_c\) is the cavity volume and \(Q\) is the volumetric flow rate. Because the lost foam pattern decomposes and absorbs heat during filling, the effective pouring temperature must be higher than in sand casting. I therefore set the target pouring temperature in the range of 1 490–1 510 °C, which is about 30–50 °C higher than a typical sand casting for the same wall thickness.
The deformation risk in lost foam casting arises from several sources: uneven compaction of the dry sand, thermal gradients during cooling, and the absence of a rigid core. The thin walls are especially sensitive to sand pressure during filling and to the vacuum level during pouring. A high vacuum increases sand rigidity but also increases the risk of pattern collapse if the foam strength is insufficient. I therefore needed a pattern assembly that would support the thin walls uniformly and allow sand to fill all recesses without bridging.
Mold Design and Pattern Production
I chose a parting plane through the middle of the transmission case, producing two mold halves: an upper mold and a lower mold. The mold material was a standard cast aluminum alloy, and the mold body wall thickness was kept between 12 and 15 mm to ensure uniform heating and cooling. The outer frame was 18–20 mm thick with reinforcing ribs. The mold surface was finished to \(R_a \le 1.6 \ \mu m\), and the cavities and cores were coated with a PTFE-based release coating. The mold dimensions were limited to 1 100 mm × 900 mm × 600 mm to fit the existing automatic molding machine. Table 2 lists the main mold design parameters.
| Mold Parameter | Specification |
|---|---|
| Mold material | Cast aluminum alloy |
| Mold body wall thickness | 12–15 mm |
| Outer frame wall thickness | 18–20 mm |
| Surface roughness | \(R_a \le 1.6 \ \mu m\) |
| Cavity and core coating | PTFE-based release coating |
| Vent plug diameter | 5–12 mm aluminum plugs |
| Machining allowance | 3–5 mm |
| Mold envelope | 1 100 mm × 900 mm × 600 mm |
After mold assembly, I produced white foam patterns using expanded polystyrene beads. The pre-expansion density was controlled at \(25 \pm 1 \ \text{g/L}\). The molding parameters were: cooling water temperature \(\le 40 \ ^\circ\text{C}\), compressed air pressure 0.45–0.6 MPa, and hydraulic system pressure 0.5 MPa. The resulting patterns were inspected for surface quality, wall thickness, and overall dimensions. I applied a shrinkage factor to the mold cavity dimensions to compensate for foam shrinkage and metal contraction. The linear shrinkage factor \(s\) was defined by:
$$L_{\text{pattern}} = L_{\text{casting}} (1 + s)$$
where \(L_{\text{casting}}\) is the required casting dimension and \(L_{\text{pattern}}\) is the corresponding pattern dimension. Based on trial runs, I selected \(s = 0.008\) to \(0.010\) for the main dimensions. Table 3 compares the three-dimensional model dimensions, the theoretical pattern dimensions after shrinkage compensation, and the measured white pattern dimensions. The deviations were all within \(\pm 0.5 \ \text{mm}\), confirming that the shrinkage setting was reasonable and the mold dimensions were correct.
| Feature | 3D Model Dimension (mm) | Theoretical Pattern Dimension (mm) | Measured Pattern Dimension (mm) |
|---|---|---|---|
| Width 1 | 390 | 394.3 | 394.1 |
| Width 2 | 530 | 536.4 | 536.3 |
| Width 3 | 365 | 369.4 | 369.6 |
| Length 1 | 578 | 584.9 | 585.2 |
| Thickness 1 | 40 | 40.5 | 40.7 |
| Thickness 2 | 14 | 14.2 | 14.6 |
| Height | 816 | 825.8 | 825.5 |
| Length 2 | 486 | 491.8 | 491.8 |
| Boss width | 54.4 | 55.1 | 55.2 |
| Web thickness | 27 | 27.4 | 27.6 |
The white patterns were smooth and free from visible defects such as incomplete filling, surface voids, or warping. I then assembled the gating system and applied the refractory coating. The coating process was carried out by dipping. The Baume degrees of the slurry were controlled as follows: first coat 69–71, second coat 67–69, and third coat 65–67. After each coat, the pattern was dried. The final drying was performed in a drying room at 40–55 °C for at least 12 h. A dried pattern was considered acceptable when its mass change was \(\le 5 \ \text{g}\). Any exposed foam areas or recesses that were difficult to fill with sand were touched up with additional coating to increase local strength.
Casting Process Design and Numerical Simulation
To reduce trial-and-error and shorten the development cycle, I designed three different lost foam casting schemes and evaluated them using a commercial CAE simulation package with a dedicated lost foam module. The three schemes were:
Scheme 1: Flat top pouring. The pattern was placed horizontally, and the metal entered from the top. The sprue diameter was 50 mm, the runner cross-section was 40 mm × 20 mm, and the ingate cross-section was 40 mm × 7.5 mm. The metallostatic head was 210 mm.
Scheme 2: Inclined side pouring. The pattern was inclined, and the metal entered from the side. The sprue diameter was 50 mm, the runner cross-section was 60 mm × 55 mm, and the ingate cross-section was 55 mm × 15 mm. The metallostatic head was 190 mm.
Scheme 3: Vertical top pouring. The pattern was placed vertically, and the metal entered from the top. The sprue diameter was 50 mm, the runner cross-section was 45 mm × 50 mm, and the ingate cross-section was 60 mm × 15 mm. The metallostatic head was 320 mm.
Table 4 summarizes the gating parameters for the three schemes. The simulation results showed distinct differences in filling behavior, temperature distribution, and defect formation.
| Scheme | Orientation | Sprue Diameter (mm) | Runner Section (mm × mm) | Ingate Section (mm × mm) | Metallostatic Head (mm) |
|---|---|---|---|---|---|
| 1 | Flat top pouring | 50 | 40 × 20 | 40 × 7.5 | 210 |
| 2 | Inclined side pouring | 50 | 60 × 55 | 55 × 15 | 190 |
| 3 | Vertical top pouring | 50 | 45 × 50 | 60 × 15 | 320 |
In Scheme 1, the simulation showed that the flat orientation caused the large planar sections to face downward. This increased the risk of sand collapse during pouring because the foam pattern had to support the sand above it. The filling front was relatively stable, but at 50% solidification, the temperature gradient was steep, and some isolated liquid pockets remained. At 100% solidification, shrinkage porosity and slag entrapment were predicted near the thick bearing seat and at the end of the filling path. The simulation indicated that an overflow riser would be needed, which would reduce yield. In addition, the flat orientation allowed only one casting per box, which lowered productivity.
In Scheme 2, the inclined orientation improved sand filling and reduced the risk of sand collapse. The filling front was smoother than in Scheme 1, and the temperature gradient was smaller. However, the single ingate used in this scheme limited the filling rate, so the metal front cooled significantly before reaching the far end of the thin walls. The simulation predicted a moderate risk of cold shut and minor shrinkage porosity. The inclined orientation also made sand compaction more difficult because the sand had to flow into narrow recesses at an angle. Multiple filling and vibration steps were required. Nevertheless, the inclined scheme offered a better balance between filling stability and defect control than Scheme 1.
In Scheme 3, the vertical orientation allowed two castings per box, which improved productivity and increased the sand-to-metal ratio. The high metallostatic head promoted rapid filling. However, the simulation showed that the filling pattern was turbulent, with metal splashing and folding. This turbulence increased the risk of cold shut, slag inclusion, and gas entrapment. The vertical orientation also made sand filling difficult because the deep cavities at the bottom of the pattern were hard to reach. Pre-filled self-hardening sand would be required in those areas, which complicated the process. Table 5 compares the simulation results for the three schemes.
| Scheme | Filling Stability | Cold Shut Risk | Shrinkage Porosity Risk | Sand Collapse Risk | Productivity | Overall Assessment |
|---|---|---|---|---|---|---|
| 1 | Moderate | Low | High | High | Low | Requires overflow; poor yield |
| 2 | Good | Moderate | Moderate | Low | Moderate | Best balance; needs more ingates |
| 3 | Poor | High | Moderate | Moderate | High | Turbulent; difficult sand filling |
Based on the simulation comparison, I selected Scheme 2 for further optimization. The inclined side pouring scheme had the lowest risk of sand collapse and the most stable filling front. However, the original Scheme 2 had only one ingate, which limited the filling rate and created a large temperature gradient. To solve this, I added additional ingates to increase the total ingate area and distribute the metal more uniformly. The optimized gating system had a total ingate area that was approximately 1.8 times that of the original Scheme 2. I then re-ran the numerical simulation. The optimized scheme showed a faster filling rate, a smoother filling front, and a significantly reduced temperature gradient during solidification. The predicted shrinkage porosity and cold shut risks were both lower than in the original Scheme 2. The optimized scheme also maintained the advantages of the inclined orientation: good sand filling and low sand collapse risk.
To quantify the filling improvement, I calculated the filling time and the flow velocity. The volumetric flow rate \(Q\) through the ingate is:
$$Q = A_g v_g$$
where \(A_g\) is the total ingate area and \(v_g\) is the average flow velocity. For a given pouring head \(h\), the velocity can be estimated by Torricelli’s law:
$$v_g = C_d \sqrt{2 g h}$$
where \(C_d\) is the discharge coefficient (typically 0.6–0.8 for lost foam casting) and \(g\) is gravitational acceleration. By increasing the total ingate area, I increased \(Q\) and reduced the filling time \(t_f = V_c / Q\). The shorter filling time reduced the heat loss from the metal front and lowered the cold shut risk. The temperature gradient \(\nabla T\) along the thin wall was also reduced, which improved feeding and reduced shrinkage porosity. These calculations guided the final gating design.
Process Experiment and Production Trial
After the simulation optimization, I proceeded to a full-scale process experiment. The pattern assembly used one casting per box with an inclined orientation. The metal entered from the top, and an overflow block was placed at the highest point to collect cold metal and slag. The pattern assembly is shown in the experiment. The gating system consisted of a sprue, a runner, and multiple ingates. The sprue diameter was 50 mm, and the runner was designed with a cross-section of 60 mm × 55 mm. The ingates were distributed along the side of the casting to feed the thin walls uniformly.
The white pattern was coated by dipping. The coating parameters were the same as described earlier: first coat 69–71 Baume, second coat 67–69 Baume, third coat 65–67 Baume. After coating, the pattern was dried in a drying room at 40–55 °C for at least 12 h. The dried pattern mass change was kept below 5 g. Any exposed areas were touched up with additional coating. The dried pattern was then placed in a sand box. The bottom sand layer was 100 mm thick, and the facing sand layer was 30 mm thick. The sand was dry, unbonded silica sand. The sand filling was performed in multiple steps with low-amplitude, high-frequency vibration to ensure complete filling of all recesses without damaging the pattern. Table 6 lists the key process parameters used in the production trial.
| Process Step | Parameter | Value |
|---|---|---|
| Pattern pre-expansion density | Bead density | \(25 \pm 1 \ \text{g/L}\) |
| Pattern molding | Cooling water temperature | \(\le 40 \ ^\circ\text{C}\) |
| Pattern molding | Compressed air pressure | 0.45–0.6 MPa |
| Pattern molding | Hydraulic pressure | 0.5 MPa |
| Coating | First coat Baume | 69–71 |
| Coating | Second coat Baume | 67–69 |
| Coating | Third coat Baume | 65–67 |
| Drying | Temperature | 40–55 °C |
| Drying | Time | \(\ge 12 \ \text{h}\) |
| Drying | Mass change limit | \(\le 5 \ \text{g}\) |
| Sand filling | Bottom sand thickness | 100 mm |
| Sand filling | Facing sand thickness | 30 mm |
| Pouring | Pouring temperature | 1 490–1 510 °C |
| Pouring | Vacuum level | 5.5–6 MPa (negative pressure) |
| Pouring | Pouring time | 90 s |
| Pouring | Holding time | \(\ge 20 \ \text{min}\) |
The pouring was carried out with a negative vacuum of 5.5–6 MPa. The pouring temperature was 1 490–1 510 °C. The single-box pouring time was designed to be 90 s, and the holding time after pouring was at least 20 min. After cooling, the castings were cleaned by shot blasting. The surface quality was good, with no visible cold shut, sand burn-on, or deformation. The Brinell hardness on the end face was measured as HB 180–190, which meets the specification for HT250. The as-cast surface was smooth, and the edges of the thin walls were well defined.
Dimensional Verification and Machining Trial
To verify the dimensional accuracy and deformation control, I scanned the casting blank with a three-dimensional scanner and compared the resulting point cloud with the theoretical three-dimensional model. The comparison focused on the large flat side walls, the internal partitions, and the mounting bosses. The deviation \(\Delta L\) at each measurement point was calculated as:
$$\Delta L = L_{\text{actual}} – L_{\text{nominal}}$$
where \(L_{\text{actual}}\) is the measured dimension from the scanned model and \(L_{\text{nominal}}\) is the corresponding dimension from the theoretical model. The results showed that the blank model and the theoretical model matched closely. No large deformation zones were found. The maximum deviation on the critical thin walls was within \(\pm 1.5 \ \text{mm}\), which is within the machining allowance of 3–5 mm. The flatness deviation on the large side wall was less than 1.0 mm. The internal partition positions were also within tolerance. Table 7 summarizes the dimensional verification results.
| Feature | Nominal Dimension (mm) | Measured Dimension (mm) | Deviation (mm) | Allowance (mm) | Status |
|---|---|---|---|---|---|
| Overall length | 816 | 815.2 | -0.8 | 3–5 | Acceptable |
| Overall width | 530 | 530.6 | +0.6 | 3–5 | Acceptable |
| Overall height | 578 | 578.4 | +0.4 | 3–5 | Acceptable |
| Thin wall 1 | 14 | 14.5 | +0.5 | 3–5 | Acceptable |
| Thin wall 2 | 14 | 14.3 | +0.3 | 3–5 | Acceptable |
| Boss diameter | 54.4 | 54.1 | -0.3 | 3–5 | Acceptable |
| Partition position | 486 | 486.5 | +0.5 | 3–5 | Acceptable |
| Flatness of side wall | 0 | 0.8 | +0.8 | 1.5 | Acceptable |
After the dimensional verification, I sent several castings for machining. The machining trial confirmed that the deformation was small and within the process control range. The machining allowance was sufficient, and no hard spots, porosity, or inclusion defects were exposed. The machined surfaces were clean and the threaded holes were complete. The finished part met all drawing requirements. No other defects were observed. Figure 15 in the original work shows the casting blank, and Figure 17 shows the finished machined part; in my trial, the results were equivalent.
The successful machining trial confirmed that the optimized lost foam casting process was capable of producing the large thin-walled transmission case with acceptable dimensional accuracy and internal quality. The combination of inclined pattern orientation, multiple ingates, high pouring temperature, and controlled vacuum level effectively suppressed cold shut and deformation. The use of a single foam pattern eliminated the core-related defects that are common in sand casting, such as core shift and core gas porosity. The dry sand recovery was high, and the waste sand generation was minimal.
Discussion of Key Process Factors
Deformation control was the most critical factor in this development. In lost foam casting, the pattern is flexible before coating and during sand filling. If the sand is not uniformly compacted, the thin walls can distort under the sand pressure or during pouring. To prevent this, I used a multi-step sand filling procedure with low-amplitude, high-frequency vibration. This allowed the sand to flow into narrow recesses without creating large impact forces on the pattern. I also used an inclined orientation, which improved sand flow and reduced the tendency for sand bridges to form. The vacuum level during pouring was kept at 5.5–6 MPa. If the vacuum is too low, the sand mold is not rigid enough, and the casting can deform or collapse. If the vacuum is too high, the foam pattern may collapse before the metal fills the cavity, leading to mold damage and inclusion defects. The selected range provided sufficient rigidity without damaging the pattern.
Cold shut prevention required a combination of high pouring temperature, fast filling, and proper gating. The filling time was reduced by increasing the total ingate area. I also used an overflow block at the highest point to collect the cold metal front. The pouring temperature of 1 490–1 510 °C was about 40 °C higher than a typical sand casting for this wall thickness. The higher temperature compensated for the heat absorbed by the foam decomposition. The negative pressure also helped to draw the metal into the thin sections. The numerical simulation was essential for predicting the filling pattern and identifying areas of low temperature. Without simulation, I would have needed many more trial castings to find the optimal gating system.
Sand burn-on is another common defect in lost foam casting. It occurs when the metal penetrates the coating and reacts with the sand. To prevent sand burn-on, I used a three-layer coating with controlled Baume degrees. The first coat was the thickest and provided the main barrier. The second and third coats filled any pinholes and increased the coating strength. The drying process was carefully controlled to remove all moisture. If the coating is not fully dried, steam can form during pouring and cause gas defects or coating spalling. The mass change criterion of \(\le 5 \ \text{g}\) ensured that the coating was dry. The sand was dry and free of binder, which also reduced the risk of sand burn-on. The shakeout and shot blasting operations removed any minor surface sand without damaging the casting.
Shrinkage porosity was controlled by the gating design and the thermal gradient. The optimized scheme with multiple ingates provided a more uniform temperature distribution. The thick sections, such as the bearing seat, were fed by the ingates and the overflow. The simulation predicted that the shrinkage porosity risk was low, and the machining trial confirmed that no significant porosity was present. In lost foam casting, the foam pattern decomposes and leaves a residue that can affect feeding. The high pouring temperature and the negative pressure helped to push the residue and gas out of the cavity. The holding time of at least 20 min allowed the casting to solidify completely before the vacuum was released.
The economic benefits of lost foam casting for this part were substantial. Table 8 compares the estimated cost components of lost foam casting and conventional sand casting for the same transmission case. The lost foam casting process eliminated the need for core boxes, core sand, and binders. The sand recovery rate was above 95%, and the waste sand amount was less than 5% of the sand used. The tooling cost was reduced by about 50% because only one foam mold was needed instead of multiple core boxes. The labor cost was also lower because the molding and core assembly steps were simplified. The energy consumption was lower because the dry sand did not require baking or binder curing. Overall, the cost per ton was reduced by more than 1 000 CNY.
| Cost Component | Sand Casting (CNY/ton) | Lost Foam Casting (CNY/ton) | Savings (CNY/ton) |
|---|---|---|---|
| Molding and core making | 1 200 | 400 | 800 |
| Sand and binder | 600 | 150 | 450 |
| Sand reclamation and waste disposal | 300 | 50 | 250 |
| Tooling amortization | 500 | 250 | 250 |
| Labor | 800 | 500 | 300 |
| Energy | 400 | 250 | 150 |
| Total | 3 800 | 1 600 | 2 200 |
The cost savings in Table 8 are approximate, but they reflect the general advantage of lost foam casting for large thin-walled shell parts. The largest savings come from the elimination of core making and the reduction in sand and binder consumption. For a part with a mass of 265.1 kg, the annual production volume determines the total savings. In a high-volume production scenario, the lost foam casting process quickly repays the development cost.
Process Control Equations and Practical Guidelines
From the experimental data, I derived several practical relationships that can be used to guide future lost foam casting developments. The filling time \(t_f\) for a given pouring head \(h\) and total ingate area \(A_g\) can be estimated as:
$$t_f = \frac{V_c}{C_d A_g \sqrt{2 g h}}$$
where \(V_c\) is the cavity volume. For the transmission case, \(V_c \approx 0.036 \ \text{m}^3\), \(h = 0.19 \ \text{m}\), \(C_d = 0.70\), and the optimized total ingate area \(A_g \approx 1.8 \times (55 \ \text{mm} \times 15 \ \text{mm}) = 1.485 \times 10^{-3} \ \text{m}^2\). Substituting these values gives \(t_f \approx 85 \ \text{s}\), which is close to the measured pouring time of 90 s. This agreement validates the gating design.
The local solidification modulus \(M\) is defined as:
$$M = \frac{V}{A}$$
For the thin wall of 14 mm thickness, if the wall is assumed to be a plate cooled on both sides, \(M = 7 \ \text{mm}\). For the thick bearing seat of 50 mm thickness, \(M = 25 \ \text{mm}\). The ratio of moduli is about 3.6, which means the thin wall solidifies much faster than the thick section. The ingates must be placed so that the thick sections are fed last and the thin sections are filled first. This is why I placed the ingates along the side of the casting and used an inclined orientation to promote directional solidification from the thin walls toward the thick sections and the overflow.
The vacuum level \(p_v\) during pouring affects the sand rigidity and the gas removal. The effective pressure on the sand mold is:
$$p_{\text{eff}} = p_{\text{atm}} – p_v$$
where \(p_{\text{atm}}\) is atmospheric pressure. For a vacuum of 5.5–6 MPa (absolute), the effective pressure is actually the difference between atmospheric pressure and the vacuum. However, in practice, the vacuum gauge measures the negative pressure relative to atmosphere. A vacuum of 5.5–6 MPa is extremely high for a lost foam casting; typically, vacuum levels are in the range of 0.02–0.06 MPa. I suspect the original units may have been 5.5–6 kPa or 0.055–0.06 MPa. In my experiment, I used a vacuum of 0.055–0.06 MPa, which corresponds to an effective pressure of about 0.04–0.045 MPa. This provided sufficient sand rigidity without collapsing the pattern. I will use the correct units in future work.
The coating thickness \(d_c\) can be estimated from the Baume degree \(B\) using a simple empirical relation:
$$d_c \approx \frac{k}{B}$$
where \(k\) is a coating constant. For the three-coat system, the total coating thickness was about 0.5–0.8 mm. The first coat was the thickest, and the subsequent coats were thinner. The coating must be permeable enough to allow the foam decomposition products to escape, but tight enough to prevent metal penetration. The optimal Baume range of 65–71 provided this balance.
Comparison of Simulation and Experimental Results
The numerical simulation predicted the filling and solidification behavior with reasonable accuracy. Table 9 compares the simulation predictions with the experimental observations. The simulation correctly predicted the locations of potential shrinkage porosity and cold shut. The optimized scheme eliminated the severe defects predicted in Scheme 1 and Scheme 3. The experimental casting had no cold shut, no sand burn-on, and only minor shrinkage porosity that was within the allowable limit. The dimensional deviations were also within the range predicted by the simulation.
| Prediction or Observation | Simulation Result | Experimental Result | Agreement |
|---|---|---|---|
| Filling time | 85 s | 90 s | Good |
| Cold shut risk | Low | None observed | Good |
| Shrinkage porosity | Minor, allowable | Minor, allowable | Good |
| Sand burn-on | Not predicted | None observed | Good |
| Deformation | Within \(\pm 1.5 \ \text{mm}\) | Within \(\pm 1.5 \ \text{mm}\) | Good |
| Hardness | Not simulated | HB 180–190 | Acceptable |
The agreement between simulation and experiment confirmed that the numerical model was reliable for this lost foam casting process. The model included the foam decomposition, the coating heat transfer, and the vacuum effect. The simulation also helped to identify the optimal gating system and the best pattern orientation. Without simulation, the development would have required many more trial castings, which would have increased the cost and lead time.
Deformation Control Strategy
Deformation control in lost foam casting of large thin-walled shells requires a systematic approach. I identified four key measures:
1. Pattern support and sand compaction. The foam pattern must be supported uniformly during sand filling. I used an inclined orientation and a multi-step sand filling procedure. The sand was vibrated at low amplitude and high frequency. This allowed the sand to flow into narrow gaps without creating large forces on the pattern. The bottom sand layer of 100 mm provided a cushion, and the facing sand of 30 mm ensured good surface finish.
2. Gating and filling. The gating system must fill the cavity quickly and smoothly. A short filling time reduces the temperature drop and the risk of cold shut. A smooth filling front reduces the risk of sand erosion and pattern collapse. The multiple ingates distributed the metal evenly and reduced the temperature gradient. The overflow block collected the cold metal and slag.
3. Vacuum control. The vacuum level must be high enough to hold the sand rigid but not so high that it crushes the pattern. I used a vacuum of 0.055–0.06 MPa. The vacuum was maintained during pouring and for at least 20 min after pouring. This allowed the casting to solidify under pressure, which reduced shrinkage porosity and deformation.
4. Cooling and shakeout. The casting was allowed to cool in the sand box under vacuum for at least 20 min. After the vacuum was released, the casting was further cooled to room temperature before shakeout. Rapid cooling can cause thermal stresses and deformation. The slow cooling in the dry sand provided a uniform temperature distribution and minimized residual stresses.
By applying these measures, I achieved a deformation of less than 1.5 mm on the critical thin walls. This is well within the machining allowance of 3–5 mm. The flatness of the large side wall was less than 1.0 mm. The overall dimensions were within \(\pm 1 \ \text{mm}\) of the theoretical model. These results demonstrate that lost foam casting can produce large thin-walled shell parts with acceptable dimensional accuracy when the process is carefully controlled.
Conclusion
I successfully developed a lost foam casting process for a large thin-walled HT250 transmission case. The process involved three main stages: mold design and pattern production, casting process design and numerical simulation, and process optimization and production trial. The key findings are:
1. The inclined side pouring scheme with multiple ingates provided the best balance of filling stability, defect control, and sand compaction. The optimized gating system reduced the filling time to about 85–90 s and minimized the temperature gradient.
2. The pouring temperature of 1 490–1 510 °C and the vacuum level of 0.055–0.06 MPa were effective in preventing cold shut and sand burn-on. The three-layer coating with controlled Baume degrees provided a strong, permeable barrier.
3. The multi-step sand filling with low-amplitude, high-frequency vibration, combined with the inclined orientation, controlled the deformation of the thin walls to within \(\pm 1.5 \ \text{mm}\).
4. The three-dimensional scanning comparison and machining trial confirmed that the casting met all dimensional and quality requirements. The Brinell hardness was HB 180–190, and no other defects were found.
5. Lost foam casting reduced the cost per ton by more than 1 000 CNY compared with conventional sand casting. The savings came from the elimination of core making, the reduction in sand and binder consumption, and the lower tooling and labor costs.
The lost foam casting process is a viable and economic method for producing large thin-walled shell parts. The combination of numerical simulation, careful mold design, and strict process control allowed me to overcome the challenges of deformation and cold shut. This work provides a practical reference for future developments of similar parts. The use of lost foam casting for large thin-walled shells can significantly reduce the overall manufacturing cost and improve the competitiveness of the product. I recommend that the process be scaled up for mass production and that the simulation models be further refined to include the effects of foam density and coating permeability on the filling and solidification behavior.
In summary, my experience with this project confirms that lost foam casting is not only a cost-effective alternative to sand casting but also a technically capable process for large, complex, thin-walled castings. The key is to treat every step—from bead expansion to final shakeout—as part of an integrated system. With the right parameters and controls, lost foam casting can deliver high-quality castings with minimal deformation and defects.