
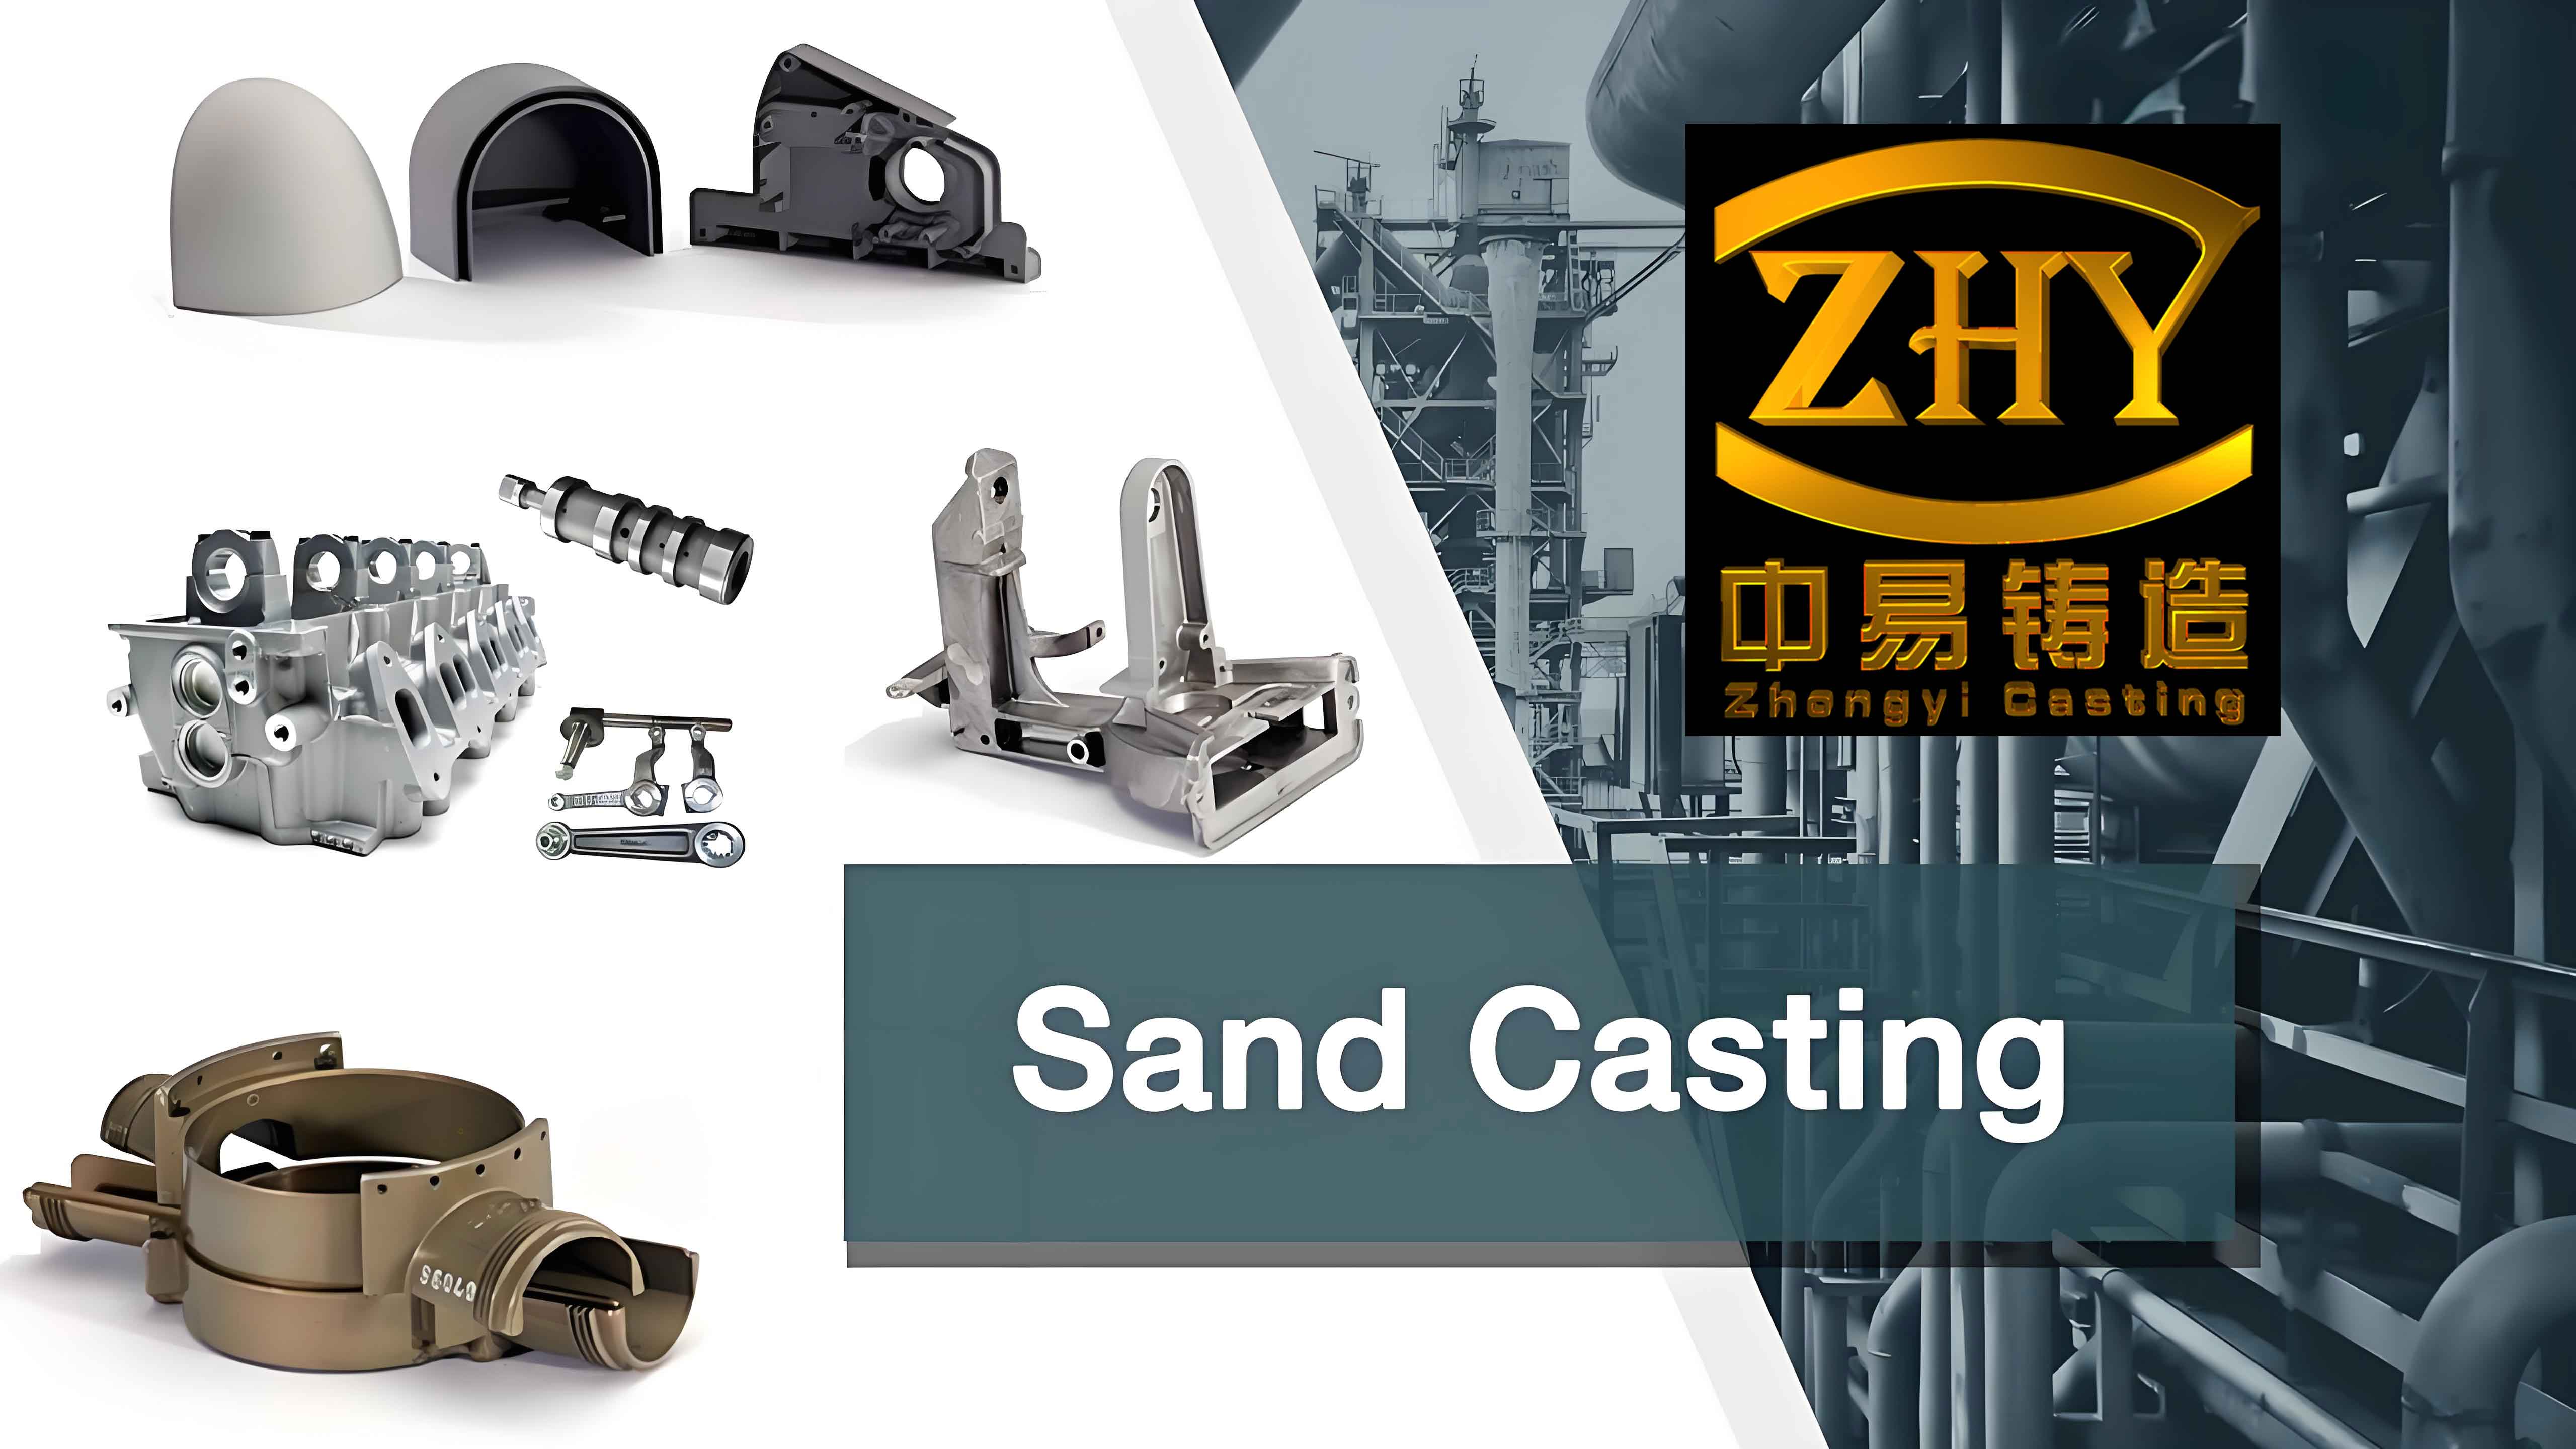
I have carried out this study to address the high energy consumption, low resource efficiency, and significant environmental impact of the sand mould casting industry. Sand mould casting remains one of the most widely used metal forming processes because it can produce complex parts with low material cost and broad alloy adaptability. However, the process involves many stages, including melting, moulding, core making, pouring, cooling, shakeout, cleaning, and machining. Each stage consumes energy and materials and generates carbon emissions. I believe that improving the carbon benefit of sand mould casting at the process design stage is an effective way to promote sustainable development in traditional manufacturing. In my research, I classify sand mould casting process design features, establish a carbon benefit model that integrates carbon emission, production time, and resource cost, and optimize the associated process parameters. The optimized schemes are validated through simulation and production data analysis. The image below shows representative sand mould casting parts, which illustrates the complexity and variety of products that can be manufactured by this process.
Process Analysis of Sand Mould Casting
I begin by analyzing the sand mould casting process because its discrete and multi-stage nature makes it necessary to identify where carbon emissions, time consumption, and cost are generated. The typical sand mould casting process includes the following production departments: melting, moulding, core making, sand handling, pouring, cooling, shakeout, cleaning, and machining. The melting department consumes large amounts of coke, electricity, and metallic charge materials. The moulding and core making departments consume moulding sand, binders, and energy for sand mixing, compaction, and curing. The pouring department requires proper pouring temperature and pouring time to ensure complete filling and sound solidification. The cooling and shakeout departments involve waiting time and sand recovery. The cleaning department includes removal of gates and risers, grinding, shot blasting, and inspection. The machining department removes excess material to achieve final dimensions. Therefore, any change in process design features can influence the downstream operations and the overall carbon benefit of sand mould casting.
I observe that sand mould casting has the following characteristics. First, the process is highly dependent on the geometry and material of the casting. Second, many operations are performed in batches, so the production time includes both main processing time and auxiliary time. Third, carbon emissions come from direct fuel combustion, electricity consumption, and material production. Fourth, resource cost includes energy, materials, labor, and remaining costs such as tooling and scrap loss. These characteristics mean that a single indicator, such as carbon emission alone, is not sufficient to evaluate the overall performance of a sand mould casting process design. I therefore propose a carbon benefit model that considers carbon emission, production time, and resource cost together.
Classification of Sand Mould Casting Process Design Features
In my study, I classify the process design features of sand mould casting into three categories: casting material features, casting geometry structural features, and pouring features. This classification helps me link each feature to its associated process parameters and then to the carbon benefit model. I define casting material features as the features related to material properties, such as moulding sand type, sand thermal conductivity, alloy type, binder ratio, and curing agent ratio. I define casting geometry structural features as the features related to the geometry of the casting and the mould, such as wall thickness, cast holes, fillets, grooves, ribs, mould wall thickness, and number of sand cores. I define pouring features as the features related to the gating and feeding system, such as sprue type, runner type, ingate type, gating ratio, riser type, riser number, and riser dimensions. Table 1 summarizes the classification and gives examples of associated process parameters.
| Feature Category | Definition | Examples | Associated Process Parameters |
|---|---|---|---|
| Casting material features (CF) | Features related to material properties in sand mould casting | Moulding sand, binder, alloy, curing agent | Sand gas evolution, thermal conductivity, alloy fluidity, binder ratio |
| Casting geometry structural features (HF) | Features related to casting and mould geometry | Wall thickness, holes, fillets, grooves, ribs, cores | Machining allowance, core diameter, core length, number of cores, draft angle |
| Pouring features (ZF) | Features related to gating and feeding systems | Sprue, runner, ingate, riser, pouring cup | Pouring temperature, pouring time, gating ratio, riser type, riser mass |
I further analyze the influence mechanism of these features on sand mould casting. Casting material features affect the fluidity of the molten metal, the heat transfer between the metal and the mould, and the gas evolution of the sand. For example, a higher sand gas evolution can increase the risk of gas porosity, which may require a higher pouring temperature or a longer cooling time. Casting geometry structural features affect the mould design, the core design, and the machining allowance. For instance, when the diameter of a hole is small, it is often more economical to form the hole by machining rather than by using a sand core. When the hole diameter is large enough, a sand core can be used to cast the hole directly, which reduces the machining time and metal waste. Pouring features affect the filling and solidification behavior. A properly designed gating system can avoid turbulence, slag inclusion, and incomplete filling. A properly designed riser can compensate for shrinkage and eliminate shrinkage porosity. Therefore, the parameters associated with these features must be optimized together with the quality constraints of sand mould casting.
Table 2 shows the dimensional tolerance grades for single-piece and small-batch production in sand mould casting. I use this table to select reasonable process parameters for the case studies. The tolerance grade depends on the casting material and the moulding method. For example, grey cast iron produced with chemical binder sand has a tolerance grade of 11–13, while the same material produced with green sand has a tolerance grade of 13–15. This means that the choice of material feature and moulding method can change the allowable dimensional variation and consequently the machining allowance.
| Casting Material | Green Sand Tolerance Grade | Chemical Binder Sand Tolerance Grade |
|---|---|---|
| Cast steel | 13–15 | 12–14 |
| Grey cast iron | 13–15 | 11–13 |
| Ductile iron | 13–15 | 11–13 |
| Malleable iron | 13–15 | 11–13 |
| Copper alloy | 13–15 | 10–12 |
| Light metal alloy | 11–13 | 10–12 |
| Nickel-based alloy | 13–15 | 12–14 |
Carbon Benefit Model for Sand Mould Casting Process Design Features
I establish the carbon benefit model by quantifying three components: carbon emission, production time, and resource cost. The carbon benefit model is expressed as a weighted sum of these three components. A lower value of the carbon benefit indicates a better process design. The weights can be adjusted according to the production priorities of a foundry. For example, if a foundry prioritizes carbon reduction, the weight for carbon emission can be increased. If a foundry prioritizes production efficiency, the weight for production time can be increased. If a foundry prioritizes economic profit, the weight for resource cost can be increased.
The total carbon emission of sand mould casting is divided into energy carbon emission, material carbon emission, and process carbon emission. I express the total carbon emission as:
$$C_{E_{Total}} = C_N + C_M + C_P$$
where \(C_{E_{Total}}\) is the total carbon emission, \(C_N\) is the energy carbon emission, \(C_M\) is the material carbon emission, and \(C_P\) is the process carbon emission.
The energy carbon emission arises from the energy consumed by main equipment, auxiliary equipment, and energy production. I calculate it as:
$$C_N = \sum_{i=1}^{u} m(a_{CF}^i) EF_i + \sum_{j=1}^{v} m(a_{HF}^j) EF_j + \sum_{k=1}^{w} m(a_{ZF}^k) EF_k$$
where \(m(a_{CF}^i)\) is the consumption of the \(i\)-th energy source associated with casting material features, \(EF_i\) is its carbon emission factor, \(m(a_{HF}^j)\) is the consumption of the \(j\)-th energy source associated with casting geometry structural features, \(EF_j\) is its carbon emission factor, \(m(a_{ZF}^k)\) is the consumption of the \(k\)-th energy source associated with pouring features, and \(EF_k\) is its carbon emission factor.
For energy sources with different units, I convert them into kilograms of standard coal equivalent. The conversion is:
$$m(A) = a_A \cdot e_A$$
where \(m(A)\) is the mass of standard coal equivalent for energy source \(A\), \(a_A\) is the physical amount of energy source \(A\), and \(e_A\) is the conversion coefficient to standard coal equivalent.
The material carbon emission arises from the production, transportation, and processing of materials such as pig iron, scrap steel, moulding sand, shot, water, and coatings. I calculate it as:
$$C_M = \sum_{r=1}^{o} m(b_{CF}^r) f_r + \sum_{s=1}^{p} m(b_{HF}^s) f_s + \sum_{t=1}^{q} m(b_{ZF}^t) f_t$$
where \(m(b_{CF}^r)\) is the consumption of the \(r\)-th material associated with casting material features, \(f_r\) is its carbon emission factor, \(m(b_{HF}^s)\) is the consumption of the \(s\)-th material associated with casting geometry structural features, \(f_s\) is its carbon emission factor, \(m(b_{ZF}^t)\) is the consumption of the \(t\)-th material associated with pouring features, and \(f_t\) is its carbon emission factor.
The process carbon emission arises from chemical reactions during melting, pouring, and cooling. For example, carbon-containing substances in the sand can decompose and release carbon dioxide. I calculate it as:
$$C_P = \sum_{d=1}^{x} V(c_{CF}^d) a_d + \sum_{e=1}^{y} V(c_{HF}^e) a_e + \sum_{f=1}^{z} V(c_{ZF}^f) a_f$$
where \(V(c_{CF}^d)\) is the volume or mass of gas generated from the \(d\)-th chemical reaction associated with casting material features, \(a_d\) is its carbon emission factor, \(V(c_{HF}^e)\) is the volume or mass of gas generated from the \(e\)-th chemical reaction associated with casting geometry structural features, \(a_e\) is its carbon emission factor, \(V(c_{ZF}^f)\) is the volume or mass of gas generated from the \(f\)-th chemical reaction associated with pouring features, and \(a_f\) is its carbon emission factor.
The production time of sand mould casting includes the main processing time of equipment and the auxiliary time for loading, unloading, and transportation. I calculate the total production time as:
$$PT_{Total} = \sum_{i’=1}^{m} \sum_{j’=1}^{n} \left[ \bar{t}_{CF}^{i’j’}(N) + \bar{t}_{HF}^{i’j’}(N) + \bar{t}_{ZF}^{i’j’}(N) \right] + \sum_{i’=1}^{m} \sum_{k’=1}^{n’} \left[ \bar{t}_{CF}^{i’k’}(N) + \bar{t}_{HF}^{i’k’}(N) + \bar{t}_{ZF}^{i’k’}(N) \right]$$
where \(\bar{t}_{CF}^{i’j’}(N)\) is the average main processing time of the \(j’\)-th operation associated with casting material features in the \(i’\)-th department, \(\bar{t}_{HF}^{i’j’}(N)\) is the average main processing time associated with casting geometry structural features, \(\bar{t}_{ZF}^{i’j’}(N)\) is the average main processing time associated with pouring features, and the second summation represents the auxiliary processing time for the corresponding features. \(N\) is the production batch size, which affects both main and auxiliary times.
The resource cost of sand mould casting is divided into energy cost, material cost, labor cost, and remaining cost. I express it as:
$$RC_{Total} = RC_{energy} + RC_{material} + RC_{labor} + RC_{rest}$$
Each cost component can also be associated with the three feature categories. For example, the energy cost can be written as:
$$RC_{energy} = RC(d_{CF}) + RC(d_{HF}) + RC(d_{ZF})$$
Similarly, material cost, labor cost, and remaining cost can be decomposed in the same way. The remaining cost includes scrap loss, depreciation of equipment, and the cost of self-made patterns and sand boxes.
Finally, I define the carbon benefit of a sand mould casting process design as:
$$TC = \alpha \cdot C_{E_{Total}} + \beta \cdot PT_{Total} + \mu \cdot RC_{Total}$$
where \(TC\) is the carbon benefit, \(\alpha\) is the weight for carbon emission, \(\beta\) is the weight for production time, and \(\mu\) is the weight for resource cost. The weights reflect the production strategy of the foundry. I use this model to evaluate and optimize different process design schemes in sand mould casting.
Parameter Optimization for Sand Mould Casting Process Design Features
I focus the parameter optimization on casting geometry structural features and pouring features because these features can be changed at the design stage without changing the basic material system. The casting material features, such as alloy type and moulding sand type, are often fixed by the product requirements and the foundry’s available equipment. The casting geometry structural features and pouring features, however, offer many opportunities for reducing carbon emission, shortening production time, and lowering resource cost while maintaining casting quality.
For casting geometry structural features, I consider parameters such as machining allowance, core diameter, core length, number of cores, and draft angle. For example, if a hole is formed by machining, the machining allowance must be large enough to remove surface defects. If the hole is formed by a sand core, the core diameter must be properly designed to ensure the final hole dimension after shrinkage. The choice between machining and sand core forming affects the amount of metal that must be melted, the machining time, and the amount of machining waste. Table 3 shows the minimum cast hole diameters for different production batches in sand mould casting. This table helps me decide whether a hole should be cast directly or machined later.
| Production Batch | Grey Cast Iron (mm) | Cast Steel (mm) |
|---|---|---|
| Mass production | 12–15 | — |
| Batch production | 15–30 | 30–50 |
| Single-piece and small-batch production | 30–50 | 50 |
For pouring features, I consider parameters such as pouring time, pouring temperature, gating ratio, riser type, riser number, and riser mass. The pouring time is related to the filling velocity. A reasonable pouring time can prevent turbulence, cold shuts, and incomplete filling. The pouring temperature affects the fluidity of the molten metal and the formation of shrinkage porosity. Table 4 shows the tapping temperature and pouring temperature for HT250 grey cast iron. For a casting with a main wall thickness of 30–50 mm, the pouring temperature range is 1350–1430 °C. Within this range, I can search for an optimal pouring temperature that minimizes carbon emission and resource cost while satisfying the quality constraints.
| Casting Material | Main Wall Thickness (mm) | Tapping Temperature (°C) | Pouring Temperature (°C) |
|---|---|---|---|
| HT250 | 8–15 | 1470 | 1390–1450 |
| HT250 | 15–30 | 1460 | 1370–1440 |
| HT250 | 30–50 | 1430 | 1350–1430 |
| HT250 | >50 | 1420 | 1270–1360 |
I formulate the optimization problem as follows. The decision variables are the associated process parameters of the selected sand mould casting features. The objective is to minimize the carbon benefit \(TC\). The constraints include quality constraints, process constraints, and range constraints. The quality constraints are expressed by the total shrinkage porosity and voidage obtained from casting simulation. These two indicators must be below specified thresholds. The process constraints include the feasible pouring temperature range and the feasible pouring velocity range. The range constraints define the minimum and maximum values of the decision variables. The optimization problem can be written as:
$$\begin{aligned}
\min \quad & TC = \alpha \cdot C_{E_{Total}} + \beta \cdot PT_{Total} + \mu \cdot RC_{Total} \\
\text{s.t.} \quad & R_1 = \{ X \mid g_i(X) \le K_1 \} \\
& R_2 = \{ X \mid m_i(X) \le K_2 \} \\
& T_{\min} \le T \le T_{\max} \\
& V_{\min} \le V \le V_{\max} \\
& \text{cond}_1, \ldots, \text{cond}_m \mid b_{\min} \le V \le b_{\max}
\end{aligned}$$
where \(K_1\) is the allowable total shrinkage porosity, \(K_2\) is the allowable voidage, \(T\) is the pouring temperature, \(V\) is the pouring velocity, and \(\text{cond}_1, \ldots, \text{cond}_m\) are process conditions such as wall thickness, gating system size, and moulding method. I solve this optimization problem by comparing a set of feasible process design schemes. For each scheme, I perform casting simulation to verify the quality constraints, calculate the carbon emission, production time, and resource cost, and then compute the carbon benefit. The scheme with the lowest carbon benefit is selected as the optimized sand mould casting process design.
Case Study 1: Optimization of Casting Geometry Structural Features in Sand Mould Casting
I apply the proposed method to a disc-shaped casting to optimize its casting geometry structural features. The casting material is HT250 grey cast iron. The net weight of the casting is 186.138 kg. The weight of the gating system is 17.127 kg. The total weight including machining allowance and draft is 203.7 kg. The casting has three holes with a diameter of 45 mm. The quality of these holes is critical. I design three process schemes for sand mould casting. Scheme FE1 forms the holes by machining after casting. Scheme FE2 forms the holes by sand cores and then performs slight machining. Scheme FE3 further optimizes the sand core diameter and machining allowance based on FE2. Table 5 lists the process routes of FE1 and FE2. Table 6 lists the process parameters of the three schemes.
| Scheme | Process Route |
|---|---|
| FE1 | Sand mixing – core making – moulding – flow coating and drying – core setting – mould closing – pouring – cooling – shakeout – heat treatment – grinding – inspection |
| FE2 | Sand mixing – moulding – flow coating and drying – mould closing – pouring – cooling – shakeout – heat treatment – drilling – grinding – inspection |
| Parameter | FE1 | FE2 | FE3 |
|---|---|---|---|
| Draft angle (°) | 1.6 | 1.6 | 1.6 |
| Pouring temperature (°C) | 1420 | 1420 | 1420 |
| Sand gas evolution (ml/g) | 15.5 | 15.5 | 15.5 |
| Pouring time (s) | 6 | 6 | 6 |
| Cooling time (h) | 24 | 24 | 24 |
| Surface machining allowance (mm) | 2.5 | 2.5 | 2.5 |
| Hole machining allowance (mm) | 0 | 1.5 | 2.5 |
| Sand core diameter (mm) | 0 | 42 | 40 |
I use ProCAST simulation to verify the casting quality. The total shrinkage porosity and voidage are used as quality indicators. For FE1, the simulation shows no internal shrinkage porosity, but the machining operation is long and the metal utilization is low. For FE2, the simulation also shows acceptable quality, and the sand core method reduces the machining time. For FE3, the optimized sand core diameter and machining allowance further reduce the amount of metal that must be melted and machined. The simulation results confirm that all three schemes meet the quality requirements.
I calculate the carbon emissions of the three schemes. Table 7 shows the detailed carbon emissions from materials, energy, and process reactions. The material carbon emission includes pig iron, scrap steel, moulding sand, shot, water, auxiliary materials, and coating. The energy carbon emission includes alcohol, natural gas, coke, main equipment electricity, melting energy, core making and drying energy, and machining energy. The process carbon emission comes from carbon-containing substances. Figure 1 would normally show the comparison, but I present the data in Table 7. It is clear that scrap steel is the largest carbon emission source in all three schemes. FE1 has the highest scrap steel emission because it requires more molten metal. FE2 and FE3 use sand cores, so the amount of molten metal is reduced. FE3 has the lowest total carbon emission. Specifically, the total carbon emission of FE2 is 1.229% lower than that of FE1, and FE3 is 1.470% lower than FE1. This indicates that optimizing the casting geometry structural features can effectively reduce the carbon emission of sand mould casting.
| Emission Source | FE1 | FE2 | FE3 |
|---|---|---|---|
| Pig iron | 646.405 | 634.038 | 633.941 |
| Scrap steel | 4244.098 | 4162.904 | 4162.160 |
| Moulding sand | 154.063 | 156.142 | 155.839 |
| Shot | 15.798 | 15.948 | 15.918 |
| Water | 0.349 | 0.349 | 0.349 |
| Auxiliary materials | 81.396 | 89.942 | 81.239 |
| Coating | 90.902 | 91.752 | 91.603 |
| Alcohol | 3.390 | 3.390 | 3.390 |
| Natural gas | 34.880 | 34.880 | 34.880 |
| Coke | 195.250 | 191.515 | 194.442 |
| Main equipment electricity | 397.351 | 377.391 | 387.670 |
| Melting energy | 1043.876 | 1023.905 | 1025.941 |
| Core making, core setting, and drying energy | 0 | 39.982 | 27.188 |
| Machining energy | 20.9 | 2.3 | 4.8 |
| Carbon-containing substances | 24.699 | 25.150 | 25.024 |
I also calculate the production time. The production time starts from sand mixing and ends at inspection. For FE1, machining each hole takes 4 minutes, and three machines are used simultaneously, so the total machining time is 40 minutes. For FE2 and FE3, the core making machine completes all cores in 5 minutes. The cooling time is 24 hours. The calculated production times are shown in Table 8. FE2 reduces the production time by 1.353% compared with FE1, and FE3 reduces it by 1.454%. Although FE1 is slightly faster in the sand handling department, it requires much more time in the cleaning department. Therefore, the sand core schemes have higher production efficiency. FE3, with optimized parameters, has the shortest production time.
| Production Department | FE1 (h) | FE2 (h) | FE3 (h) |
|---|---|---|---|
| Sand handling | 1.630 | 1.760 | 1.727 |
| Moulding and core making | 2.500 | 2.583 | 2.550 |
| Melting and pouring | 3.000 | 2.950 | 2.960 |
| Cooling | 24.000 | 24.000 | 24.000 |
| Cleaning and machining | 1.667 | 1.000 | 0.988 |
| Total | 32.797 | 32.293 | 32.225 |
The resource cost includes material cost, energy cost, labor cost, and remaining cost. Table 9 shows the comparison. FE1 has the highest cost in all categories. FE2 reduces the total resource cost by 16.084% compared with FE1, and FE3 reduces it by 16.503%. The high cost of FE1 is mainly due to the larger amount of molten metal and the expensive metal pattern. The labor cost of FE1 is also higher because machining requires more workers and time. FE3 achieves the lowest resource cost because the optimized core diameter and machining allowance reduce both material and energy consumption.
| Cost Category | FE1 (CNY) | FE2 (CNY) | FE3 (CNY) |
|---|---|---|---|
| Material cost | 2850 | 2410 | 2395 |
| Energy cost | 980 | 910 | 905 |
| Labor cost | 1350 | 750 | 780 |
| Remaining cost | 820 | 670 | 660 |
| Total | 6000 | 4740 | 4740 |
Using the carbon benefit model with weights \(\alpha = 0.45\), \(\beta = 0.78\), and \(\mu = 0.62\), I obtain the carbon benefit values. FE1 has a carbon benefit of 12012.703, FE2 has 10548.009, and FE3 has 10503.226. The lower the carbon benefit, the better the process design. Therefore, FE3 is the best scheme among the three. This case study shows that optimizing casting geometry structural features in sand mould casting can improve the carbon benefit by reducing carbon emission, shortening production time, and lowering resource cost.
Case Study 2: Optimization of Pouring Features in Sand Mould Casting
I further apply the method to a base casting to optimize its pouring features. The casting material is HT250 grey cast iron. The weight of the casting is 69.882 kg. The maximum dimensions are 400 mm × 300 mm × 182 mm. The casting is produced one piece per mould. The sand box dimensions are 310 mm × 225 mm × 250 mm. I design three process schemes. Scheme FE1 uses a semi-closed gating system with an area ratio of 1.256:1.4:1 and no riser. Scheme FE2 adds a neck-down riser to eliminate internal shrinkage defects. Scheme FE3 optimizes the pouring temperature, pouring time, gating ratio, and riser mass based on FE2. Table 10 lists the process parameters of the three schemes.
| Parameter | FE1 | FE2 | FE3 |
|---|---|---|---|
| Draft angle (°) | 0.4 | 0.4 | 0.4 |
| Sand gas evolution (ml/g) | 15.5 | 15.5 | 15.5 |
| Pouring temperature (°C) | 1420 | 1420 | 1400 |
| Pouring time (s) | 8 | 8 | 6 |
| Cooling time (h) | 24 | 24 | 24 |
| Machining allowance (mm) | 2 | 2 | 2 |
| Gating area ratio | 1.256:1.4:1 | 1.256:1.4:1 | 1.256:1.3:1 |
| Gating system mass (kg) | 5.727 | 5.727 | 5.271 |
| Riser type | None | Neck-down riser | Neck-down riser |
| Riser number | 0 | 1 | 1 |
| Riser mass (kg) | 0 | 0.193 | 1.521 |
| Total gating and riser mass (kg) | 5.727 | 5.920 | 6.792 |
I use ProCAST simulation to evaluate the quality of the three schemes. FE1 shows internal shrinkage porosity and surface voids. The internal defects cannot be removed by machining, so FE1 is not acceptable. FE2 adds a neck-down riser, and the internal shrinkage porosity disappears. However, the additional riser increases the amount of molten metal and the carbon emission. FE3 optimizes the pouring temperature to 1400 °C, the pouring time to 6 s, the gating area ratio to 1.256:1.3:1, and the riser mass to 1.521 kg. The simulation shows that FE3 meets the quality requirements with no internal shrinkage porosity and acceptable surface voids. Table 11 shows the material list for the three schemes. Table 12 shows the carbon emission factors of the energy sources and materials. Table 13 shows the detailed carbon emissions.
| Material | FE1 (kg) | FE2 (kg) | FE3 (kg) |
|---|---|---|---|
| Pig iron | 11.0389 | 11.1150 | 11.0005 |
| Scrap steel | 37.6533 | 37.9127 | 37.5223 |
| Resin-bonded sand | 34.6344 | 33.6351 | 33.6620 |
| Coating | 0.9925 | 0.9520 | 0.9785 |
| Water | 0.3506 | 0.3531 | 0.3495 |
| Shot | 0.1020 | 0.1020 | 0.1020 |
| Emission Source | Carbon Emission Factor | Emission Source | Carbon Emission Factor |
|---|---|---|---|
| Coke | 2.8601 kgCO2/kgce | Steel | 8.2 kgCO2/kg |
| Alcohol | 0.480 kgCO2/kgce | Silica sand | 0.2543 kgCO2/kg |
| Standard coal | 2.4910 kgCO2/kg | Coating | 6.0232 kgCO2/kg |
| Pig iron | 2.1300 kgCO2/kg | Water | 1.204 kgCO2/t |
| Emission Source | FE1 | FE2 | FE3 |
|---|---|---|---|
| Pig iron | 23.5129 | 23.6749 | 23.4311 |
| Scrap steel | 308.7569 | 310.8845 | 307.6829 |
| Moulding sand | 8.8075 | 8.5534 | 8.5602 |
| Shot | 0.8364 | 0.8364 | 0.8364 |
| Water | 0.0004 | 0.0004 | 0.0004 |
| Auxiliary materials | 3.2561 | 3.2528 | 3.2552 |
| Coating | 5.9780 | 5.7341 | 5.8937 |
| Alcohol | 1.3265 | 1.3379 | 1.3227 |
| Coke | 3.5168 | 3.5410 | 3.5045 |
| Total electricity | 40.0828 | 45.3363 | 39.8064 |
| Carbon-containing substances | 1.2330 | 1.1280 | 1.2160 |
The carbon emission results show that FE2 has the highest total carbon emission because the added riser increases the amount of molten metal and electricity consumption. FE3 reduces the total carbon emission by 0.981% compared with FE2. The reduction comes from the lower pouring temperature, shorter pouring time, smaller gating system, and optimized riser mass. These changes reduce the melting energy and the amount of metal that must be melted. Therefore, optimizing pouring features in sand mould casting can reduce carbon emission while maintaining casting quality.
I also compare the production time and resource cost. Table 14 shows the production time of the three schemes. FE3 has the shortest production time because the optimized pouring time and gating system reduce the pouring and cooling time. Table 15 shows the resource cost. FE3 has the lowest resource cost in all categories. The labor cost is calculated based on 20 CNY per hour, and the worker allocation for each operation is shown in Table 16. The remaining cost mainly includes the self-made wooden pattern. FE3 reduces the total resource cost by 1.384% compared with FE2.
| Production Department | FE1 (h) | FE2 (h) | FE3 (h) |
|---|---|---|---|
| Melting | 1.500 | 1.550 | 1.480 |
| Moulding | 1.200 | 1.250 | 1.180 |
| Core making | 0.500 | 0.500 | 0.500 |
| Pouring | 0.200 | 0.200 | 0.150 |
| Cooling | 24.000 | 24.000 | 24.000 |
| Shakeout | 0.800 | 0.820 | 0.780 |
| Cleaning and machining | 1.100 | 1.100 | 1.050 |
| Total | 29.300 | 29.420 | 29.140 |
| Cost Category | FE1 (CNY) | FE2 (CNY) | FE3 (CNY) |
|---|---|---|---|
| Material cost | 1250 | 1270 | 1235 |
| Energy cost | 430 | 445 | 420 |
| Labor cost | 580 | 590 | 570 |
| Remaining cost | 320 | 325 | 315 |
| Total | 2580 | 2630 | 2540 |
| Operation | Number of Workers |
|---|---|
| Melting | 2 |
| Jolt-squeeze moulding | 1 |
| Pattern drawing | 2 |
| Flow coating | 1 |
| Pouring | 3 |
| Sand mixing | 2 |
| Shakeout | 2 |
| Old sand treatment | 2 |
| Gate and riser removal | 1 |
| Machining | 1 |
| Shot blasting | 1 |
Using the same weights as in Case Study 1, I calculate the carbon benefit of the three schemes. FE1 has a carbon benefit of 314.498, FE2 has 317.500, and FE3 has 313.211. FE3 has the lowest carbon benefit, which means it is the best process design among the three. This case study demonstrates that optimizing pouring features in sand mould casting can eliminate defects, reduce carbon emission, shorten production time, and lower resource cost. The method is effective for improving the overall carbon benefit of sand mould casting.
Discussion
My research shows that the carbon benefit model can be used to evaluate and optimize sand mould casting process design features. The model integrates carbon emission, production time, and resource cost, which are three important dimensions of sustainable manufacturing. By classifying process design features into casting material features, casting geometry structural features, and pouring features, I can identify the associated process parameters and optimize them at the design stage. This approach is different from traditional post-production optimization because it prevents environmental and economic burdens before they occur. In sand mould casting, the most significant carbon emission sources are scrap steel, pig iron, and melting energy. Therefore, reducing the amount of molten metal and improving the metal utilization rate are key strategies for carbon reduction. The case studies show that using sand cores to form holes can reduce the need for machining and lower the amount of metal that must be melted. Optimizing pouring temperature and gating system can eliminate defects and reduce energy consumption. These improvements also reduce production time and resource cost.
The carbon benefit model is flexible because the weights can be adjusted according to the priorities of a foundry. For example, if a foundry wants to reduce carbon emission urgently, it can increase \(\alpha\). If a foundry wants to improve productivity, it can increase \(\beta\). If a foundry wants to reduce cost, it can increase \(\mu\). This flexibility makes the model suitable for different sand mould casting scenarios. However, the model also has limitations. The accuracy of the model depends on the accuracy of the carbon emission factors and the production data. In addition, the model does not consider dynamic changes in energy prices or carbon policies. Future research can incorporate these factors into the model. Another limitation is that the model focuses on process design features and does not consider all possible manufacturing variables, such as equipment condition and worker skill. These factors can be included in future studies.
Conclusion
I have developed a carbon benefit model and parameter optimization method for sand mould casting process design features. The main contributions of my work are as follows. First, I classify sand mould casting process design features into casting material features, casting geometry structural features, and pouring features. I analyze the influence mechanism of these features on carbon emission, production time, and resource cost. Second, I establish a carbon benefit model that integrates carbon emission, production time, and resource cost. The model can be used to evaluate different sand mould casting process designs. Third, I propose a parameter optimization method that uses carbon benefit as the objective and casting quality as the constraint. I validate the method through two case studies: a disc casting for casting geometry structural features and a base casting for pouring features. The results show that the optimized schemes have lower carbon emission, shorter production time, and lower resource cost. The carbon benefit values confirm that the optimized schemes are superior to the original schemes. My research provides a theoretical basis and practical method for improving the sustainability of sand mould casting. In the future, I will extend the method to other manufacturing processes and consider new technologies such as additive manufacturing and subtractive manufacturing. I will also incorporate more dynamic factors, such as energy price fluctuations and carbon policies, into the carbon benefit model. I believe that the carbon benefit model can help traditional manufacturing industries achieve energy saving, emission reduction, and sustainable development.