
In my experience within the foundry industry, the production of critical automotive components demands meticulous attention to detail, especially when employing advanced techniques like the lost foam casting process. This process, known for its ability to create complex geometries with excellent dimensional accuracy, is widely used for manufacturing heavy-duty transmission housings. These housings are integral to vehicle powertrains, subjected to high input torques and complex operational conditions, necessitating superior mechanical properties. Specifically, the material specification often calls for gray iron HT200, with tensile strength σb ≥ 200 MPa, hardness between 170 and 241 HB, and a required metallographic structure dominated by type A graphite, supplemented by type C, with graphite lengths graded 4 to 7 and pearlite content ≥ 80%.
However, during the assembly of transmission units, I encountered a persistent issue: sinking phenomena at end-face bolt connections. Subsequent investigation revealed that the hardness at these locations measured between 138 and 152 HB, significantly below the specified range. This discrepancy posed a substantial quality risk, prompting a comprehensive analysis. The housings, produced via the lost foam casting process, featured variable wall thicknesses, with a maximum of 38 mm and a minimum of 8 mm. The deviation in hardness was traced to substandard metallographic structures, characterized by low pearlite content and excessively long graphite lengths, sometimes reaching grade 2. This essay details my first-person investigation into the root causes, the experimental methodologies employed, and the corrective actions implemented to eradicate this hardness deficiency in castings produced by the lost foam casting process.
The initial phase of my investigation focused on identifying potential culprits. In gray iron castings, hardness is intrinsically linked to tensile strength, both governed by the matrix microstructure, which itself is a function of chemical composition and solidification conditions. For components made via the lost foam casting process, the interplay of factors is critical. I theorized that the low hardness could stem from three primary aspects within the casting protocol: chemical composition, inoculation (modification) treatment, and cooling rate. Concurrently, the quality of raw materials, particularly pig iron, was considered a potential variable. The standard chemical composition for HT200 in our specifications is outlined in Table 1.
| Element | Minimum | Maximum |
|---|---|---|
| C | 3.2 | 3.6 |
| Si | 1.6 | 2.3 |
| Mn | 0.6 | 1.0 |
| P | – | ≤0.15 |
| S | – | ≤0.12 |
Spectroscopic analysis of the low-hardness castings confirmed that their chemical composition fell entirely within these specified limits, as visualized in a subsequent data plot. This effectively eliminated bulk chemistry as the direct cause. The relationship between hardness and carbon equivalent (CE) is often expressed as:
$$HB = k_1 – k_2 \cdot CE$$
where \( CE = C + \frac{1}{3}(Si + P) \), and \( k_1 \), \( k_2 \) are material constants. Since the measured CE was within the optimal range, the search extended to process execution.
The second suspect was inoculation efficacy. The lost foam casting process typically requires higher pouring temperatures to ensure complete foam pattern degradation and prevent defects. This elevated temperature can accelerate inoculation fade, leading to undercooled graphite formations and reduced pearlite. To test this, I designed a controlled experiment where a single heat of iron was poured into multiple molds sequentially. The chemical composition was held at 3.38% C, 1.85% Si, and 0.82% Mn. Inoculation was performed via stream inoculation in the pouring ladle. Hardness measurements from the first to the last casting poured are presented in Table 2.
| Pouring Sequence Number | Hardness HB (Location 1) | Hardness HB (Location 2) | Hardness HB (Location 3) |
|---|---|---|---|
| 1 | 189 | 189 | 189 |
| 2 | 186 | 191 | 188 |
| 3 | 190 | 188 | 186 |
| 4 | 183 | 186 | 182 |
| 5 | 187 | 184 | 186 |
| 6 | 188 | 185 | 187 |
| 7 | 187 | 188 | 190 |
| 8 | 182 | 185 | 190 |
| 9 | 186 | 186 | 186 |
| 10 | 180 | 186 | 183 |
The data showed no statistically significant downward trend in hardness with pouring order. All values remained above 180 HB, within specification. This indicated that under the current parameters, the lost foam casting process was not suffering from pronounced inoculation fade. The hardness can be related to undercooling (ΔT) and inoculation effectiveness via:
$$ \text{Pearlite Fraction} \approx f(\Delta T, I) $$
$$ \Delta T = T_{equilibrium} – T_{nucleation} $$
where \( I \) represents the inoculation potency. The stable results suggested \( I \) was adequately maintained.
The third process variable examined was cooling rate. In the lost foam casting process, the cooling rate is influenced by the sand medium, coating layer, and the configuration of the mold cluster. We operated two production lines with different shake-out times: 2.5 hours and 5.5 hours. Furthermore, molds were sometimes packed with 2 or 3 castings per cluster. A slower cooling rate generally promotes coarser graphite and ferrite formation, reducing hardness. To isolate this effect, I tracked castings from a single melt poured into both 2-piece and 3-piece clusters on the slower line. The results are summarized in Table 3.
| Cluster Configuration | Hardness HB (Sample 1) | Hardness HB (Sample 2) | Hardness HB (Sample 3) |
|---|---|---|---|
| 2-piece cluster | 186 | 187 | – |
| 3-piece cluster | 201 | 192 | 191 |
Contrary to expectations, the 3-piece cluster, which presumably cooled slower due to greater thermal mass, exhibited slightly higher hardness values. This paradox could be attributed to local differences in heat extraction or minor compositional microsegregation, but it clearly demonstrated that the normal variations in cooling speed inherent to our lost foam casting process were not the primary driver of the severe hardness drop to 150 HB levels.
Having largely exonerate d the core casting process parameters, my attention turned decisively to raw material quality. Our charge makeup consisted primarily of internal steel returns (alloy steel 8620H, which should enhance hardenability) and cast iron borings. The most variable element was the source of primary pig iron. We utilized pig iron from three distinct geographical sources: A, B, and C. To scientifically assess their impact, I conducted a series of melts where the only variable was the pig iron source. All other parameters of the lost foam casting process—melting practice, inoculation, pouring temperature (~1480°C), and molding—were held constant. The results were striking and are compiled in Table 4.
| Pig Iron Source | Average Hardness HB (Range) | Typical Chemical Composition (wt%) | Metallographic Notes |
|---|---|---|---|
| Source A | 180 ± 5 | ~3.4C, ~1.9Si, ~0.8Mn | Predominantly Type A graphite, Pearlite ≥85% |
| Source B | 185 ± 5 | ~3.35C, ~1.88Si, ~0.85Mn | Similar to A, slightly finer graphite |
| Source C | 160 ± 10 | ~3.3C, ~1.8Si, ~0.9Mn | Increased Type C/D graphite, Lower Pearlite (~70%) |
The data unequivocally showed that castings produced with Source C pig iron consistently exhibited lower hardness, hovering around 160 HB, despite having nominal化学成分 within specification. This pointed to subtle differences in the inherent microstructure of the pig iron, such as trace element content (e.g., Ti, Al, Cr, Sn) or graphite nucleation potential, which are not captured in routine C, Si, Mn analysis. The effect of trace elements (TE) on pearlite formation can be modeled as:
$$ \text{Pearlite Stability Factor} \propto \frac{1}{\sum (w_i \cdot \alpha_i)} $$
where \( w_i \) is the weight percentage of element i, and \( \alpha_i \) is its ferrite-stabilizing coefficient. Source C likely contained higher levels of graphitizing or ferrite-stabilizing trace elements.
To confirm this and explore a potential remedy through chemistry adjustment, I conducted a final experiment using only Source C pig iron. I intentionally biased the melt chemistry to the specification limits believed to favor hardness: minimum carbon and silicon, maximum manganese. The target was 3.2% C, 1.6% Si, 1.0% Mn. The resulting hardness data from ten castings is shown in Table 5.
| Sample Number | Hardness (HB) | Sample Number | Hardness (HB) |
|---|---|---|---|
| 1 | 176 | 6 | 182 |
| 2 | 180 | 7 | 179 |
| 3 | 168 | 8 | 178 |
| 4 | 176 | 9 | 190 |
| 5 | 172 | 10 | 192 |
While the average hardness improved slightly, the results were inconsistent, and several values (168, 172 HB) remained below the 170 HB minimum. This confirmed that simply manipulating the major elements within the standard window could not overcome the inherent limitations imposed by the Source C pig iron when used in the lost foam casting process. The lost foam casting process, with its unique thermal and pattern degradation characteristics, appears particularly sensitive to the nucleation state of the base iron.
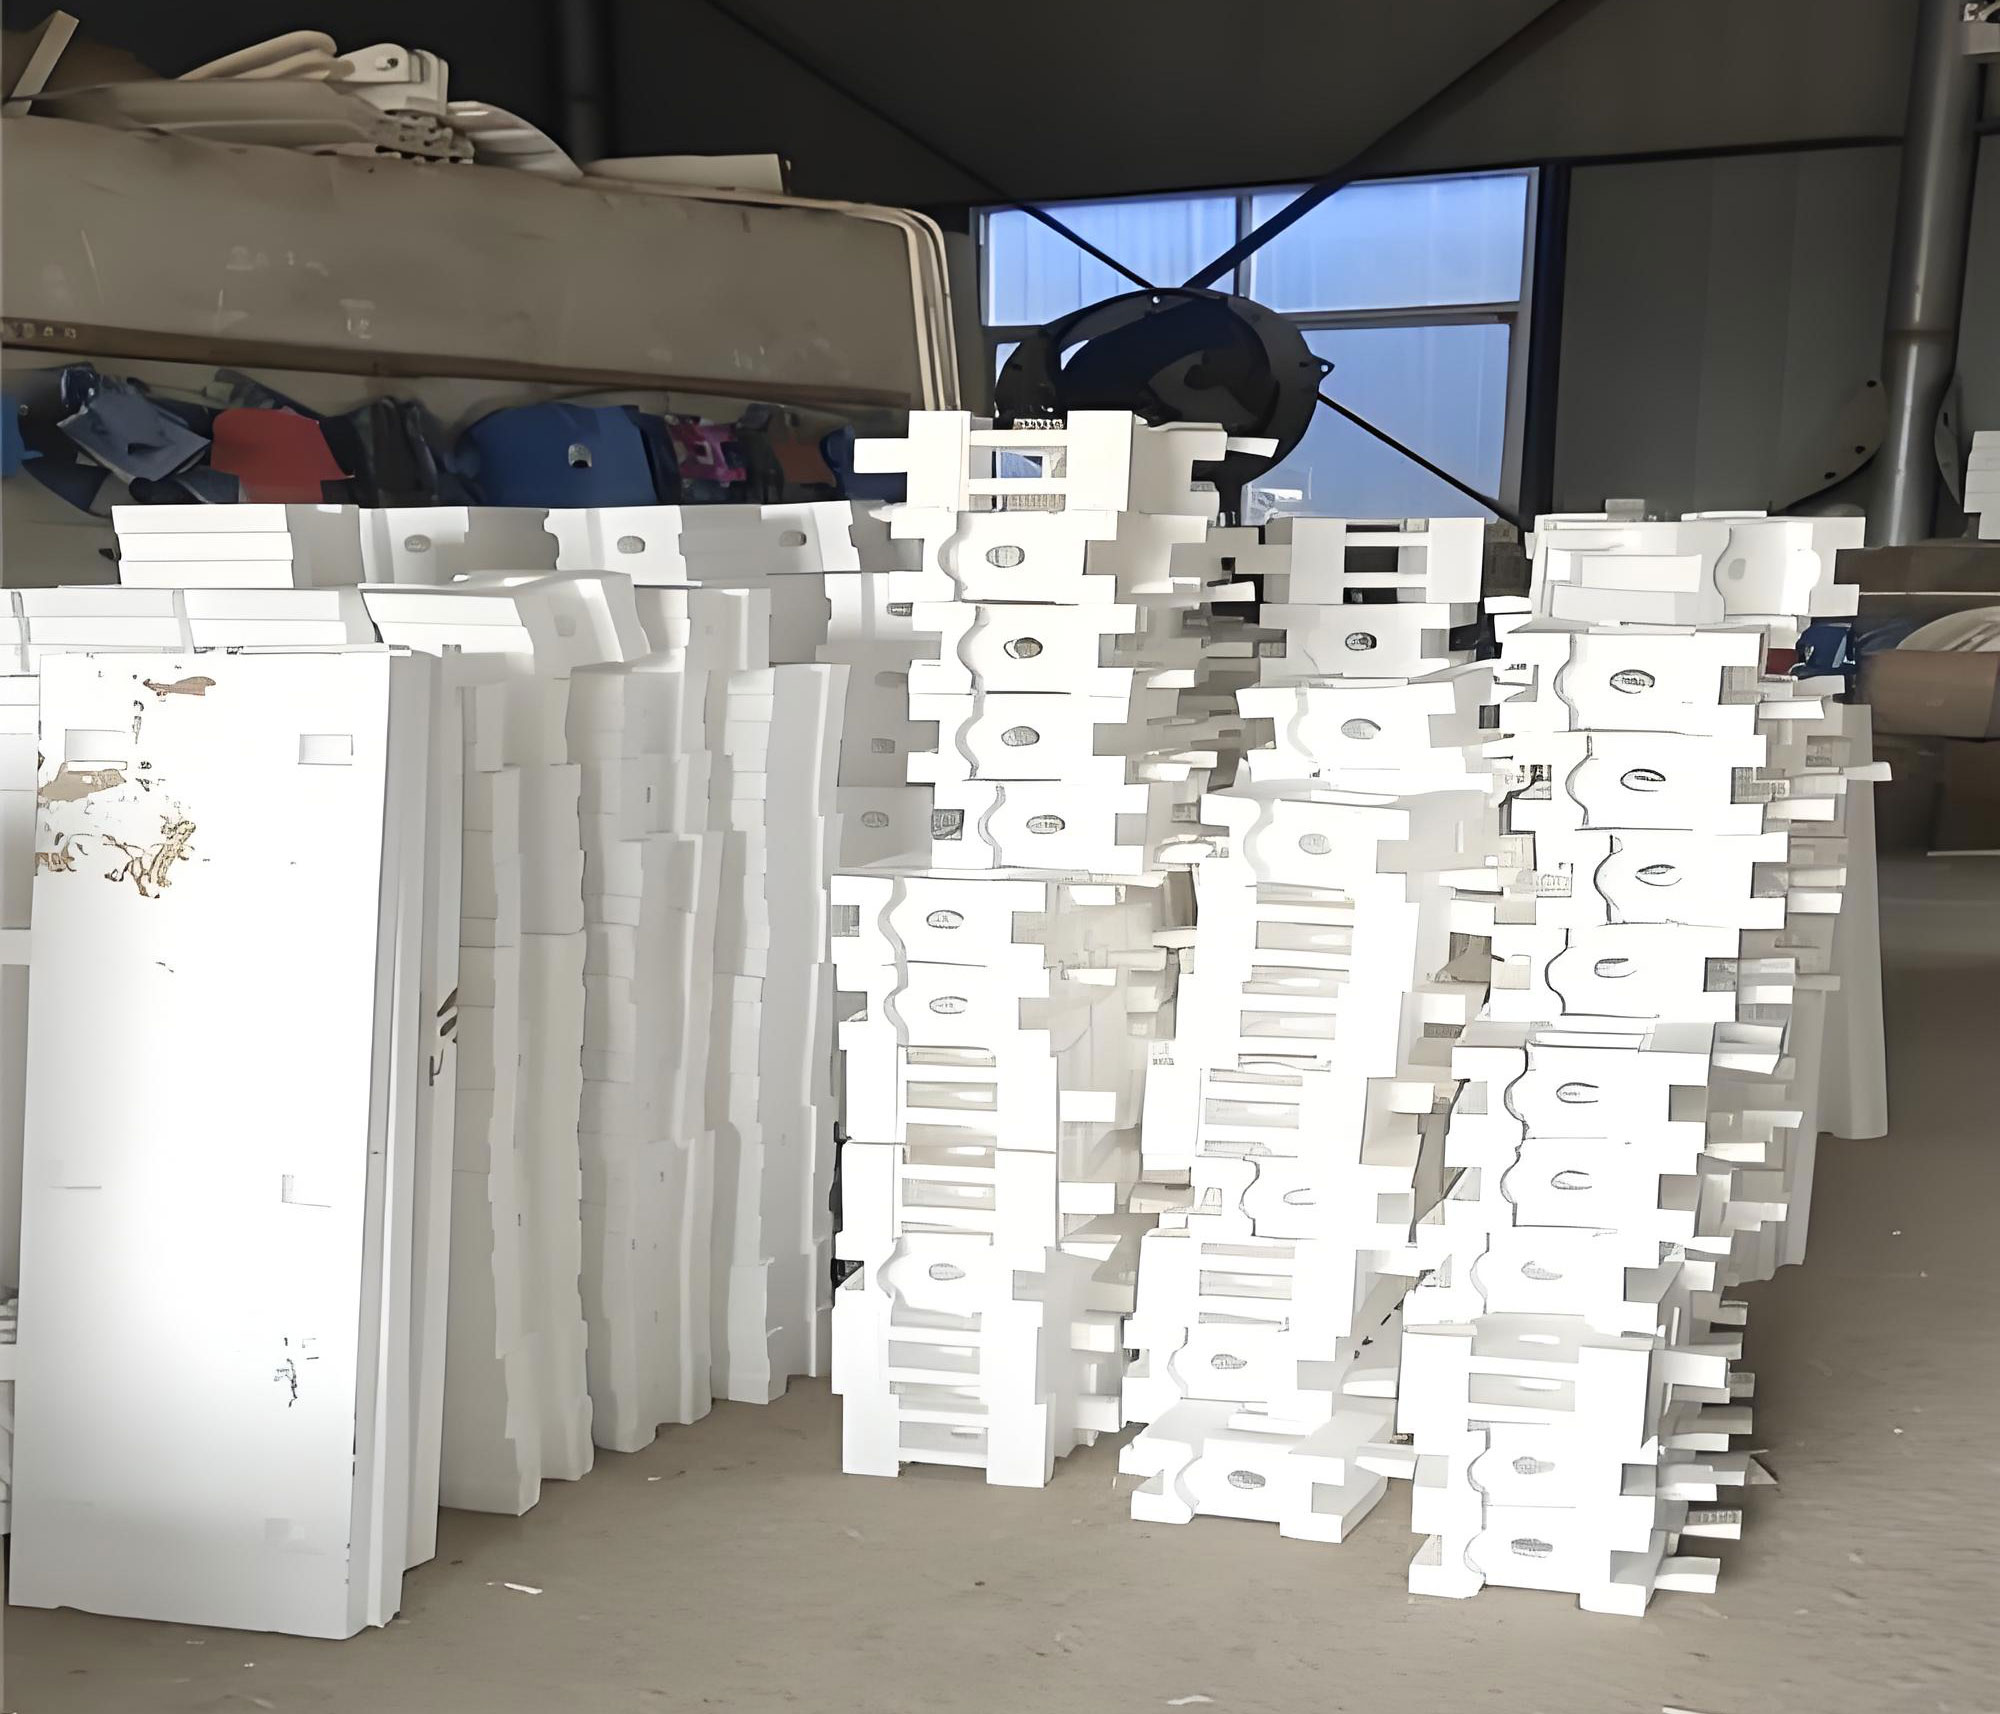
The image above illustrates a typical setup in the lost foam casting process, showcasing the foam patterns assembled into a cluster before being invested in sand. This visualization underscores the complexity of the process, where every element—from pattern density to sand compaction—can influence the final casting properties. However, as my investigation proved, the foundational quality of the metallic charge can be the overriding factor.
Based on these findings, I implemented a multi-pronged control strategy to permanently eliminate low hardness in our heavy-duty transmission housings produced by the lost foam casting process. The measures were as follows:
1. Immediate Raw Material Management: The existing inventory of Source C pig iron was quarantined. It was only permitted for use in blends with Source A or B pig iron, and only after recalculating the charge to deliberately lower the carbon equivalent and slightly elevate manganese content. The aim was to counterbalance its softening tendency. The target CE was adjusted using the formula:
$$ CE_{target} = C + \frac{Si}{4} + \frac{P}{2} \leq 4.0 $$
for these blended heats to promote a finer matrix.
2. Supplier Qualification and Sourcing: Source C was formally disqualified as a supplier for critical castings like transmission housings. A rigorous vendor qualification procedure was established for any new pig iron source. This included mandatory certification of trace element levels (Ti, Al, Cr, Sn, Pb, Bi) against agreed-upon limits.
3. Pre-production Batch Testing: A mandatory “first article” test became policy. Every new batch or source of pig iron must be used to produce a trial run of actual transmission housings via the standard lost foam casting process. These trial castings undergo full verification: chemical analysis, hardness testing (minimum 15 points per casting), and detailed metallographic examination for graphite type, length, and pearlite percentage. Only upon passing all criteria is the batch released for full-scale production.
4. Enhanced Process Control and Monitoring: While the primary cause was identified as raw material, process robustness was further tightened. This included:
– Strict enforcement of pouring temperature windows (1460-1500°C) to balance foam degradation and metal fluidity without exacerbating any inherent material issues.
– Calibration and verification of inoculation feeder equipment to ensure consistent and accurate addition rates. The inoculation amount (I) was modeled as:
$$ I = \frac{Q_{FeSi}}{W_{melt}} \times 100\% $$
with \( Q_{FeSi} \) being the weight of inoculant and \( W_{melt} \) the melt weight, maintaining it at 0.3-0.4 wt%.
– Real-time spectroscopic analysis of every heat before pouring, with clear hold-and-correct procedures for any chemistry deviating from the tightened internal norms.
– Regular auditing of sand properties and coating thickness in the lost foam casting process to ensure consistent and reproducible cooling conditions.
The effectiveness of these control measures was monitored over the subsequent production of several thousand transmission housings. Statistical process control (SPC) charts were maintained for hardness data. The results were definitive. The incidence of low-hardness castings fell to zero. The process capability index (Cpk) for hardness improved dramatically. The average hardness stabilized at approximately 185 HB with a significantly reduced standard deviation. Periodic destructive testing confirmed that the metallographic structure consistently met all requirements: graphite was primarily Type A, length between grades 4-6, and pearlite content consistently exceeded 85%. The corrective actions had successfully decoupled the final casting quality from the variable inherent in substandard pig iron, establishing a robust and reliable lost foam casting process for this critical component.
In conclusion, this investigation into the low hardness of heavy-duty transmission housings yielded several key insights. First, within the established framework of our lost foam casting process, the standard variables—chemical composition within spec, inoculation practice, and normal variations in cooling rate—were not the root cause of the severe hardness deficiency encountered. Second, the quality and source of铸造生铁 emerged as the dominant, previously underestimated factor. Identical nominal chemistry from different geographic sources produced vastly different hardness outcomes in the final casting, highlighting the critical role of trace elements and innate nucleation characteristics. Third, for the lost foam casting process, which involves complex pyrolytic reactions and specific solidification dynamics, the sensitivity to base iron quality is particularly acute. Finally, the solution lay not in radically altering the lost foam casting process itself, but in implementing a stringent, science-based raw material qualification and blending protocol, coupled with enhanced process consistency checks. This case underscores that in advanced casting techniques like lost foam, achieving consistent high quality requires a holistic control strategy that extends from the chemistry of the primary charge materials through every step of the intricate lost foam casting process.