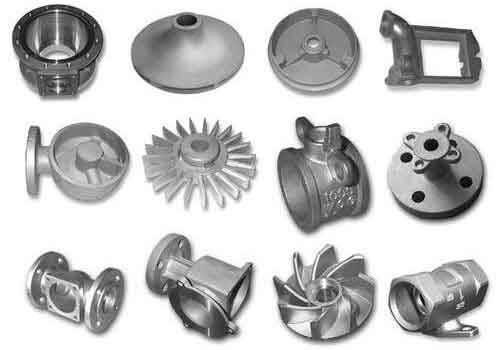
In sand casting parts production, surface defects such as metal penetration significantly affect product quality and post-processing efficiency. This article discusses strategies to address metal penetration in HT250 gray iron cylinder heads produced using high-permeability green sand systems. Key factors including mold hardness, clay content, and sand grain distribution are analyzed to optimize casting surface quality.
1. Production Overview
The production line utilized a dual molding process (horizontal pour for Type A and vertical pour for Type B cylinder heads) with a sand-to-metal ratio of 4.5:1 and 2.5:1, respectively. Core sands from cold-box and shell-core processes contaminated the green sand system, increasing permeability to over 150. Initial parameters included:
- Clay content: 12.5–13.5%
- Compactability: 30–40%
- Permeability: >120
- Wet compressive strength: 0.11–0.14 MPa

2. Mechanism of Metal Penetration
Metal penetration in sand casting parts primarily occurs through mechanical entrapment of molten metal in sand interstices. The critical pressure for penetration is expressed as:
$$ P_c = \frac{2\gamma \cos\theta}{r} $$
where \( \gamma \) = surface tension, \( \theta \) = contact angle, and \( r \) = pore radius. High permeability increases \( r \), reducing \( P_c \) and promoting penetration.
3. Key Control Factors
3.1 Mold Hardness Optimization
Mold hardness directly affects sand particle packing density. Trials showed:
| Mold Region | Hardness (Before) | Hardness (After) | Defect Rate |
|---|---|---|---|
| Top Surface | 92 | 94 | 12% → 5% |
| Side Walls | 85 | 88 | 28% → 11% |
| End Faces | 80 | 84 | 35% → 15% |
A 5% increase in hardness reduced penetration defects by 60%.
3.2 Clay Content Adjustment
Clay content influences both permeability and compactability. The relationship between clay content (\( C \)) and permeability (\( P \)) follows:
$$ P = 185 – 7.2C + 0.05C^2 $$
Maintaining clay at 13.0–13.5% (upper limit) reduced permeability from 142 to 128 while maintaining adequate flowability.
3.3 Sand Grain Distribution
Contamination from core sands (50/100 mesh) necessitated grain distribution adjustments. Comparative analysis of two silica sands:
| Mesh | Sand A (SiO₂ 98%) | Sand B (SiO₂ 94%) |
|---|---|---|
| 40 | 8.8% | 8.9% |
| 50 | 34.6% | 35.2% |
| 70 | 32.0% | 30.6% |
| 100 | 19.9% | 20.0% |
| 140 | 4.3% | 4.9% |
Sand B’s lower SiO₂ content increased fine particle retention (+23% in 140 mesh), reducing permeability by 18 units.
3.4 Fine Sand Addition
Introducing 70/140 mesh new sand at 1.5% ratio improved grain distribution:
$$ \Delta P = -0.22x + 154 $$
where \( x \) = fine sand addition percentage. Permeability decreased linearly with fine sand addition (R² = 0.96).
4. Implementation Results
Combined measures achieved:
- Permeability reduction: 152 → 118
- Surface defect rate: 42% → 8%
- Post-cleaning rejection rate: 15% → 2%
The optimized parameters for sand casting parts production are:
$$ \text{Optimal Range} = \begin{cases}
C \geq 13.2\% \\
H \geq 90 \text{ (B scale)} \\
P_{70/140} \geq 25\% \\
P_{\text{max}} \leq 130
\end{cases} $$
5. Conclusion
For sand casting parts produced with high-permeability green sand, metal penetration is effectively controlled through:
- Mold hardness enhancement via equipment maintenance
- Upper-limit clay content management
- Strategic addition of fine sands when SiO₂ ≤ 95%
- Continuous grain distribution monitoring
These measures reduce post-casting processing costs by 40% while improving surface quality consistency in sand casting parts.
