
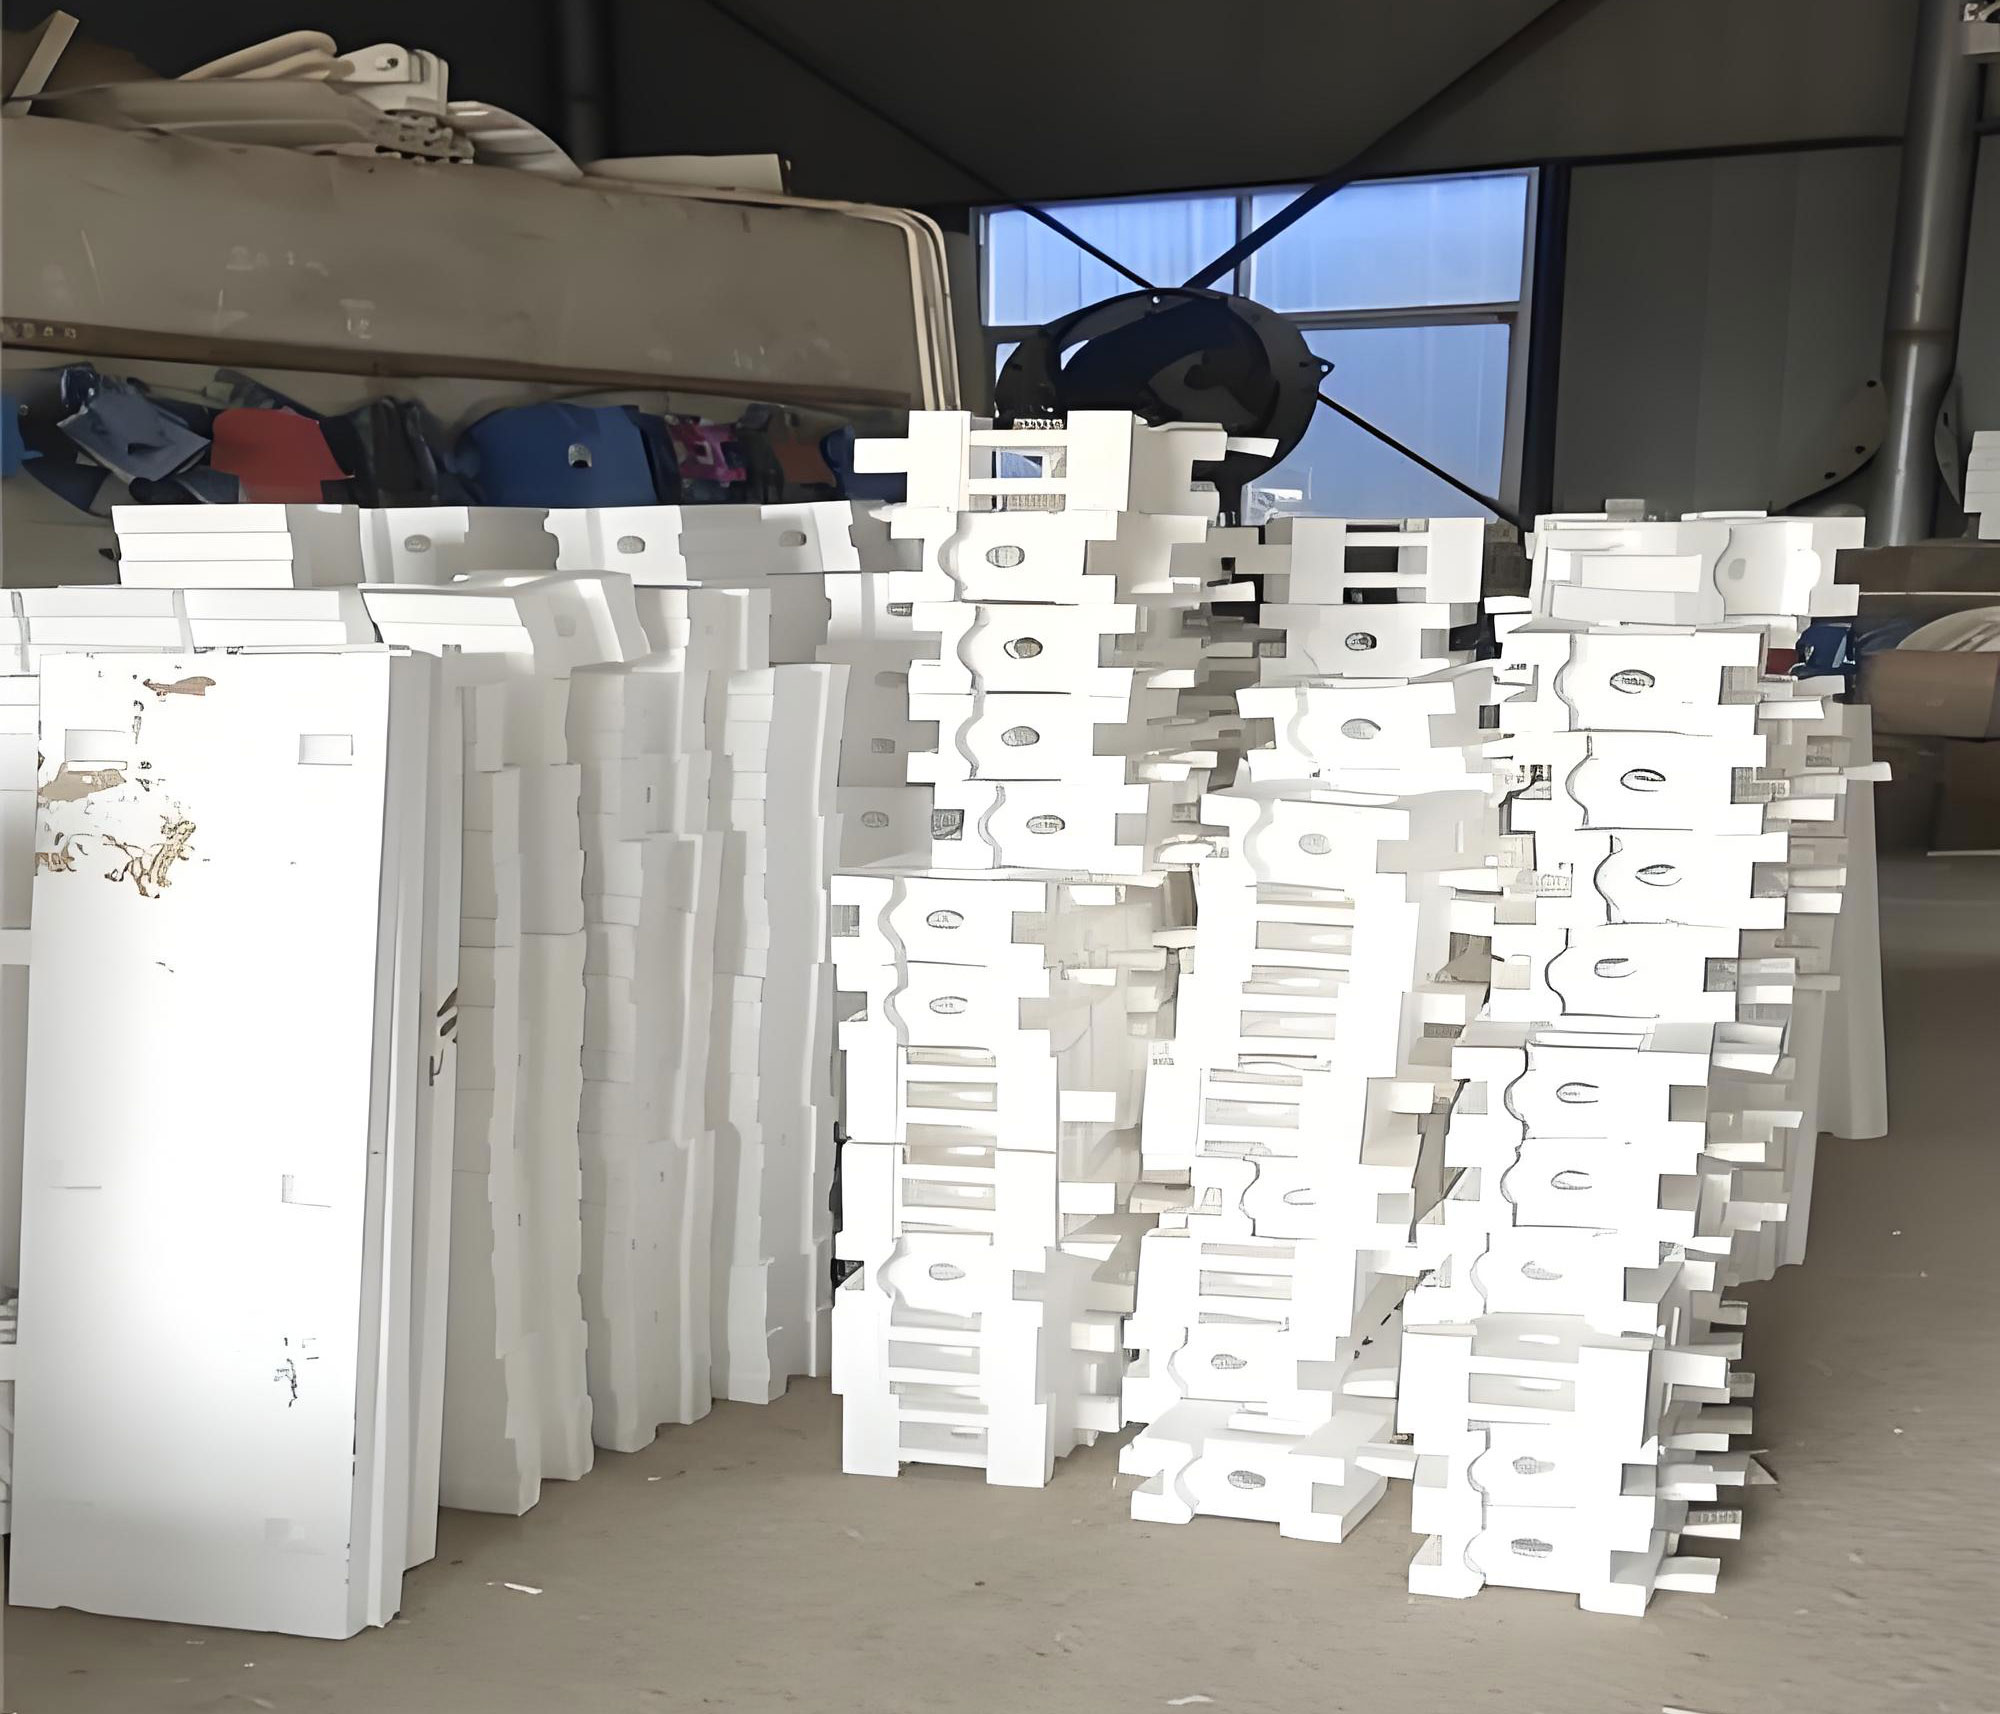
In my research, I focused on the preparation and performance optimization of refractory coatings specifically designed for the lost foam casting of iron castings. The lost foam casting process, also known as full mold casting, offers excellent dimensional accuracy, clean surfaces, and environmental advantages. However, the quality of the final casting strongly depends on the coating applied to the foam pattern. The coating must provide adequate strength, permeability, refractoriness, and resistance to moisture absorption. In this work, I developed two coating formulations with superior comprehensive properties, systematically investigated the effects of refractory aggregates, suspending agents, and binders, and optimized the formulations through single-factor experiments and orthogonal testing.
1 Introduction
The lost foam casting process is a near-net-shape manufacturing technology where a foam pattern is coated with a refractory layer, embedded in dry sand, and then filled with molten metal. The foam pattern vaporizes upon contact with the hot metal, leaving the cavity to be filled. This process provides several advantages over conventional sand casting, including higher dimensional precision, lower environmental impact, and the ability to produce complex geometries. However, the success of the process is highly dependent on the properties of the coating applied to the foam pattern. In particular, for iron castings, the coating must prevent sand sticking, facilitate the removal of decomposition products, and maintain structural integrity under thermal shock.
The key challenges in lost foam casting coatings include balancing permeability with strength, ensuring proper suspension stability, and minimizing moisture absorption. For iron castings, the coating must also withstand the relatively high pouring temperatures and the aggressive decomposition products of the polystyrene foam. Therefore, the development of a coating with optimized comprehensive performance is essential for improving casting quality and yield.
In my study, I aimed to develop two practical coating formulations for iron castings. I first selected suitable raw materials based on literature and preliminary tests. Then, I systematically changed the proportions of refractory aggregates, suspending agents, and binders to evaluate their influence on coating performance. Finally, using orthogonal experiments, I identified the optimal formulation and analyzed the microstructure of the best coating.
2 Experimental Materials and Methods
2.1 Raw Materials
The coating consists of refractory aggregates, suspending agents, binders, a carrier liquid, and additives. For iron castings, I chose quartz powder and bauxite as the refractory aggregates. Quartz powder is abundant, cheap, and has a low density, while bauxite provides high refractoriness and contributes to good permeability. Talcum powder was selected as a refractory filler to improve the leveling and sintering behavior. As suspending agents, I used sodium bentonite, xanthan gum, magnesium aluminum silicate, and sepiolite. Polyvinyl alcohol (PVA) and silica sol were used as low-temperature and high-temperature binders, respectively. Water was the carrier, with small amounts of surfactant OP-10, defoamer n-butanol, and preservative sodium benzoate.
2.2 Coating Preparation
The preparation process involved several steps. First, the refractory aggregates were dried at 50°C for 4 hours to remove moisture. Sodium bentonite was activated by mixing with water in a 1:10 ratio and allowing it to swell for 12 hours. Magnesium aluminum silicate was pre-gelled at 5–8% concentration in water for 12 hours. Xanthan gum was dissolved in water at a 1:40 ratio. PVA was dissolved in hot water to form a 5% solution, which was then blended with silica sol at a 1:1 volume ratio under stirring. The coating was prepared using a mechanical stirrer: the suspending agents were first dispersed in water, followed by the refractory powders, and finally the mixed binders. After mixing, the coating was aged for 24 hours to stabilize its rheological properties.
2.3 Performance Testing
I evaluated the following properties of the coatings: suspension, flow cup viscosity, permeability, rheology, coating strength, crack resistance, and moisture absorption. The suspension was measured using a 100 mL graduated cylinder, recording the ratio of sediment volume after 24 hours. Viscosity was determined with a LND-1 #4 viscosity cup. Permeability was measured using a STZ direct-reading permeability tester with a specially prepared sample tube. Rheological and thixotropic properties were measured using a NDJ-8S rotational viscometer. Coating strength was measured by a surface strength tester. Crack resistance was assessed visually based on a grading scale. Moisture absorption was determined by weighing a dried coating sample before and after exposure to 95% relative humidity at 15°C for 48 hours.
3 Results and Discussion
3.1 Effect of Refractory Aggregate Ratio
I first prepared three coatings with different quartz-to-bauxite ratios (30/70, 50/50, 70/30) while keeping other components constant. The results are summarized in Table 1.
| Ratio (Quartz/Bauxite) | Suspension (%) | Permeability | Coating ability | Flow cup viscosity (s) | Coating strength (g) | Yield value (Pa) | Thixotropic index | Moisture absorption (%) |
|---|---|---|---|---|---|---|---|---|
| 30/70 | 88 | 12.8 | I | 11.97 | 111.6 | 3.476 | 1.431 | 2.78 |
| 50/50 | 90 | 12.0 | II | 10.12 | 123.2 | 1.344 | 1.316 | 3.23 |
| 70/30 | 93 | 11.2 | II | 11.15 | 129.6 | 1.195 | 1.352 | 3.66 |
With a lower bauxite content, the suspension increased due to the lower density of quartz, but the permeability, coating strength, and thixotropy decreased. The 30/70 ratio gave the best balance, with excellent coating ability (grade I), highest yield value, and lowest moisture absorption. Therefore, I selected quartz powder 30% and bauxite 70% as the optimal refractory aggregate combination.
3.2 Effect of Talcum Powder Addition
Using the fixed aggregate ratio, I added talcum powder at levels of 0%, 2.5%, 5%, 7.5%, and 10% of the aggregate weight. The results are presented in Table 2.
| Talcum (%) | Suspension (%) | Permeability | Coating ability | Flow cup viscosity (s) | Coating strength (g) | Moisture absorption (%) |
|---|---|---|---|---|---|---|
| 0 | 88 | 12.8 | I | 11.97 | 144.2 | 2.78 |
| 2.5 | 90.3 | 13.2 | I | 11.15 | 138.0 | 2.83 |
| 5 | 91.4 | 13.4 | I | 10.61 | 133.5 | 2.96 |
| 7.5 | 91.8 | 13.6 | I | 10.17 | 131.2 | 3.11 |
| 10 | 92.1 | 13.8 | II | 9.71 | 129.6 | 3.35 |
Talcum powder improved suspension and permeability, but reduced coating ability and viscosity, and increased moisture absorption. At 7.5%, the coating provided the best compromise. Hence, I chose 7.5% talcum powder as the optimum filler loading.
3.3 Single-Factor Experiments on Suspending Agents
3.3.1 Sodium Bentonite
Sodium bentonite was tested at 1%, 2%, 3%, 4%, and 5% (by weight of refractory aggregate), with fixed PVA (2%) and silica sol (3%). The results are shown in Table 3.
| Content (%) | Suspension (%) | Permeability | Coating ability | Flow cup viscosity (s) | Crack resistance | Moisture absorption (%) |
|---|---|---|---|---|---|---|
| 1 | 89 | 13.2 | I | 10.01 | II | 3.05 |
| 2 | 92 | 13.8 | I | 10.23 | I | 3.26 |
| 3 | 93 | 14.3 | I | 11.78 | I | 3.37 |
| 4 | 91 | 14.6 | II | 13.84 | II | 3.45 |
| 5 | 88 | 14.7 | II | 14.23 | III | 3.52 |
The suspension first increased then decreased, with a maximum at 3%. Permeability increased steadily, but coating ability and crack resistance deteriorated when bentonite exceeded 3%. Moisture absorption rose with increasing bentonite. Therefore, the optimum bentonite content was 3%.
3.3.2 Xanthan Gum
Xanthan gum was tested at 0.1%, 0.3%, 0.5%, and 0.7% (with PVA 2%, silica sol 3%). The results are in Table 4.
| Content (%) | Suspension (%) | Permeability | Coating ability | Flow cup viscosity (s) | Crack resistance | Moisture absorption (%) |
|---|---|---|---|---|---|---|
| 0.1 | 93 | 14.7 | II | 10.13 | II | 3.25 |
| 0.3 | 93 | 14.3 | I | 11.78 | I | 3.37 |
| 0.5 | 92 | 13.2 | I | 13.55 | I | 3.47 |
| 0.7 | 90 | 11.6 | I | 15.84 | II | 3.53 |
Xanthan gum greatly increased viscosity and improved coating ability. However, high levels severely reduced permeability. The optimum range was 0.2–0.3%, and I used 0.3% in this study.
3.3.3 Magnesium Aluminum Silicate
I also tested magnesium aluminum silicate (a novel suspending agent) at 0.5%, 1%, 2%, and 3%. The results are listed in Table 5.
| Content (%) | Suspension (%) | Flow cup viscosity (s) | Yield value (Pa) | Thixotropic index |
|---|---|---|---|---|
| 0.5 | 83 | 9.95 | 1.772 | 2.550 |
| 1 | 88 | 10.21 | 1.873 | 2.572 |
| 2 | 94 | 12.46 | 2.485 | 2.580 |
| 3 | 98 | 14.74 | 3.370 | 2.600 |
As the content increased, suspension, viscosity, yield value, and thixotropy all improved significantly. The rheological curves showed that these coatings were yield-pseudoplastic fluids, with viscosity decreasing with increasing shear rate. The optimum range was 2–3%.
3.3.4 Sepiolite
I investigated sepiolite at 5%, 10%, and 15% (with 0.3% xanthan gum, 2% PVA, 3% silica sol). The results are shown in Table 6.
| Content (%) | Suspension (%) | Flow cup viscosity (s) | Permeability | Coating strength (g) |
|---|---|---|---|---|
| 5 | 87 | 11.35 | 13.7 | 1.35 |
| 10 | 93 | 13.31 | 15.1 | 1.29 |
| 15 | 97 | 16.04 | 10.3 | 1.26 |
At 10% sepiolite, the best balance of suspension, viscosity, permeability, and strength was achieved. Sepiolite formed a fibrous network that improved suspension and moisture resistance. Therefore, the optimum sepiolite content was about 10%.
3.4 Single-Factor Experiments on Binders
3.4.1 PVA
PVA was tested at 0.5%, 1%, 1.5%, 2%, and 2.5% with fixed 10% sepiolite and 3% silica sol. The results are in Table 7.
| Content (%) | Suspension (%) | Permeability | Coating ability | Flow cup viscosity (s) | Crack resistance | Coating mass (g) | Moisture absorption (%) |
|---|---|---|---|---|---|---|---|
| 0.5 | 87 | 15.9 | III | 11.07 | III | 1.30 | 3.52 |
| 1.0 | 90 | 15.6 | III | 11.43 | II | 1.28 | 3.43 |
| 1.5 | 92 | 15.3 | II | 11.97 | I | 1.26 | 3.35 |
| 2.0 | 93 | 14.9 | I | 13.27 | I | 1.29 | 3.28 |
| 2.5 | 92 | 14.6 | II | 15.98 | III | 1.31 | 3.24 |
PVA improved suspension and coating ability up to 2%, but reduced permeability. The optimum PVA content was around 1.5–2%. Considering viscosity and crack resistance, I selected 1.5% as a preliminary optimum.
3.4.2 Silica Sol
Silica sol was tested at 2%, 3%, 4%, 5%, and 6% with fixed 10% sepiolite and 2% PVA. The results are in Table 8.
| Content (%) | Suspension (%) | Permeability | Coating ability | Flow cup viscosity (s) | Crack resistance | High-temp mass (g) | Moisture absorption (%) |
|---|---|---|---|---|---|---|---|
| 2 | 91 | 15.9 | III | 14.44 | III | 1.34 | 3.43 |
| 3 | 93 | 15.1 | II | 13.31 | II | 1.29 | 3.26 |
| 4 | 95 | 14.5 | I | 12.42 | II | 1.27 | 3.06 |
| 5 | 96 | 14.0 | II | 13.15 | I | 1.23 | 2.88 |
| 6 | 97 | 13.5 | III | 14.66 | I | 1.19 | 2.75 |
Silica sol remarkably improved high-temperature strength and moisture resistance, but reduced permeability. The optimum silica sol content was 4%, giving the best coating ability and an acceptable balance.
4 Orthogonal Experiments and Optimization
Based on the single-factor results, I designed two orthogonal experiments using an L9(3^4) array to optimize the formulations. The factors and levels are shown in Table 9.
| Experiment | Factor A | Factor B | Factor C | Factor D |
|---|---|---|---|---|
| I | Na-bentonite (%) | Xanthan gum (%) | PVA (%) | Silica sol (%) |
| Level 1 | 2 | 0.2 | 1 | 3 |
| Level 2 | 3 | 0.3 | 1.5 | 4 |
| Level 3 | 4 | 0.4 | 2 | 5 |
| II | Mg-Al silicate (%) | Xanthan gum (%) | PVA (%) | Silica sol (%) |
| Level 1 | 2 | 0.2 | 1 | 3 |
| Level 2 | 2.5 | 0.3 | 1.5 | 4 |
| Level 3 | 3 | 0.4 | 2 | 5 |
4.1 Orthogonal Experiment I
The design matrix and results are presented in Table 10.
| No. | A | B | C | D | Suspension (%) | Permeability | Flow cup viscosity (s) | Moisture absorption (%) |
|---|---|---|---|---|---|---|---|---|
| 1 | 1 | 1 | 1 | 1 | 86 | 15.2 | 11.15 | 3.37 |
| 2 | 1 | 2 | 2 | 2 | 90 | 13.3 | 11.43 | 3.23 |
| 3 | 1 | 3 | 3 | 3 | 93 | 11.0 | 11.84 | 2.95 |
| 4 | 2 | 1 | 2 | 3 | 92 | 12.9 | 12.18 | 2.67 |
| 5 | 2 | 2 | 3 | 1 | 97 | 14.8 | 12.79 | 3.44 |
| 6 | 2 | 3 | 1 | 2 | 88 | 13.0 | 11.76 | 3.29 |
| 7 | 3 | 1 | 3 | 2 | 95 | 13.7 | 13.25 | 3.18 |
| 8 | 3 | 2 | 1 | 3 | 87 | 12.2 | 12.33 | 2.84 |
| 9 | 3 | 3 | 2 | 1 | 88 | 14.3 | 12.87 | 3.51 |
I performed range analysis for each response. Table 11 lists the range R values.
| Response | R_A | R_B | R_C | R_D |
|---|---|---|---|---|
| Suspension | 8 | 5 | 24 | 2 |
| Permeability | 1.2 | 3.5 | 1.0 | 8.2 |
| Flow cup viscosity | 4.03 | 0.11 | 2.64 | 0.46 |
| Moisture absorption | 0.15 | 0.53 | 0.16 | 1.86 |
For suspension, the optimal combination was A2B2C3D2; for permeability, A2B1C2D1; for viscosity, A3B1C3D1; for moisture absorption, A2B1C2D3. To determine the overall best, I tested the four candidate combinations. The comparative results are given in Table 12.
| No. | Combination | Suspension (%) | Permeability | Flow cup viscosity (s) | Moisture absorption (%) |
|---|---|---|---|---|---|
| 1 | A2B2C3D2 | 97 | 14.5 | 12.72 | 3.39 |
| 2 | A2B1C2D1 | 91 | 13.6 | 12.23 | 2.84 |
| 3 | A3B1C3D1 | 95 | 14.2 | 13.27 | 3.23 |
| 4 | A2B1C2D3 | 92 | 12.9 | 12.18 | 2.67 |
Combination 3 (A3B1C3D1) offered the best overall performance with high suspension (95%), good permeability (14.2), acceptable viscosity (13.27 s), and moderate moisture absorption (3.23%). Therefore, the optimal formula I (with sodium bentonite) was: quartz powder 30%, bauxite 70%, talcum powder 7.5%, sodium bentonite 4%, xanthan gum 0.2%, PVA 2%, silica sol 3%, and suitable water and additives.
4.2 Orthogonal Experiment II
The second orthogonal experiment used magnesium aluminum silicate instead of sodium bentonite. The design and results are shown in Table 13.
| No. | A | B | C | D | Suspension (%) | Permeability | Flow cup viscosity (s) | Moisture absorption (%) |
|---|---|---|---|---|---|---|---|---|
| 1 | 1 | 1 | 1 | 1 | 88 | 15.6 | 12.38 | 3.24 |
| 2 | 1 | 2 | 2 | 2 | 89 | 14.4 | 12.54 | 2.94 |
| 3 | 1 | 3 | 3 | 3 | 90 | 12.7 | 12.71 | 2.48 |
| 4 | 2 | 1 | 2 | 3 | 92 | 12.4 | 12.91 | 2.63 |
| 5 | 2 | 2 | 3 | 1 | 93 | 15.3 | 13.03 | 3.35 |
| 6 | 2 | 3 | 1 | 2 | 91 | 13.8 | 12.83 | 3.02 |
| 7 | 3 | 1 | 3 | 2 | 97 | 13.4 | 13.33 | 3.11 |
| 8 | 3 | 2 | 1 | 3 | 94 | 12.0 | 13.15 | 2.77 |
| 9 | 3 | 3 | 2 | 1 | 95 | 14.8 | 13.25 | 3.42 |
The range analysis results are shown in Table 14.
| Response | R_A | R_B | R_C | R_D |
|---|---|---|---|---|
| Suspension | 19 | 1 | 8 | 1 |
| Permeability | 2.5 | 0.4 | 0.2 | 8.6 |
| Flow cup viscosity | 2.1 | 0.17 | 0.71 | 0.11 |
| Moisture absorption | 0.64 | 0.14 | 0.09 | 2.13 |
The best combinations for each response were: A3B1C3D2 for suspension, A1B2C2D1 for permeability, A3B3C3D3 for viscosity, and A1B3C3D3 for moisture absorption. The comprehensive comparison is shown in Table 15.
| No. | Combination | Suspension (%) | Permeability | Flow cup viscosity (s) | Moisture absorption (%) |
|---|---|---|---|---|---|
| 1 | A3B1C3D2 | 97 | 13.4 | 13.33 | 3.11 |
| 2 | A1B2C2D1 | 89 | 15.2 | 12.63 | 3.17 |
| 3 | A3B3C3D3 | 96 | 13.1 | 13.35 | 2.73 |
| 4 | A1B3C3D3 | 90 | 12.7 | 12.71 | 2.48 |
Combination 1 (A3B1C3D2) exhibited the highest suspension (97%), good permeability (13.4), suitable viscosity (13.33 s), and acceptable moisture absorption (3.11%). Thus, the optimal formula II (with magnesium aluminum silicate) was: quartz powder 30%, bauxite 70%, talcum powder 7.5%, magnesium aluminum silicate 3%, xanthan gum 0.2%, PVA 2%, silica sol 4%, and appropriate water and additives.
4.3 Microstructure of the Optimal Coatings
I examined the microstructure of the optimized coatings using scanning electron microscopy (SEM). The micrographs revealed that the refractory particles were uniformly dispersed and tightly packed. Some interconnected micro-voids were present, which facilitated the escape of gaseous decomposition products during casting, thereby enhancing permeability. The coatings had a smooth, homogeneous surface with no agglomeration, confirming the effectiveness of the formulation and processing route.
5 Conclusions
In this study, I successfully developed two high-performance coatings for lost foam casting of iron castings. The following conclusions can be drawn:
(1) The optimal refractory aggregate composition was 30% quartz powder and 70% bauxite. Adding 7.5% talcum powder as a filler gave the best balance of suspension, permeability, coating strength, and moisture resistance.
(2) Single-factor experiments showed that the optimum contents were approximately 3% for sodium bentonite, 0.3% for xanthan gum, 2–3% for magnesium aluminum silicate, 1.5% for PVA, and 4% for silica sol. Sepiolite at about 10% significantly improved suspension, permeability, and also contributed to reduced moisture absorption, offering a promising solution to the moisture sensitivity of lost foam coatings.
(3) Orthogonal experiment I (with sodium bentonite system) identified the best formulation as: quartz 30%, bauxite 70%, talc 7.5%, Na-bentonite 4%, xanthan gum 0.2%, PVA 2%, silica sol 3%, and water and additives. The coating properties were: suspension 95%, permeability 14.2, flow cup viscosity 13.27 s, moisture absorption 3.23%, coating ability grade I, crack resistance grade I, and density 1.29 g/cm³.
(4) Orthogonal experiment II (with magnesium aluminum silicate system) identified the best formulation as: quartz 30%, bauxite 70%, talc 7.5%, Mg-Al silicate 3%, xanthan gum 0.2%, PVA 2%, silica sol 4%, and water and additives. The properties were: suspension 97%, permeability 13.4, flow cup viscosity 13.33 s, moisture absorption 3.11%, coating ability grade I, crack resistance grade I, thixotropic index 2.612, and density 1.28 g/cm³.
(5) The rheological behavior of the optimized coatings followed the Herschel–Bulkley model for a yield-pseudoplastic fluid:
$$\tau = \tau_y + K D^n$$
where $\tau$ is the shear stress, $\tau_y$ is the yield stress, $K$ is the consistency index, $D$ is the shear rate, and $n$ is the flow index ($0 < n < 1$). The presence of a yield value ensures good suspension stability, while shear-thinning behavior improves brushability.
(6) The SEM analysis of the optimal coatings showed a uniform distribution of refractory particles and the presence of open micropores, which are beneficial for gas permeability. This microstructure helps to avoid casting defects such as blowholes and sand inclusions in lost foam castings.
In summary, the developed coating formulations meet the stringent requirements of the lost foam casting process for iron castings, offering high suspension, adequate permeability, excellent coating ability, and improved moisture resistance, while remaining cost-effective and environmentally friendly.