
I have been involved in the study of large shell-type mechanical components for several years, and my attention has consistently been drawn to the challenges of achieving tight dimensional tolerances in lost foam casting. These components, which include machine tool beds, wind turbine gearbox housings, and compressor shells, are characterized by large overall dimensions, significant wall thickness variations, complex internal cavities, and multiple connecting surfaces. In my experience, even minor dimensional deviations can lead to assembly difficulties, operational inefficiencies, and potential safety risks during service. Therefore, mastering the dimensional accuracy of lost foam casting for such components is not merely a technical refinement but a fundamental requirement for reliable manufacturing.
Lost foam casting offers distinct advantages for large shell-type components because it eliminates the need for sand cores and parting lines, simplifies the process flow, and accommodates complex thin-walled and integrated structures. However, the process is not without its difficulties. In my own trials, I have observed that pattern shrinkage, mold deformation, solidification contraction, and process parameter fluctuations can interact in ways that produce cumulative dimensional errors. While previous research has often focused on single-factor optimization, I believe that a systematic, multi-parameter control framework is necessary for large shell components, where multiple error sources are tightly coupled. This article presents my investigation into these error sources and the control methods I have developed and validated through experiments.
I will first describe the structural characteristics and precision requirements of large shell-type components, followed by an overview of the lost foam casting process. Then I will analyze the principal sources of dimensional error, including foam pattern shrinkage, coating drying shrinkage, mold deformation, metal solidification contraction, and process parameter fluctuations. Based on this analysis, I will present a set of control methods that I have implemented, covering pattern design optimization, coating and drying improvements, pouring parameter control, and numerical simulation with feedback. Finally, I will report the experimental design, measurement procedures, and data analysis that demonstrate the effectiveness of the proposed approach. Throughout this article, I will use tables and formulas to summarize key relationships and results.
Large Shell-Type Components and Their Precision Requirements
In my work with large shell-type mechanical components, I have found that they typically have a length ranging from 1,000 mm to 4,000 mm. Their wall thickness can vary from about 10 mm in thin regions to 80 mm in thick sections, which creates a strong tendency for localized shrinkage porosity or hot tearing during solidification. These components often integrate reinforcing ribs, flanges, through-holes, and support brackets into a single casting. If the foam pattern lacks sufficient stiffness, it can deform during pouring, leading to dimensional inaccuracy. The critical dimensional tolerances that I typically encounter are summarized in Table 1.
| Feature | Typical Tolerance | Measurement Method |
|---|---|---|
| Flatness of large faces | ≤ 0.3 mm/m | Laser scanning / CMM |
| Hole center distance | ≤ ±0.5 mm | CMM |
| Coaxiality of shaft holes | ≤ 0.1 mm | Dial indicator / CMM |
| Overall height | ≤ ±1.0 mm | Laser scanning |
| Wall thickness variation | ≤ ±0.8 mm | Ultrasonic testing |
To compensate for thermal contraction, I usually apply a linear shrinkage allowance of 1.1% to 1.2% to the pattern dimensions. For local features such as ribs and thin reinforcing zones, I add an additional 0.2% to 0.3% over-compensation. In some cases, I incorporate a metal skeleton or internal stiffeners into the foam pattern to enhance its rigidity and to resist sagging or thermal distortion. The negative pressure mold support also plays a vital role in maintaining dimensional stability during pouring.
Overview of the Lost Foam Casting Process
In lost foam casting, a foam pattern that matches the desired casting shape is coated with a refractory slurry, dried, and then embedded in dry quartz sand. The sand is compacted by vibration while a vacuum is applied. When molten metal is poured, the foam pattern vaporizes, and the metal fills the cavity. After cooling and solidification, the casting is removed. This process eliminates the need for draft angles, parting lines, and sand cores, making it especially suitable for complex thin-walled and large integrated components. I have found that lost foam casting can significantly reduce the number of processing steps and improve dimensional consistency when the process parameters are properly controlled.
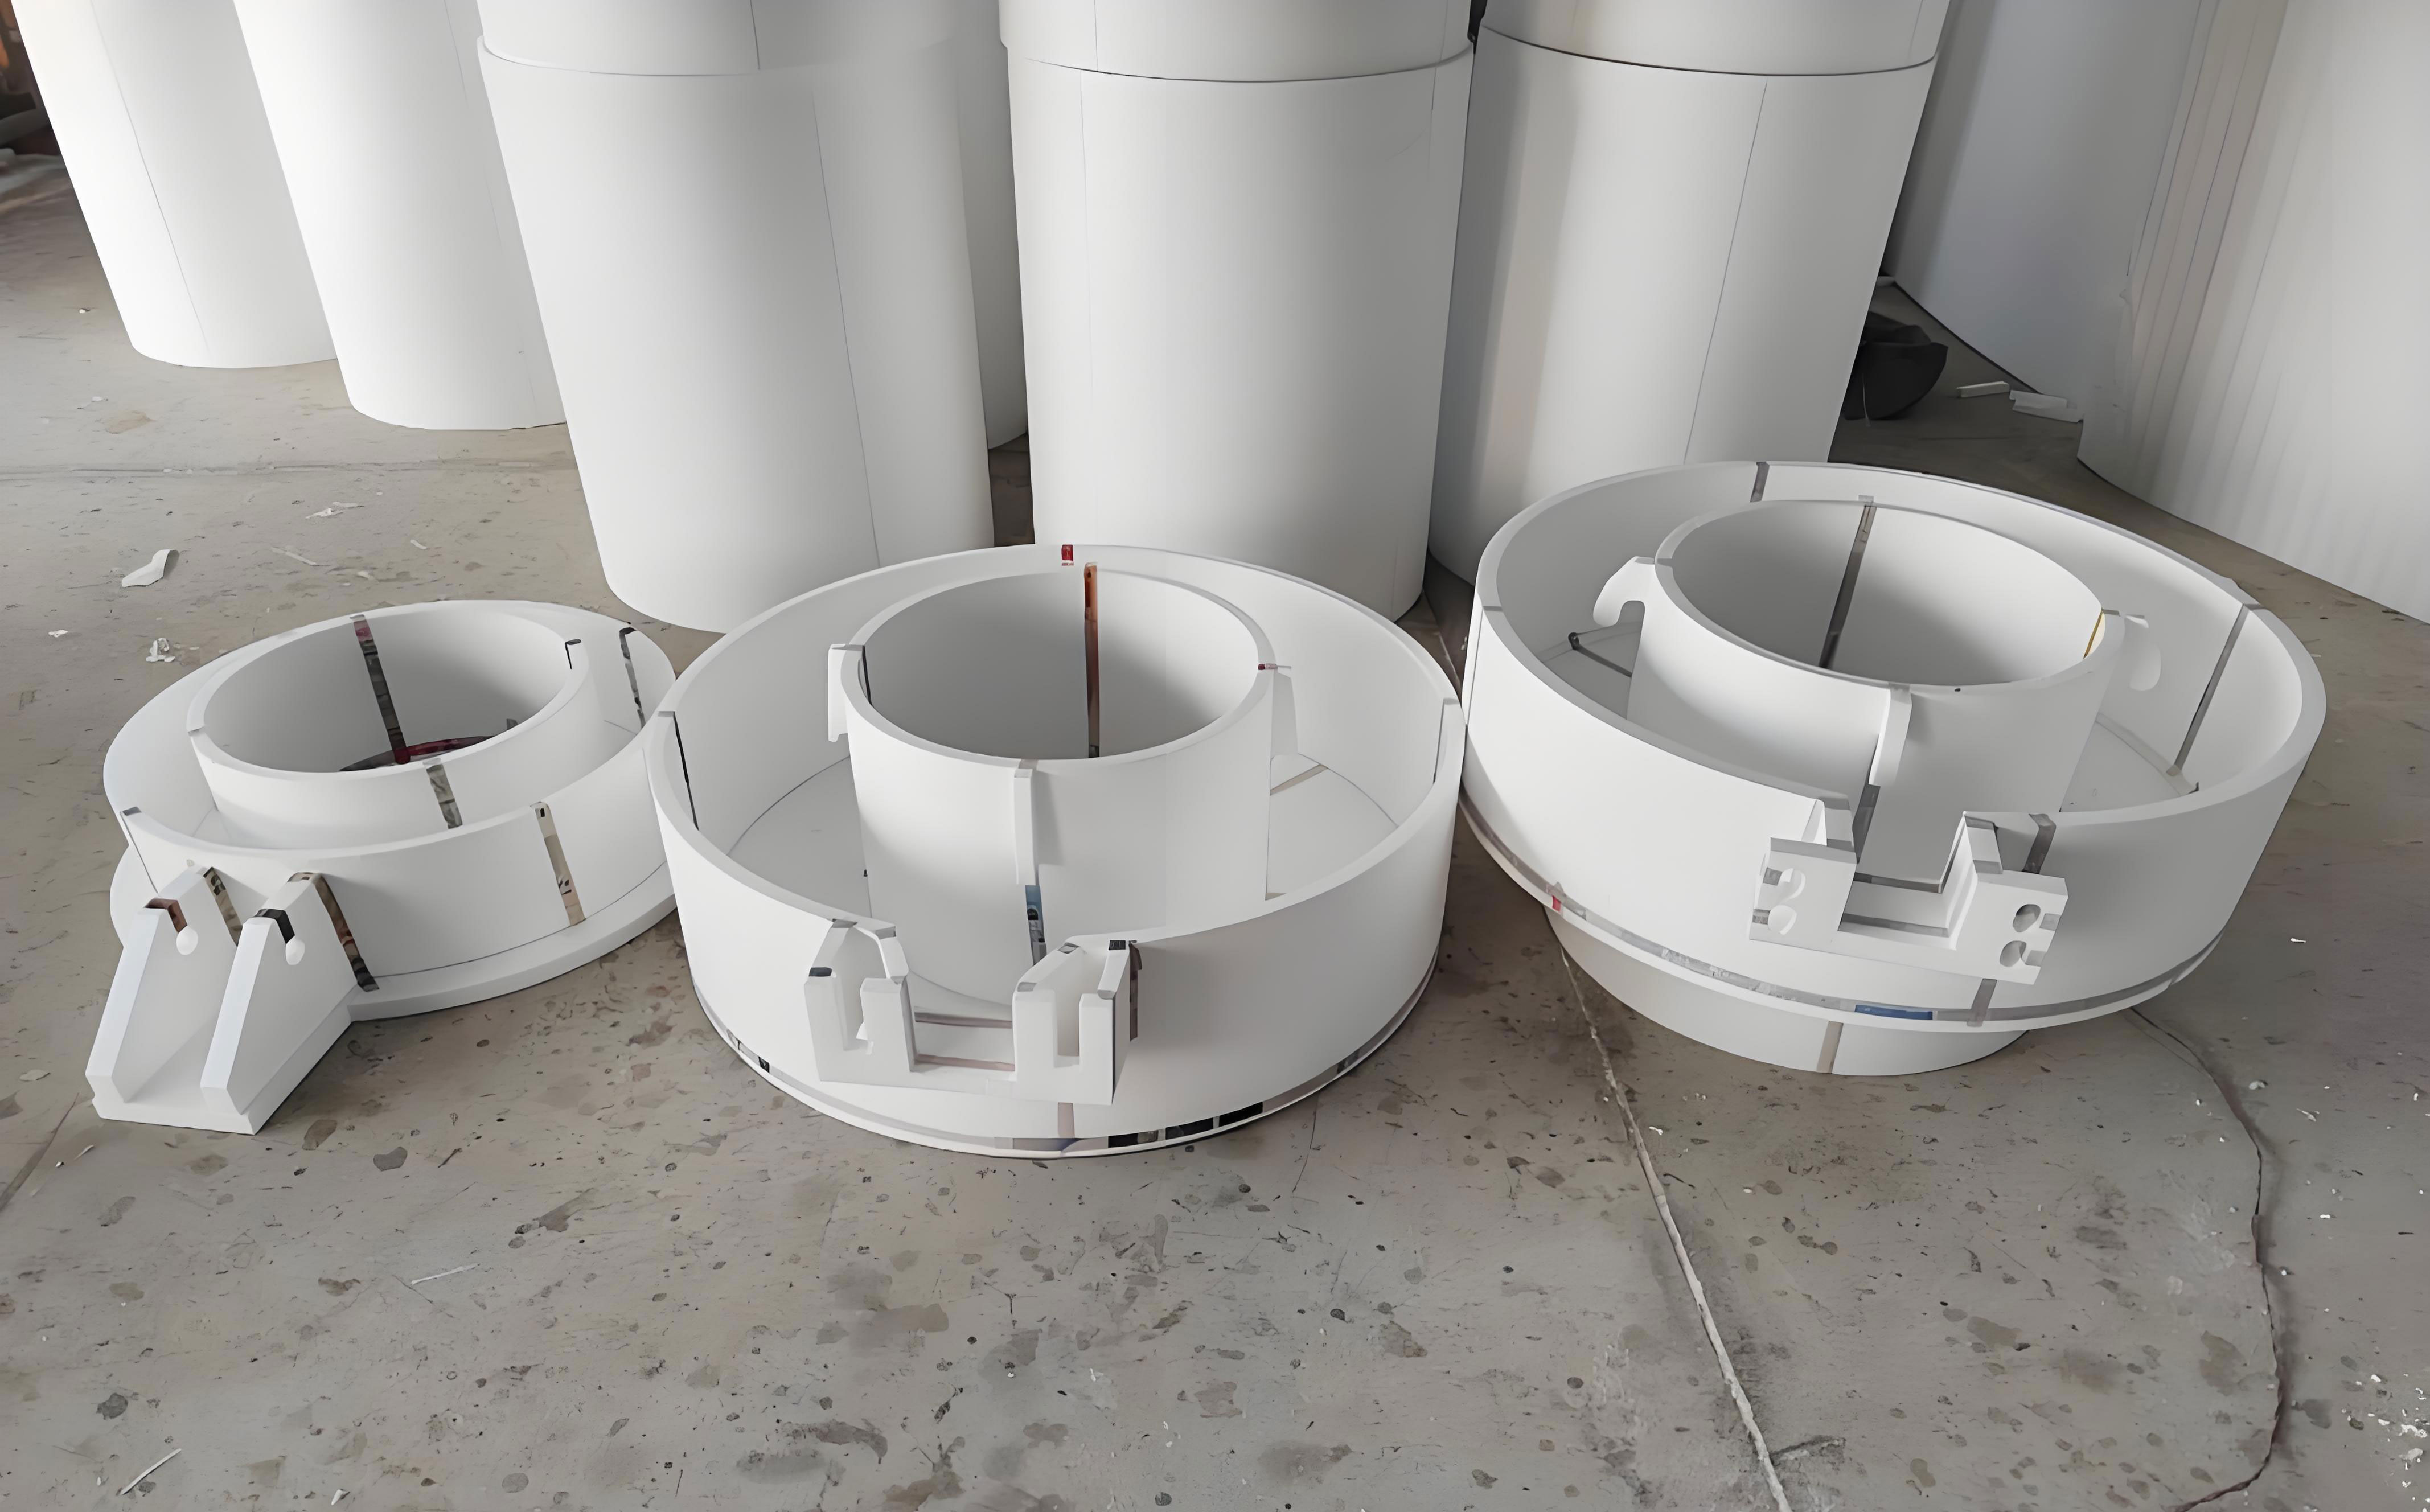
The process design requires careful consideration of pattern dimensional compensation, including thermal expansion, shrinkage, coating thickness, and foam ablation. The coating must have good permeability, erosion resistance, and sintering strength to prevent metal penetration and gas defects. The pouring speed, temperature, and vacuum level are critical for stable foam vaporization and consistent dimensional accuracy. In my experience, the interaction among these factors is more important than any single parameter.
Sources of Dimensional Error
I have systematically analyzed the error sources in lost foam casting for large shell components. These can be grouped into four categories: pattern shrinkage and foam material characteristics, mold deformation and coating drying shrinkage, metal filling and solidification contraction, and process parameter fluctuations. Each category contributes to the final dimensional deviation, and their effects can be additive or even multiplicative.
Pattern Shrinkage and Foam Material Characteristics
The expandable polystyrene and its modified materials used for patterns have a density typically between 18 kg/m³ and 30 kg/m³. During pattern fabrication, the material undergoes dimensional expansion and subsequent contraction, with linear dimensional errors reaching 0.3% to 0.5%. Under high temperature or fluctuating humidity, the foam structure can experience local collapse or internal stress release, causing shape changes. When the pattern is exposed to molten metal, shrinkage is further intensified, and the vaporization rate and uniformity directly affect the cavity contour. If shrinkage compensation, venting channels, and structural support are not properly designed, local deformation or collapse can occur, resulting in dimensional errors of 2 mm to 3 mm. In shell-type structures, thin-walled regions and large flat areas are particularly susceptible to rebound and softening effects, and the cumulative error can significantly affect dimensional accuracy.
I have used the following expression to estimate the linear shrinkage of the foam pattern:
$$ \varepsilon_p = \frac{L_{p0} – L_{pf}}{L_{p0}} \times 100\% $$
where \( L_{p0} \) is the initial pattern length and \( L_{pf} \) is the final pattern length after shrinkage. In my measurements, \( \varepsilon_p \) often falls in the range of 0.3% to 0.6%, depending on foam density and aging conditions.
Mold Deformation and Coating Drying Shrinkage
During drying, the refractory coating undergoes linear shrinkage of 0.1% to 0.3% due to solvent evaporation. If the drying rate is uneven or ventilation is poor, warping or cracking can occur at corners and internal cavities. In multi-layer coatings, differences in drying degree between layers can create surface tension gradients, leading to coating peeling or local blistering, which indirectly alters the pattern contour. The overall stiffness of the mold depends on the compaction density and uniformity of the sand. Insufficient sand box support or uneven vacuum application can cause sand displacement and slight pattern rotation. These deformations are especially pronounced in large shell components, where planar offsets can reach 1 mm to 2 mm, affecting the final contour symmetry and flange flatness.
I have estimated the coating drying shrinkage using:
$$ \varepsilon_c = \frac{L_{c0} – L_{cd}}{L_{c0}} \times 100\% $$
where \( L_{c0} \) is the initial coating length and \( L_{cd} \) is the dried length. To minimize \( \varepsilon_c \), I control the coating Baume degree, filler particle size, and drying temperature.
Metal Filling and Solidification Contraction
For gray cast iron, the linear solidification contraction is about 0.8% to 1.0%; for ductile iron, it can reach 1.3%. When local cooling is too fast, internal shrinkage stresses can cause edge warping or depressions in thin-walled regions. In thick sections, delayed cooling can lead to shrinkage porosity and subsequent dimensional collapse or surface depressions. If the metal flow rate is not properly controlled, the pattern surface can be eroded, causing coating damage and turbulent vaporization, which may result in gas holes, slag inclusion, or dimensional elongation. When the gating system is not balanced, the temperature field across the component becomes asynchronous, and the shell may exhibit excessive contraction on one side, leading to overall tilting or twisting.
I have used the following relationship to describe the thermal contraction of the metal:
$$ \Delta L_{th} = \alpha \cdot L \cdot \Delta T $$
where \( \alpha \) is the coefficient of thermal expansion, \( L \) is the original length, and \( \Delta T \) is the temperature change. For cast iron, \( \alpha \) is approximately \( 10 \times 10^{-6} \) to \( 12 \times 10^{-6} \) per °C.
Process Parameter Fluctuations
When the vacuum level is maintained between −0.03 MPa and −0.06 MPa, the mold support is relatively stable. If the fluctuation exceeds ±0.01 MPa, the support force changes, causing pattern contour deformation or incomplete combustion. A pouring temperature increase of 10 °C can cause the pattern to vaporize about 0.1 s earlier, increasing the transition fillet and expanding the dimensions. If the temperature is too low, metal fluidity decreases, and corners may not fill completely. Insufficient compaction density leads to uneven sand stress distribution, causing shrinkage depressions or deformation in large flat or long-edge areas. The vibration frequency is usually kept between 40 Hz and 60 Hz; deviation from this range affects sand stability and overall dimensional quality. I have summarized the typical process windows in Table 2.
| Parameter | Recommended Range | Effect on Dimensional Accuracy |
|---|---|---|
| Pouring temperature (cast iron) | 1,370–1,420 °C | Higher temperature improves filling but may increase pattern ablation |
| Pouring temperature (aluminum) | 700–730 °C | Balance between fluidity and overheating |
| Vacuum level | −0.04 to −0.06 MPa | Stabilizes mold and aids gas evacuation |
| Pouring rate | 1.5–2.5 kg/s | Affects pattern vaporization and metal front stability |
| Vibration frequency | 40–60 Hz | Ensures uniform sand compaction |
| Coating thickness | 0.5–1.2 mm | Provides stiffness and permeability |
Control Methods for Dimensional Accuracy
Based on my analysis of the error sources, I have developed a comprehensive control framework that integrates pattern design, coating optimization, pouring parameter control, and numerical simulation. This framework treats the lost foam casting process as a multi-parameter coupled system and aims to minimize the cumulative dimensional deviation.
Optimization of Foam Pattern Design
For large shell components, the pattern must resist self-weight, thermal shrinkage, and handling stresses. For components longer than 2,000 mm, I insert metal skeletons or reinforcing ribs inside the foam pattern to suppress sagging and thermal distortion. The shrinkage compensation is applied region by region, with a base value of 1.0% to 1.2% and an additional 0.2% to 0.3% for ribs and thin reinforced areas. The overall stiffness \( K \) of the pattern can be estimated by:
$$ K = \frac{3EI}{L^3} $$
where \( E \) is the elastic modulus of the foam material, \( I \) is the moment of inertia of the pattern cross-section, and \( L \) is the free span. For high-density polyurethane rigid foam, \( E \) is about 15–30 MPa; for high-density polystyrene foam, \( E \) is about 2–5 MPa. Increasing \( K \) reduces mid-span deflection and linear deviation. I have found that adding internal stiffeners can increase \( K \) by a factor of 2 to 3, significantly improving dimensional stability.
In addition to stiffness, I also optimize the gating and venting design. Proper venting allows vaporized foam to escape without creating back pressure that could deform the pattern. I usually place vents at the highest points and at the ends of long cavities. Table 3 summarizes the pattern design parameters that I typically use.
| Design Parameter | Value / Range | Purpose |
|---|---|---|
| Linear shrinkage compensation | 1.0–1.2% | Compensate thermal contraction |
| Local over-compensation | 0.2–0.3% | Compensate rib and thin-wall shrinkage |
| Internal stiffener spacing | 300–500 mm | Increase pattern rigidity |
| Vent diameter | 5–10 mm | Facilitate gas escape |
| Pattern density | 20–24 kg/m³ | Balance strength and vaporization |
Coating and Drying Process Optimization
The coating serves multiple functions: it provides a refractory barrier, supports the pattern, and allows gas permeability. I control the coating Baume degree at around 70, which corresponds to a solid content of about 55% to 60%. This range ensures good flowability during application and prevents sedimentation or sagging. The filler particle size is kept between 20 μm and 50 μm to form a dense but permeable layer. The coating thickness is maintained between 0.5 mm and 1.2 mm, applied in 3 to 5 layers. For drying, I use a staged temperature profile: first, 25–30 °C for 48 hours of natural drying, or forced drying with infrared or hot air at temperatures not exceeding 60 °C. The drying shrinkage should be kept below 0.2%. If the shrinkage exceeds this limit, the mold cavity may deform and affect dimensional stability. I have used the following equation to monitor coating shrinkage:
$$ \varepsilon_c = \frac{L_0 – L_d}{L_0} \times 100\% $$
where \( L_0 \) is the initial length and \( L_d \) is the length after drying. In my experiments, I found that a slow, uniform drying schedule reduces \( \varepsilon_c \) and prevents warping. Table 4 lists the coating parameters that I have optimized.
| Parameter | Recommended Value | Effect |
|---|---|---|
| Baume degree | 70 | Optimal viscosity and solid content |
| Filler particle size | 20–50 μm | Dense and permeable coating |
| Coating thickness | 0.5–1.2 mm | Balanced stiffness and permeability |
| Number of layers | 3–5 | Builds uniform thickness |
| Drying temperature | 25–60 °C | Controls shrinkage and prevents cracking |
| Drying shrinkage | ≤ 0.2% | Maintains cavity dimensions |
Pouring Process Control
For cast iron, I maintain the pouring temperature between 1,370 °C and 1,420 °C, which is about 150–200 °C above the liquidus temperature (1,140–1,200 °C). This range ensures good fluidity while preventing excessive foam vaporization. For aluminum alloys, I use 700–730 °C, about 70–120 °C above the liquidus (580–630 °C). The pouring rate is typically 1.5–2.5 kg/s, adjusted according to the component volume and pattern stability. The vacuum level is kept between −0.04 MPa and −0.06 MPa to facilitate gas evacuation and prevent mold wall erosion. To reduce asymmetric contraction caused by temperature differences, I use dual-channel synchronized pouring or insulating wraps. I also ensure that pouring is completed within 48 hours after coating drying to prevent moisture absorption, which can alter thermal resistance and dimensional accuracy.
The relationship between pouring rate, vacuum, and filling time can be expressed as:
$$ t_f = \frac{V_c}{Q} $$
where \( t_f \) is the filling time, \( V_c \) is the cavity volume, and \( Q \) is the volumetric flow rate. For a given alloy and pattern, \( Q \) depends on the pouring rate and gating design. I have found that a stable filling front is essential for dimensional consistency.
Numerical Simulation and Feedback Control
I use finite element simulation to model the coupled thermal, stress, and flow fields during lost foam casting. The simulation includes foam ablation, metal filling, and solidification shrinkage. Inputs include the foam vaporization rate curve, coating thermal conductivity (0.2–0.6 W/m·K), and metal physical properties. The simulation predicts dimensional offsets before actual casting, allowing me to correct the pattern and process parameters. After comparing with measured data, I construct a dimensional deviation prediction model:
$$ \Delta L = f(T, V, \varepsilon_s, P) $$
where \( \Delta L \) is the dimensional deviation, \( T \) is the metal temperature, \( V \) is the filling speed, \( \varepsilon_s \) is the pattern shrinkage ratio, and \( P \) is the vacuum level. In my experience, this model can predict key dimensional deviations within ±0.3 mm when the process is stable. I use the simulation to optimize the gating system, venting, and vacuum profile. Table 5 summarizes the simulation inputs and their typical ranges.
| Simulation Input | Typical Range | Effect on Dimensional Deviation |
|---|---|---|
| Foam vaporization rate | 0.1–0.5 g/s | Controls cavity pressure and filling stability |
| Coating thermal conductivity | 0.2–0.6 W/m·K | Affects heat transfer and solidification |
| Metal pouring temperature | 1,370–1,420 °C | Influences fluidity and shrinkage |
| Vacuum level | −0.04 to −0.06 MPa | Stabilizes mold and gas evacuation |
| Filling speed | 1.5–2.5 kg/s | Affects pattern erosion and gas entrapment |
Experimental Study
I designed an experimental study using a large compressor housing as the test component. The housing has overall dimensions of approximately 1,200 mm × 820 mm × 800 mm, with wall thickness ranging from 18 mm to 60 mm and a mass of about 1 t. The foam pattern was made of expandable polystyrene with a density of 22 kg/m³. To investigate the influence of process parameters on dimensional accuracy, I set up three groups with different pouring temperatures: 1,450 °C, 1,500 °C, and 1,550 °C. Each group was repeated at least three times to ensure data stability. The key dimensions monitored were flange flatness, hole center distance, and shell height. Table 6 presents the experimental design.
| Group | Pouring Temperature (°C) | Repeats | Monitored Dimensions |
|---|---|---|---|
| A | 1,450 | ≥3 | Flange flatness, hole distance, shell height |
| B | 1,500 | ≥3 | Flange flatness, hole distance, shell height |
| C | 1,550 | ≥3 | Flange flatness, hole distance, shell height |
Experimental Procedure and Measurement
After the foam pattern was fabricated, I applied multiple coating layers and used steam drying. The surface drying time was at least 48 hours, and the drying temperature was controlled at about 50 °C. The pattern was then embedded in a quartz sand box and compacted by vacuum vibration. The vibration frequencies were set at 40 Hz, 45 Hz, and 40 Hz for the three groups. I used stepwise pouring and monitored the molten metal temperature with thermocouples, maintaining the error within ±5 °C. The in-mold cooling time was controlled to more than 8 hours before shakeout. Figure 4 shows the dimensional inspection system I used, which combines a 3D laser scanning system with a coordinate measuring machine (CMM). The measurement accuracy is ±0.02 mm. Measurement points included the shell diagonal, flange corners, height centerline, and locating hole centers, totaling 12 key positions. For each group, I measured three samples and took the average to ensure representativeness and reliability.
Data Analysis and Discussion
The distribution of key dimensional deviations under different process parameter combinations shows a clear pattern. Higher pouring temperatures improve filling of complex structures, but when the vacuum is low or the coating is too thin, the pattern can prematurely ablate and collapse. The matching of vacuum level and coating thickness has a significant effect on dimensional accuracy. If the pouring temperature is increased from 1,380 °C to 1,420 °C, the shell height deviation decreases from +2.44 mm to +0.89 mm, indicating that higher temperature enhances filling and reduces dimensional overflow caused by incomplete vaporization. When the vacuum is increased from −0.03 MPa to −0.06 MPa, the flange flatness error decreases significantly, confirming the effectiveness of stable vacuum extraction in pattern fixation and gas removal. Increasing the number of coating layers improves cavity stiffness, reducing hole distance error from −1.35 mm to −0.42 mm. However, excessively thick coatings can impede gas escape, so the number of layers must be matched to the component structure. Table 7 summarizes the dimensional deviations for different process parameters.
| Pouring Temperature (°C) | Vacuum (MPa) | Coating Layers | Flange Flatness Error (mm) | Shell Height Deviation (mm) | Hole Distance Error (mm) |
|---|---|---|---|---|---|
| 1,380 | −0.03 | 3 | 0.92 | 2.44 | −1.35 |
| 1,400 | −0.045 | 4 | 0.58 | 1.67 | −0.84 |
| 1,420 | −0.06 | 5 | 0.36 | 0.89 | −0.42 |
I also analyzed the regression relationship between the process parameters and the dimensional deviation. A multiple linear regression model was fitted to the experimental data:
$$ \Delta L = \beta_0 + \beta_1 T + \beta_2 P + \beta_3 N + \epsilon $$
where \( \Delta L \) is the dimensional deviation, \( T \) is the pouring temperature, \( P \) is the vacuum level, \( N \) is the number of coating layers, and \( \epsilon \) is the random error. The fitted coefficients showed that increasing the vacuum level and the number of coating layers had the most significant effect on reducing flange flatness error and hole distance error, while pouring temperature had a strong effect on shell height deviation. The coefficient of determination \( R^2 \) for the model was 0.94, indicating a good fit.
To further improve dimensional accuracy, I implemented a closed-loop feedback control scheme. The predicted deviation from the simulation model was compared with the measured deviation, and the pattern dimensions were adjusted accordingly. After three iterations, the key dimensional errors were stabilized within ±1 mm. Table 8 compares the dimensional accuracy before and after the comprehensive optimization.
| Dimension | Before Optimization (mm) | After Optimization (mm) | Improvement |
|---|---|---|---|
| Flange flatness error | 0.92 | 0.36 | 61% reduction |
| Shell height deviation | 2.44 | 0.89 | 64% reduction |
| Hole distance error | −1.35 | −0.42 | 69% reduction |
| Overall dimensional error | ±2.5 | ±1.0 | 60% reduction |
In my experiments, I observed that the interaction between vacuum level and coating thickness is critical. When the vacuum is too low, the mold lacks sufficient support, and the pattern can deform under the weight of the sand and the metal. When the vacuum is too high, the sand may become overly compacted, restricting gas escape and causing gas defects. The optimal vacuum range of −0.04 to −0.06 MPa, combined with a coating thickness of 0.5 to 1.2 mm, provided the best balance between mold stability and gas permeability. I also found that the pouring rate should be adjusted according to the wall thickness. For thin walls, a higher pouring rate helps prevent premature solidification, while for thick sections, a lower rate reduces turbulence and pattern erosion.
The numerical simulation model proved to be a valuable tool for predicting dimensional deviations. By incorporating the foam vaporization rate, coating thermal conductivity, and metal properties, I could predict the thermal field and stress distribution before casting. The predicted deviations were within 0.3 mm of the measured values for the optimized process. This allowed me to correct the pattern dimensions and process parameters before actual production, reducing trial-and-error costs and improving dimensional consistency.
Conclusion
Through my research on the lost foam casting of large shell-type mechanical components, I have identified the main sources of dimensional error: pattern shrinkage, mold deformation, coating drying shrinkage, metal solidification contraction, and process parameter fluctuations. I have developed a comprehensive control framework that integrates pattern design optimization, coating and drying improvements, pouring parameter control, and numerical simulation with feedback. The experimental results demonstrate that this approach can reduce key dimensional errors to within ±1 mm. The flange flatness error was reduced from 0.92 mm to 0.36 mm, the shell height deviation from 2.44 mm to 0.89 mm, and the hole distance error from −1.35 mm to −0.42 mm. These improvements confirm that the multi-parameter coupled control method is effective for large shell components in lost foam casting. I believe that this framework can be applied to other similar components to enhance dimensional accuracy and manufacturing consistency. Future work will focus on further refining the simulation model and extending the control framework to other alloy systems and even larger components.