
1. Introduction and Research Background
The automotive industry’s relentless pursuit of lightweight solutions has driven significant advancements in the integrated molding process for structural components. While passenger vehicle technologies have matured, the commercial vehicle sector faces unique challenges that prevent direct technology transfer. Load-bearing components such as crossbeams require exceptional strength that lightweight alloys often cannot provide, while traditional steel structures are constrained by complex multi-step manufacturing processes. In this context, ductile iron emerges as an innovative solution for commercial vehicle lightweighting, offering a unique combination of integrated molding advantages, superior mechanical properties, and process adaptability.
Ductile iron, as a critical branch of engineering cast iron, exhibits remarkable mechanical properties due to its distinctive spheroidal graphite microstructure. The material achieves comprehensive mechanical performance comparable to carbon steel, combining excellent tensile strength with ductility. Industry statistics reveal that ductile iron production reached 15.95 million tons in 2020, accounting for 29.5% of China’s total casting output. The material’s application scope continues to expand across strategic sectors including rail transit, heavy machinery, and marine propulsion systems.
In my research, I focus on the lightweighting of commercial vehicle crossbeam structural components through integrated design. The approach replaces traditional welded steel structures with ductile iron single-piece castings, achieving significant mass reduction while maintaining structural integrity. Numerical simulation technology plays a pivotal role in optimizing the casting process, enabling systematic analysis of temperature fields, solidification behavior, and defect formation mechanisms.
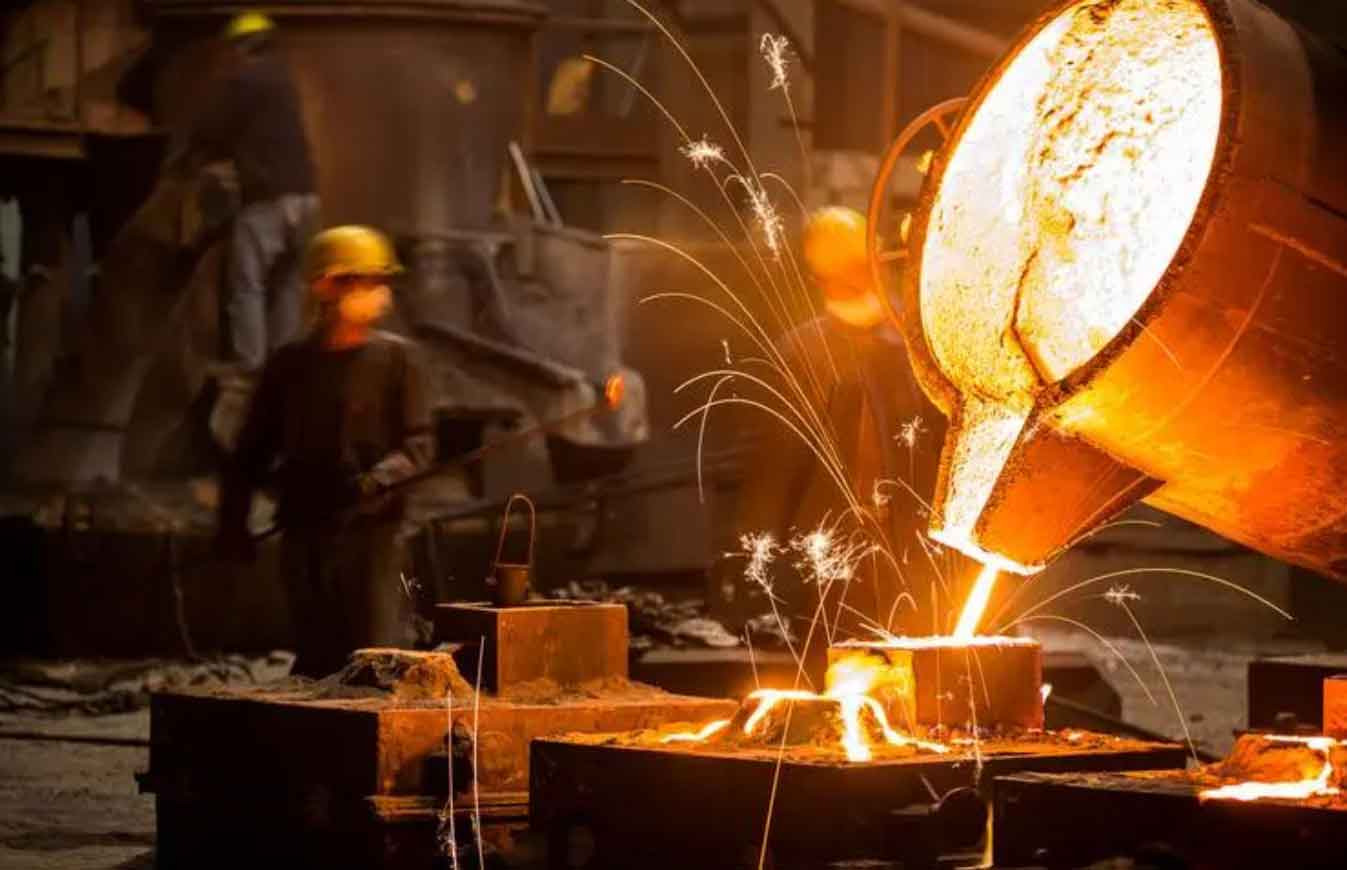
2. Development and Characteristics of Ductile Iron
2.1 Historical Development
The production of ductile iron using magnesium as a nodulizing agent was established by K.D. Millis at the International Nickel Company in 1943. Concurrently, H. Morrogh and W.J. Williams demonstrated the effectiveness of cerium-based nodulizing in 1948. In China, Professor Wang Zunming pioneered ductile iron research from 1949, successfully developing various magnesium alloys as nodulizing agents. The introduction of rare earth-magnesium ductile iron in the mid-1960s addressed critical quality issues including slag inclusion and shrinkage porosity, substantially reducing defect rates.
The evolution of ductile iron grades has enabled their widespread adoption across automotive components. Table 1 presents the mechanical properties and applications of various ductile iron grades according to Chinese standards.
Table 1: Properties and Applications of Ductile Iron Grades
| Grade | Tensile Strength (MPa) | Yield Strength (MPa) | Elongation (%) | Hardness (HBS) | Matrix Structure | Typical Applications |
|——-|————————|———————|—————-|—————-|——————|———————|
| QT400-18 | 400 | 250 | 18 | 130~180 | Ferritic | Housings, cylinder liners, pistons |
| QT450-10 | 450 | 310 | 10 | 160~210 | Ferritic | General engineering parts |
| QT500-7 | 500 | 320 | 7 | 170~230 | Ferritic + Pearlitic | Connecting rods, crankshafts |
| QT600-3 | 600 | 370 | 3 | 190~270 | Ferritic + Pearlitic | Gears, heavy-duty components |
| QT700-2 | 700 | 420 | 2 | 225~305 | Pearlitic | Crankshafts, transmission shafts |
| QT800-2 | 800 | 480 | 2 | 245~335 | Pearlitic | High-strength structural parts |
| QT900-2 | 900 | 600 | 2 | 280~360 | Bainitic | High-performance applications |
2.2 Key Processes for Ductile Iron Production
Inoculation Treatment: The inoculation process enhances graphite nucleation sites during solidification. Several methods are employed, including ladle inoculation, in-mold inoculation, and wire inoculation. In-mold inoculation offers the advantage of consistent inoculation without fading effects, as the inoculant dissolves directly in the melt during mold filling.
Nodulizing Treatment: The nodulizing process is critical for achieving spheroidal graphite morphology. The feed wire method has gained prominence due to its consistency and controllability. The primary advantages include:
– Higher magnesium recovery rate (~50%)
– Reduced oxidation slag formation
– Improved working environment conditions
– Automated process control
– Enhanced batch production capability
2.3 Solidification Characteristics of Ductile Iron
Ductile iron exhibits distinctive solidification behavior compared to gray iron. The divorced eutectic solidification mechanism involves graphite growth to a critical size before austenite shell formation. This austenite envelope restricts carbon diffusion, significantly reducing graphite growth rate. The extended eutectic temperature range results in a pasty solidification mode, creating numerous isolated molten pools that substantially increase shrinkage porosity susceptibility. However, the graphite expansion effect partially compensates for solidification contraction, offering some mitigation of shrinkage defects. The unique solidification characteristics of ductile iron sand casting parts require careful consideration in process design to minimize porosity and ensure casting integrity.
3. Materials and Experimental Methods
3.1 Raw Materials
The experimental material for producing sand casting parts is QT800-5 ductile iron. The raw materials include Q10 high-purity pig iron characterized by low sulfur and manganese content, carbon steel scrap, return scrap, ferrosilicon, nodulizing agent FeSiMg6RE2, and a complex inoculation system comprising Si-Ba inoculant for ladle inoculation and 75SiFe for stream inoculation. Table 2 presents the chemical composition of raw materials.
Table 2: Chemical Composition of Raw Materials (%)
| Raw Material | C | Si | Mn | P | S | RE | Mg | Ba | Fe |
|————–|—–|—–|——|——|——|—–|—–|—–|——-|
| High-purity pig iron | 4.25 | 0.23 | 0.05 | 0.018 | 0.010 | – | – | – | Balance |
| Scrap steel | 0.26 | 0.22 | 0.2 | 0.02 | 0.01 | – | – | – | Balance |
| Nodulizing agent | 41-44 | – | 2-3 | – | – | 6-7 | 2-3 | – | Balance |
| Si-Ba inoculant | – | 60-65 | – | – | – | – | – | 4-6 | Balance |
| 75SiFe | – | 72-80 | – | – | – | – | – | – | Balance |
3.2 Melting and Casting Process
The melting operations were conducted in a 1000 kg medium-frequency induction furnace. The process sequence involved:
1. Charge Calculation: Based on experimental requirements, precise quantities of pig iron, scrap steel, return scrap, graphite recarburizer, and alloys were calculated.
2. Melting: The charge materials were melted with rapid power adjustment to prevent oxidation. The molten metal underwent deslagging and high-temperature holding at 1530-1570 ℃ for purification.
3. Alloying: Copper, nickel, and molybdenum were added after deslagging.
4. Nodulizing and Inoculation: Feed wire nodulizing treatment was performed using FeSiMg6RE2 alloy (1.35%-1.45% addition) at 1490-1520 ℃. A three-stage inoculation process was implemented: primary inoculation with Si-Ba inoculant (0.3%-0.4%), secondary inoculation during transfer (0.2%-0.3%), and stream inoculation during pouring (0.1%-0.2%).
5. Pouring: The pouring temperature was controlled at 1380-1420 ℃. The entire pouring process was completed within 10 minutes to prevent nodulizing and inoculation fading.
4. Finite Element Theory and Simulation Approach
The finite element method (FEM) serves as the foundation for numerical simulation of casting processes. FEM discretizes continuous systems into finite numbers of simple elements, transforming complex partial differential equations into solvable numerical approximations. The analysis procedure encompasses:
1. Discretization: The continuous domain is divided into finite sub-regions. Mesh quality directly influences both computational accuracy and efficiency. For casting simulation of sand casting parts, I selected tetrahedral elements with characteristic dimensions of 2 mm, generating approximately 12.27 million mesh elements.
2. Element Analysis: Based on material properties and geometric characteristics, interpolation functions are constructed to represent displacement distribution within elements. Stress-strain relationships are derived through geometric equations and constitutive relations.
3. Global Assembly: Individual element stiffness matrices are assembled to form the system stiffness matrix. Balance equations follow the form:
$$[K]\times\{\Delta\}=\{P\}$$
Where $[K]$ is the stiffness matrix, $\{\Delta\}$ is the displacement vector, and $\{P\}$ is the load vector.
4. Constraint Application: Displacement constraints are applied to eliminate rigid body motion, ensuring matrix invertibility.
5. Post-processing: Node displacements are used to compute element stresses and visualize stress distribution through color-mapped representations.
For the casting simulation, I employed commercial finite volume software capable of coupled multi-physical field analysis, including:
– Flow field calculation using SOLA-VOF (Solution Algorithm-Volume of Fluid) method
– Thermal field computation incorporating latent heat release
– Defect prediction through Niyama criterion and porosity models
The volume of fluid (VOF) method tracks the free surface evolution during mold filling:
$$\frac{\partial F}{\partial t} + \nabla \cdot (F\mathbf{u}) = 0$$
Where $F$ represents the volume fraction of fluid in each computational cell, and $\mathbf{u}$ is the velocity vector.
Boundary Conditions: The heat transfer coefficient between molten metal and sand mold was set at 700 W/m²·K. Gravity acted in the negative Z direction with magnitude 980 cm/s².
5. Structural Design of Integrated Crossbeam
5.1 Static Analysis of Original Crossbeam
The original crossbeam structure consists of 7 components with a total mass of 50.5 kg: four L-shaped steel plates, two mounting brackets, and one U-shaped steel plate. The mounting brackets utilize QT550 ductile iron, while the steel plates employ B510L material. Table 3 summarizes the main technical parameters.
Table 3: Main Technical Parameters of the Original Crossbeam
| Component | Material | Elastic Modulus (MPa) | Yield Strength (MPa) | Poisson’s Ratio | Mass (kg) |
|———–|———-|———————-|———————|—————–|————|
| Mounting Bracket | QT550 | 172000 | 320 | 0.275 | 9.78×2 |
| Steel Plate | B510L | 200000 | 355 | 0.3 | (4.46+5.07)×2 |
| Overall Dimensions | – | – | – | – | 814×237×600 mm |
For the static analysis of sand casting parts, I established a finite element model within the complete vehicle frame environment to prevent distortion of stress analysis results. The frame rails and crossbeam plates were meshed using shell elements with four-node rectangular formulation. The frame structure comprised 85,122 elements and 87,864 nodes. The crossbeam castings were meshed using first-order tetrahedral elements, yielding 96,840 elements and 24,638 nodes.
The static analysis included four loading conditions:
1. Acceleration Condition: Simulating straight-line acceleration with maximum driving force of 60,000 N applied in the -x direction at the thrust rod.
2. Turning Condition: Maximum lateral force of 80,000 N applied in the -y direction.
3. Torsion Condition: Maximum torque of 80,000 N·m equivalent to equal and opposite forces at crossbeam ends.
4. Emergency Braking: Unequal braking forces between wheels with limit value of 20,000 N.
The original crossbeam exhibited a maximum equivalent stress of 680.6 MPa under torsion loading, exceeding the material yield strength of 550 MPa. This necessitated structural redesign to ensure safety.
5.2 Integrated Crossbeam Design
Based on static analysis results and structural design principles, I developed an integrated design for the sand casting parts of the crossbeam. The design methodology incorporated:
a) Minimum Wall Thickness Criterion: Thin-walled structures improve molten metal fluidity and reduce gas porosity tendency. The wall thickness must balance casting integrity with structural loading requirements.
b) Rib Direction Flexibility: Proper rib placement enhances stiffness while allowing thermal stress release through flexible deformation.
c) Optimal Stress Distribution: Round edge transitions reduce stress concentration factors, while reinforcement ribs arranged in the bending moment plane increase structural stiffness.
Using equivalent stiffness replacement calculation:
$$E_{steel} \cdot t_{steel}^3 = E_{ductile} \cdot t_{ductile}^3$$
With $E_{steel}$=200 GPa, $E_{ductile}$=172 GPa, and $t_{steel}$=7.6 mm, I calculated the minimum ductile iron thickness as 8.0 mm.
The integrated crossbeam, manufactured as sand casting parts, incorporates several key design features:
– Main body structure changed from I-section to circular shaft section to enhance torsional resistance
– Optimized reinforcement rib placement for improved load distribution
– Integrated support platforms and mounting surfaces
– Rounded transitions at critical stress concentration points
The integrated crossbeam model dimensions are 839×403×221 mm with a mass of 36 kg, representing a 28.7% mass reduction from the original 50.5 kg structure.
5.3 Static Analysis of Integrated Crossbeam
The finite element model of the integrated crossbeam within the frame environment comprised 66,444 shell elements for the frame structure and 3,309,713 tetrahedral elements for the crossbeam casting. The static analysis results under four loading conditions are summarized below.
Table 4: Comparison of Maximum Equivalent Stresses
| Loading Condition | Original Crossbeam (MPa) | Integrated Crossbeam (MPa) | Safety Factor |
|——————-|————————-|—————————|—————|
| Acceleration | 85.1 | 69.3 | – |
| Turning | 396.1 | 311.1 | – |
| Torsion | 680.6 | 558.4 | 1.4 |
| Emergency Braking | 95.4 | 95.4 | – |
The maximum equivalent stress of the integrated crossbeam is 558.4 MPa under torsion loading, occurring at the threaded hole location due to stress concentration effects. The safety factor of 1.4 relative to the QT800-5 material yield strength satisfies commercial vehicle strength requirements.
6. Casting Process Design
6.1 Parting Surface Selection
According to the geometry of the sand casting parts, I selected the maximum outer contour plane as the parting surface. This selection ensures:
– Product surface quality and dimensional accuracy (CT10 level)
– Convenient demolding capability
– Simple mold structure with planar configurations
– Reduced complexity in manufacturing
– Minimal projected forming area
6.2 Casting Process Parameters
The pouring time was calculated using the empirical formula:
$$t = f(\sqrt{G} + \sqrt{0.2WG^3})$$
Where $f$ is the material coefficient (0.6-0.8), $G$ is the casting mass (36 kg), and $W$ is the wall thickness (8.0-55.4 mm). The calculated pouring time was 7.27 seconds, corresponding to a pouring speed of 11 cm/s.
The pouring temperature range was initially determined as 1380-1420 ℃, considering the significant wall thickness variations in the crossbeam structure and the need to prevent nodulizing and inoculation fading.
The mold shrinkage for pearlitic ductile iron sand casting parts was determined as 1.2% based on obstruction shrinkage considerations.
6.3 Sand Core Design
The complex internal cavity structure of the crossbeam requires sand cores for accurate reproduction. I designed a monolithic sand core using self-hardening resin sand, incorporating a comprehensive ventilation system to facilitate gas evacuation during casting. The core design includes:
– Precise geometry matching the internal cavity requirements
– Multi-channel exhaust pathways
– Structural reinforcement for dimensional stability
Table 5: Core and Mold Specifications
| Parameter | Specification |
|———–|————–|
| Core material | Self-hardening resin sand |
| Flask dimensions | 1100×900×350 mm |
| Parting surface | Maximum outer contour |
| Mold configuration | Two castings per mold |
6.4 Gating System Design
For the integrated crossbeam sand casting parts, I employed a pressurized gating system with cross-sectional area ratios of F_direct:F_runners:F_ingates = 2.50:1.25:1. The ingate cross-sectional area was calculated using the flow rate method:
$$A_g = \frac{V}{v_g \cdot t}$$
Where $A_g$ is the ingate cross-sectional area, $V$ is the molten metal volume, $v_g$ is the melt velocity, and $t$ is the cavity filling time.
The calculated values were:
– Ingate area: 1200 mm² (four trapezoidal ingates)
– Runner area: 1500 mm²
– Sprue area: 3000 mm²
The initial gating system design employed four synchronized runners to achieve uniform filling of the large-span casting. Initial riser design considered directional solidification principle with risers positioned at stress concentration regions. The complete initial pouring system for the crossbeam is illustrated in the following section. Due to the high symmetry of the casting, I performed simulations on a single casting to optimize computational efficiency.
7. Numerical Simulation Results and Optimization
7.1 Pre-processing Parameters
The physical properties of QT800-5 ductile iron were established for simulation:
Table 6: Physical Properties of QT800-5
| Property | Value |
|———-|——-|
| Density (kg/m³) | 6459 |
| Liquidus temperature (K) | 1457 |
| Solidus temperature (K) | 1418 |
| Latent heat (kJ/kg) | 210 |
| Specific heat capacity (kJ/kg·K) | 0.78 |
The temperature-dependent physical parameters are shown in Figure 4, including density and thermal conductivity curves.
7.2 Initial Simulation Results
The initial casting scheme was simulated using mesh size of 2 mm, pouring temperature of 1400 ℃, pouring speed of 11 cm/s, and mold preheating temperature of 20 ℃.
Filling Process Analysis: The mold filling simulation revealed that after 1.06 seconds (5% filling), molten metal completed the runner system. At 3.31 seconds (25% filling), the melt divided into four streams entering the cavity through the ingates. By 5.04 seconds (50% filling), the melt filled the central section of the crossbeam. The filling was completed at 7.27 seconds (99% filling) without visible defects.
Solidification Process Analysis: The solidification simulation identified critical issues in the initial design. The solidification time analysis showed that:
– The complex thick-wall regions at both ends of the casting exhibited the longest solidification times
– Feeding channels disappeared prematurely, restricting liquid metal flow
– Isolated molten pools formed, increasing shrinkage porosity susceptibility
– Certain collapse zones formed without adequate compensation
The initial casting scheme produced shrinkage porosity defects with total volume of 751.16 mm³, concentrated in the thick-wall regions at the casting ends.
7.3 Riser System Optimization
To address the feeding deficiencies, I optimized the riser configuration by increasing from 4 to 8 risers (4×Φ70 mm×120 mm) strategically positioned at both ends of the crossbeam. The optimized pouring system was re-simulated under identical process parameters.
Table 7: Comparison between Initial and Optimized Schemes
| Parameter | Initial Scheme | Optimized Scheme | Improvement |
|———–|—————|——————|————-|
| Riser count | 4 | 8 | +4 risers |
| Solidification time at ends | 436 s | 307.67 s | -29.4% |
| Shrinkage porosity volume | 751.16 mm³ | 685.85 mm³ | -8.69% |
| Isolated molten pools | Multiple | None | Eliminated |
| Collapse zones | Present | Absent | Eliminated |
The optimized scheme effectively eliminated the isolated molten pools and collapse zones. The remaining shrinkage porosity primarily distributed in the risers, which serve the intended function of collecting gases and inclusions while minimizing defects in critical load-bearing regions.
7.4 Effect of Pouring Temperature
I systematically investigated the influence of pouring temperature (1380 ℃, 1400 ℃, and 1420 ℃) on filling behavior, solidification characteristics, and defect formation in sand casting parts. The filling simulation results revealed comparable filling patterns across temperature variations, with subtle differences in local filling velocity. At 1380 ℃, the melt exhibited slightly reduced fluidity, resulting in delayed filling of the thick-wall end regions compared to higher temperatures. At 1420 ℃, enhanced fluidity promoted faster filling but increased turbulence at complex cavity locations.
Table 8: Effect of Pouring Temperature on Defect Formation
| Pouring Temperature (℃) | Air Entrainment (mm³) | Shrinkage Porosity (mm³) | Solidification Time (s) |
|————————-|———————-|————————-|————————|
| 1380 | 1700.58 | 667.92 | 307.67 |
| 1400 | 1682.44 | 685.85 | 326.96 |
| 1420 | 1697.82 | 702.11 | 346.33 |
The air entrainment exhibited a nonlinear relationship with pouring temperature: initially decreasing from 1380 ℃ to 1400 ℃, followed by an increase at 1420 ℃. This behavior results from competing mechanisms: improved fluidity at moderate temperatures reduces turbulence-induced air entrapment, while excessive temperatures decrease surface tension and enhance gas evolution from the melt.
Shrinkage porosity volume increased monotonically with pouring temperature, from 667.92 mm³ at 1380 ℃ to 702.11 mm³ at 1420 ℃. Higher pouring temperatures increase the liquid-to-solid contraction and extend the solidification range, making feeding more difficult and promoting porosity formation.
7.5 Effect of Pouring Speed
The influence of pouring speed (10, 11, and 12 cm/s) on casting quality was systematically analyzed.
Table 9: Effect of Pouring Speed on Defect Formation
| Pouring Speed (cm/s) | Air Entrainment (mm³) | Shrinkage Porosity (mm³) | Solidification Time (s) |
|———————-|———————-|————————-|————————|
| 10 | 1655.77 | 696.92 | 305.69 |
| 11 | 1682.44 | 685.85 | 326.96 |
| 12 | 1700.39 | 680.85 | 348.38 |
Air entrainment showed a monotonic increase with pouring speed, ranging from 1655.77 mm³ at 10 cm/s to 1700.39 mm³ at 12 cm/s. Higher pouring speeds increase melt kinetic energy, promoting turbulence and vortex formation at cavity boundaries, which entraps gases within the melt. Additionally, faster filling reduces bubble rise time, allowing gas entrapment between dendrite arms.
Conversely, shrinkage porosity decreased with increasing pouring speed, from 696.92 mm³ at 10 cm/s to 680.85 mm³ at 12 cm/s. Faster filling reduces heat loss during pouring, resulting in more uniform temperature distribution and enhanced feeding efficiency during early solidification.
7.6 Orthogonal Experimental Design
To optimize the process parameters systematically, I conducted a two-factor, three-level orthogonal experiment (L9 design) with pouring speed and pouring temperature as the experimental factors.
Table 10: Orthogonal Experiment Design and Results
| Experiment No. | A: Pouring Speed (cm/s) | B: Pouring Temperature (℃) | Air Entrainment (mm³) | Shrinkage Porosity (mm³) |
|—————-|————————|—————————|———————-|————————-|
| 1 | 10 | 1380 | 1677.19 | 679.18 |
| 2 | 10 | 1400 | 1655.77 | 696.92 |
| 3 | 10 | 1420 | 1668.84 | 713.20 |
| 4 | 11 | 1400 | 1682.44 | 685.85 |
| 5 | 11 | 1420 | 1697.82 | 702.11 |
| 6 | 11 | 1380 | 1700.58 | 667.92 |
| 7 | 12 | 1420 | 1704.32 | 697.20 |
| 8 | 12 | 1400 | 1700.39 | 680.85 |
| 9 | 12 | 1380 | 1721.51 | 663.00 |
For air entrainment analysis:
Table 11: Range Analysis for Air Entrainment
| Statistical Parameter | A: Pouring Speed | B: Pouring Temperature |
|———————-|—————–|———————–|
| K₁₁ (Level 1 total) | 5001.80 | 5099.28 |
| K₁₂ (Level 2 total) | 5080.84 | 5038.60 |
| K₁₃ (Level 3 total) | 5126.22 | 5070.98 |
| Range | 124.42 | 60.68 |
The range analysis indicated that pouring speed (range = 124.42) exerts a greater influence on air entrainment compared to pouring temperature (range = 60.68). Analysis of variance confirms these findings:
Table 12: ANOVA for Air Entrainment
| Source | Sum of Squares | df | Mean Square | F | p |
|——–|—————|—–|————-|—–|——|
| Pouring Speed | 2643.000 | 2 | 1321.500 | 24.266 | 0.006 |
| Pouring Temperature | 567.608 | 2 | 283.804 | 5.211 | 0.077 |
| Error | 108.919 | 2 | 54.459 | – | – |
The F-test for pouring speed (p = 0.006 < 0.05) indicates statistically significant influence on air entrainment, while pouring temperature (p = 0.077 > 0.05) shows no significant effect at the 95% confidence level.
For shrinkage porosity analysis:
Table 13: Range Analysis for Shrinkage Porosity
| Statistical Parameter | A: Pouring Speed | B: Pouring Temperature |
|———————-|—————–|———————–|
| K₂₁ (Level 1 total) | 2089.34 | 2010.10 |
| K₂₂ (Level 2 total) | 2055.88 | 2063.62 |
| K₂₃ (Level 3 total) | 2041.05 | 2112.55 |
| Range | 48.29 | 102.45 |
For shrinkage porosity, the range analysis shows that pouring temperature (range = 102.45) has a greater influence than pouring speed (range = 48.29).
Table 14: ANOVA for Shrinkage Porosity
| Source | Sum of Squares | df | Mean Square | F | p |
|——–|—————|—–|————-|—–|——|
| Pouring Speed | 406.121 | 2 | 203.061 | 2.847 | 0.167 |
| Pouring Temperature | 1747.142 | 2 | 873.571 | 12.247 | 0.017 |
| Error | 142.659 | 2 | 71.330 | – | – |
The F-test for pouring temperature (p = 0.017 < 0.05) confirms its statistically significant effect on shrinkage porosity formation, while pouring speed (p = 0.167 > 0.05) does not reach significance.
Factor Analysis: The factor-level diagrams revealed optimal conditions for each response:
– Minimum air entrainment: pouring speed 10 cm/s, pouring temperature 1400 ℃
– Minimum shrinkage porosity: pouring speed 12 cm/s, pouring temperature 1380 ℃
Considering both response variables and statistical significance, the optimal parameter combination was determined as: pouring speed = 11 cm/s, pouring temperature = 1380 ℃, and mold temperature = 20 ℃. This combination achieves balanced performance with acceptable air entrainment (1700.58 mm³) and the minimum shrinkage porosity (667.92 mm³) among tested configurations.
7.7 Verification of Optimal Parameters
The optimized parameters were verified through comprehensive filling and solidification simulations. The filling simulation demonstrated stable, uniform flow front advancement without turbulence-induced defects. The solidification simulation confirmed strict adherence to directional solidification principles:
– First solidification: thin-wall central shaft region (40.72 s)
– Intermediate solidification: end sections and extensive sand contact areas
– Final solidification: complex thick-wall regions and gating system (307.67 s)
The total shrinkage porosity volume decreased to 667.92 mm³, representing an 11.74% reduction compared to the initial scheme.
8. Production Trial and Experimental Validation
8.1 Experimental Conditions
Based on the optimized simulation results, production trials of the integrated ductile iron crossbeam sand casting parts were conducted. The pouring process employed the following parameters:
– Pouring temperature: 1380 ℃
– Pouring speed: 10 cm/s
– Mold temperature: 20 ℃
– Nodulizing agent: FeSiMg6RE2 (1.35%-1.45% addition)
8.2 Chemical Composition Analysis
The chemical composition of the trial casting was determined using inductively coupled plasma atomic emission spectroscopy (ICP-AES). Three measurements were averaged to obtain reliable results.
Table 15: Chemical Composition of Integrated Crossbeam Castings
| Element | C | Si | Mn | P | S | Mg | Ni | Mo | Cu |
|———|——-|——-|——–|——-|——-|——–|——–|——–|——–|
| Content (%) | 3.61 | 2.67 | 0.105 | 0.007 | 0.007 | 0.043 | 0.438 | 0.151 | 0.803 |
The chemical composition confirms stable carbon equivalent and residual magnesium levels within specification. The very low phosphorus and sulfur contents prevent the formation of phosphide eutectic and sulfide inclusions, ensuring favorable mechanical properties.
8.3 Microstructural Characterization
According to the metal flow sequence, samples were extracted from three representative positions of the casting: position 1 (near sprue), position 2 (thin-wall shaft), and position 3 (far from sprue). Metallographic analysis followed standardized grinding, polishing, and etching procedures using 4% Nital solution.
Table 16: Metallographic Rating Results
| Sample Position | Spheroidization Grade | Graphite Size Grade | Pearlite Content (%) | Carbide (%) | Phosphide Eutectic |
|—————–|———————-|———————|———————-|————-|——————-|
| 1 (Near sprue) | 2 | 6 | ≥90 | 1 | – |
| 2 (Thin-wall shaft) | 2 | 7 | ≥95 | 1 | – |
| 3 (Far from sprue) | 2 | 6 | ≥90 | 1 | – |
The microstructural analysis revealed:
Position 1 (Near sprue): Slow cooling rate produced the largest average graphite sphere diameter with the fewest graphite nodules (180 nodules/mm²). The microstructure consists of black spherical graphite, white ferrite, and dark gray pearlite.
Position 2 (Thin-wall shaft): The fastest cooling rate generated the smallest average graphite sphere diameter with the highest nodule count (252 nodules/mm²). This position exhibited the highest pearlite content (≥95%) due to rapid cooling promoting pearlitic transformation.
Position 3 (Far from sprue): Uniform graphite size distribution with an intermediate nodule count (212 nodules/mm²). As the last solidifying region with complex geometry, this position showed greater susceptibility to gas entrapment and shrinkage defects.
Nondestructive X-ray inspection confirmed the absence of cracks, gas porosity, and shrinkage defects in both the thin-wall central region and end sections of the sand casting parts.
8.4 Mechanical Properties
Tensile testing was performed on specimens extracted from the three casting positions following GB/T 1348-2009 standard procedures.
Table 17: Tensile Test Results of Integrated Crossbeam at Different Positions
| Specimen | Yield Strength (Rp0.2/MPa) | Tensile Strength (Rm/MPa) | Elongation (A/%) |
|———-|—————————|————————–|——————|
| 1 (Near sprue) | 546 | 875 | 7.6 |
| 2 (Thin-wall shaft) | 562 | 891 | 6.0 |
| 3 (Far from sprue) | 552 | 854 | 6.5 |
The mechanical properties satisfy the QT800-5 specification with:
– Yield strength ≥ 546 MPa (> 500 MPa required)
– Tensile strength ≥ 854 MPa (> 800 MPa required)
– Elongation ≥ 6.0% (> 5% required)
Position 2 (thin-wall shaft) exhibited the highest strength (891 MPa) but lowest elongation (6.0%) due to rapid cooling promoting finer microstructure with higher pearlite content. Position 1 (near sprue) demonstrated the best ductility (7.6% elongation) due to slower cooling and larger graphite nodules.
Hardness testing was performed using a Vickers hardness tester with 3000 N load and 15 seconds dwell time.
Table 18: Hardness Test Results
| Specimen | Hardness Measurements (HV) | Average (HV) |
|———-|—————————|————–|
| 1 | 280.8 / 285.8 / 285.8 | 284.1 |
| 2 | 272.2 / 293.8 / 279.7 | 281.9 |
| 3 | 297.3 / 280.8 / 279.7 | 285.9 |
The hardness values across all positions exceeded 270 HV with minimal variation, confirming the process consistency and adequate feeding through the optimized structure.
8.5 Fracture Surface Analysis
Scanning electron microscopy (SEM) examination of tensile specimens revealed typical ductile iron fracture characteristics:
– Cleavage platforms: Multiple parallel step-like cleavage facets resulting from crack propagation along specific crystallographic planes
– River patterns: Continuous tree-like markings formed when cracks cross grain boundaries and adjust propagation direction
The fracture morphology comparison showed that specimens farther from the sprue exhibited larger cleavage platforms and more extensive river patterns, indicating reduced ductility. This corresponds to the increased size of solidification defects in these regions.
Energy dispersive spectroscopy (EDS) analysis of inclusions and graphite nodules:
Table 19: EDS Analysis Results of Inclusions and Graphite Nodules
| Analysis Point | C (%) | O (%) | Fe (%) | Ca (%) | Si (%) |
|—————-|——-|——-|——–|——–|——–|
| Oxide inclusion (position a) | 5.7 | 7.8 | 50.2 | 36.3 | – |
| Graphite nodule (position b) | 78.3 | – | 12.5 | – | 9.2 |
The EDS analysis identified the presence of calcium oxide (CaO) inclusions in the matrix. The characteristic diamond-shaped morphology of these inclusions creates severe stress concentration effects during tensile deformation. Compared to graphite nodules, which also serve as crack initiation sites through interface debonding, the sharp-edged CaO inclusions exhibit significantly greater detrimental effects on mechanical performance.
9. Conclusions
Based on the comprehensive investigation of sand casting parts for the integrated ductile iron commercial vehicle crossbeam, I draw the following conclusions:
(1) Structural Design: The integrated structural design successfully reduced the crossbeam mass from 50.5 kg to 36 kg, achieving a 28.7% mass reduction. Static analysis confirmed the maximum equivalent stress of 558.4 MPa under torsional loading, providing a safety factor of 1.4 against the QT800-5 material yield strength. The structure satisfies commercial vehicle strength requirements.
(2) Riser System Optimization: The optimized gating system with 8 risers (4×Φ70 mm×120 mm) positioned at the crossbeam ends reduced shrinkage porosity from 751.16 mm³ to 685.85 mm³, an 8.69% decrease. The optimization eliminated isolated molten pools and collapse zones while redistributing residual porosity to non-critical regions within risers.
(3) Process Parameter Effects: Systematic simulation studies revealed that:
– Minimum air entrainment (1655.77 mm³) occurs at 1400 ℃ pouring temperature and 10 cm/s pouring speed
– Minimum shrinkage porosity (663.00 mm³) occurs at 1380 ℃ pouring temperature and 12 cm/s pouring speed
– Air entrainment shows a monotonic increase with pouring speed
– Shrinkage porosity increases with pouring temperature and decreases with pouring speed
(4) Statistical Optimization: Analysis of variance identified pouring speed as a statistically significant factor for air entrainment (p = 0.006) and pouring temperature as significant for shrinkage porosity (p = 0.017). The comprehensive optimization determined the optimal parameters as: pouring speed 11 cm/s, pouring temperature 1380 ℃, and mold temperature 20 ℃. The optimized process achieved a shrinkage porosity of 667.92 mm³, an 11.74% improvement over the initial scheme.
(5) Experimental Validation: Production trials confirmed the reliability of the optimized process:
– Chemical composition stability with low phosphorus and sulfur content
– Uniform graphite morphology achieving grade 2 spheroidization and size grades 6-7
– Pearlite content exceeding 90% across all positions
– Mechanical properties meeting QT800-5 requirements: yield strength ≥ 546 MPa, tensile strength ≥ 854 MPa, elongation ≥ 6.0%
– Hardness values exceeding 270 HV with minimal positional variation
(6) Defect Characterization: Fracture surface analysis revealed that calcium oxide (CaO) inclusions with sharp-edged morphology present the most severe detrimental effects on mechanical performance compared to graphite nodules. The research demonstrates that directional solidification control through optimized gating system design is essential for producing high-quality complex ductile iron castings, where graphite expansion effects alone cannot fully compensate for liquid and solidification contraction in thick-wall sand casting parts with complex geometries.