
The figure below shows the graphite morphology at different wall thicknesses of lost foam casting ductile iron. Figures (a) – (c) show the graphite morphology in the samples with wall thickness of 20mm, 40mm and 60mm respectively.
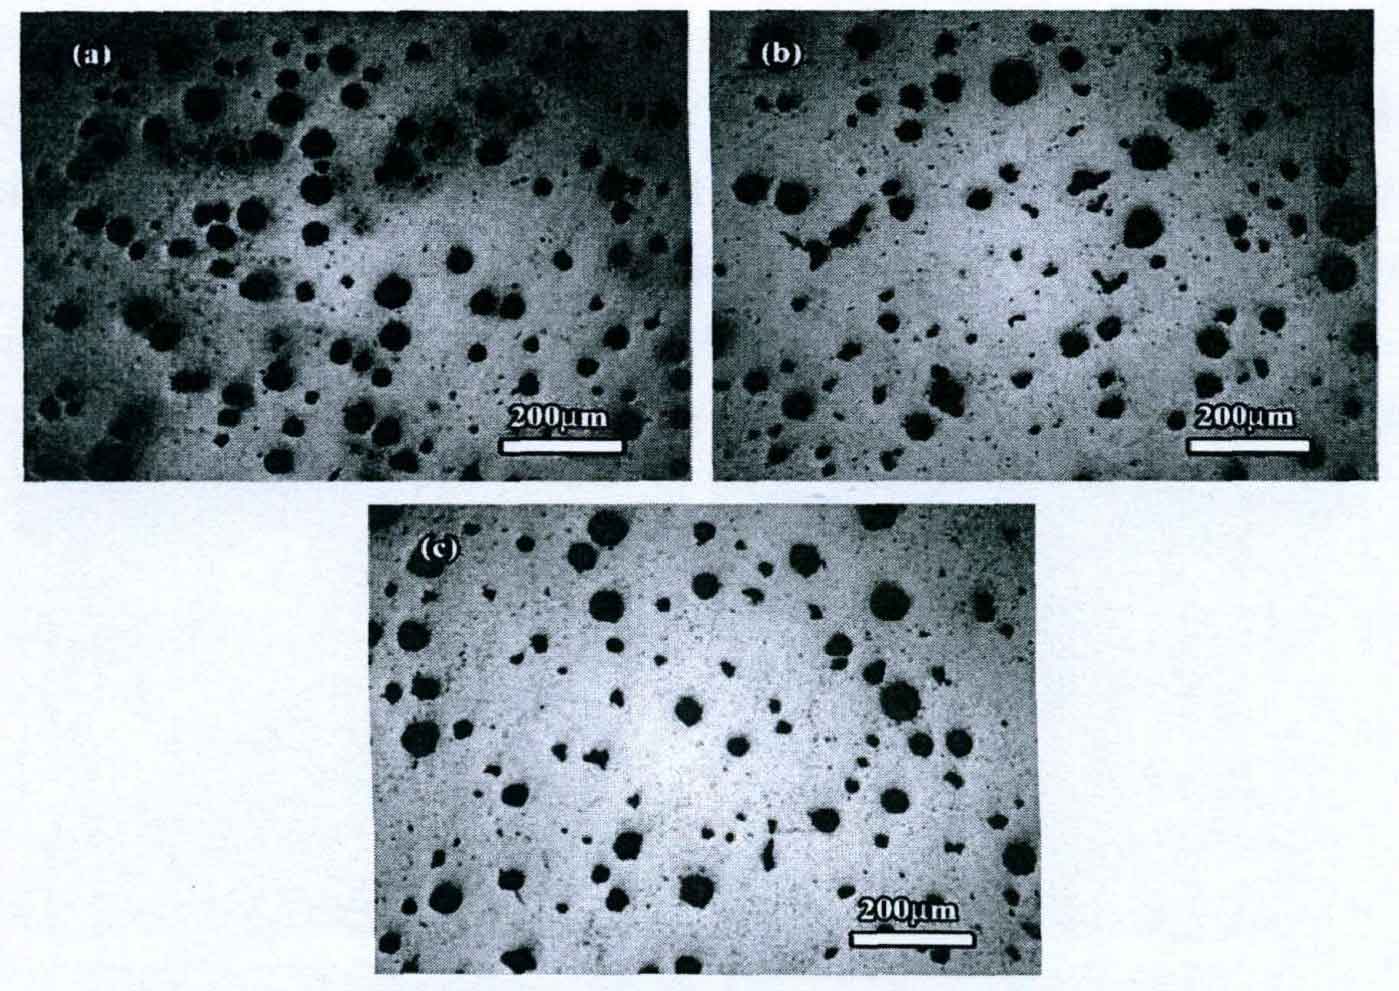
It can be seen from the figure that when the wall thickness of the sample is small (20mm), the number of graphite balls is large, and the larger graphite balls are round, and the number of distorted graphite is small; With the increase of sample wall thickness, the number of graphite balls in the sample decreases gradually. With the help of image analysis software, the parameters of graphite balls in the cast iron are statistically analyzed, and the structure is shown in the table.
| Specimen thickness /mm | Number of graphite balls per unit area | Spheroidization rate |
| 20 | 180 | 0.96 |
| 40 | 147 | 0.92 |
| 60 | 127 | 0.93 |
It can be seen from the table that with the increase of sample wall thickness, the number of graphite balls per unit area gradually decreases, and the number of graphite balls per unit area is less in the sample with wall thickness of 60mm; The graphite spheroidization rate of the sample with a wall thickness of 20mm is large, while the spheroidization rate of the two samples with a wall thickness of 40mm and 60mm is almost the same.