
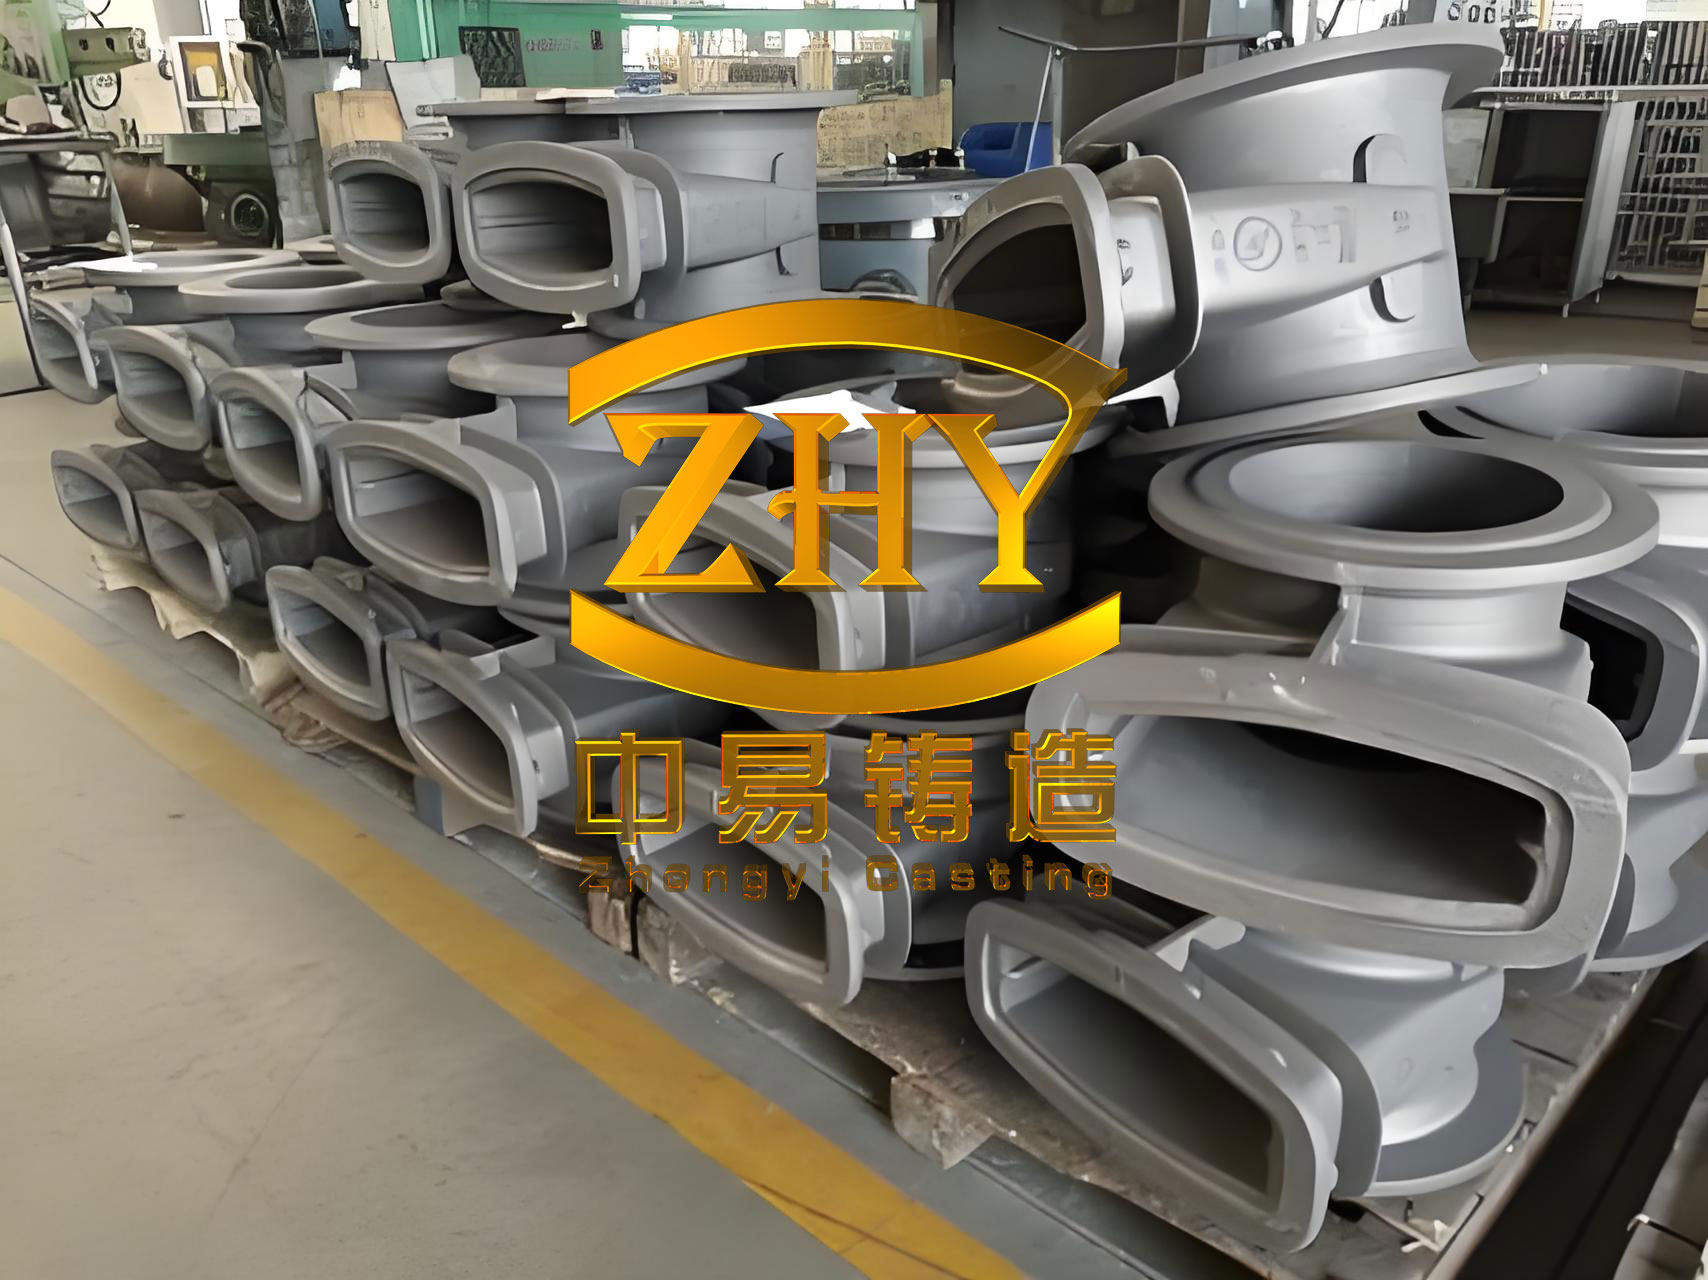
Within the ongoing evolution of the cast iron industry, the share of ductile iron and compacted graphite iron continues to rise. However, grey iron, as a mainstream material, retains the highest market share due to its advantageous casting characteristics, such as excellent fluidity, minimal shrinkage, and good machinability. The castings produced in our foundry are predominantly grey iron, with a focus on higher grades like HT280 and HT300 (analogous to Class 275 and 300 respectively). The conventional route to achieve these specifications has been a high-carbon equivalent, alloying process. This involves the addition of specific types and quantities of alloying elements to enhance the strength and hardness of the castings.
In recent years, the cost of alloying elements has escalated significantly, with ferromolybdenum experiencing the most substantial price increase. Ferromolybdenum constitutes over 60% of the total alloy cost in our production. This economic pressure has created an urgent need to identify an alternative methodology that can maintain performance while reducing or eliminating the use of costly molybdenum. The exploration of a high Silicon-to-Carbon (Si/C) ratio process presents itself as a viable and promising solution for grey iron castings.
1. Foundry Production Conditions and Baseline Process
1.1 Melting Equipment and Raw Materials
Melting is conducted in medium-frequency induction furnaces, typically of 8-ton capacity. The primary charge materials consist of pig iron, steel scrap, and returns (gates, risers, and rejected castings). Additional materials for composition adjustment include bulk ferrosilicon, ferromanganese, and recarburisers.
1.2 Furnace Melting Procedure
The standard charging practice is followed: 5-10% pig iron, 50-60% steel scrap, and the balance as returns. The charging sequence is pig iron, followed by returns, and then steel scrap. During the melting process, ferrosilicon, ferromanganese, and recarburiser are added to adjust the base iron composition to the target range shown in Table 1.
| C | Si | Mn | P | S |
|---|---|---|---|---|
| 3.20 – 3.30 | 1.50 – 1.65 | 0.40 – 0.80 | < 0.06 | 0.08 – 0.12 |
1.3 Ladle Treatment (Inoculation and Alloying)
Following melting, a ladle treatment is performed. Inoculant and specific alloys are placed in the bottom of the ladle prior to tapping. The tapping temperature is controlled between 1480°C and 1540°C to ensure effective dissolution and absorption of the additives. The inoculant used is a barium-bearing ferrosilicon. Alloying elements include electrolytic copper, tin granules, ferromolybdenum, and ferrochromium. For grades HT280 and above, all four alloys are typically added to ensure properties across varying section thicknesses.
- Copper (Cu): Functions to refine and homogenize the pearlite matrix and graphite structure. It reduces chill in thin sections and improves mass effect (section sensitivity).
- Tin (Sn): Primarily acts to reduce or eliminate ferrite, stabilizes and refines pearlite, and improves section sensitivity.
- Chromium (Cr): Refines graphite and promotes the formation of a fine, stable pearlitic matrix.
- Molybdenum (Mo): Refines graphite, increases the amount and fineness of pearlite, promotes carbide formation, and enhances uniformity of structure in heavy sections.
The final target composition for HT280 grey iron castings after ladle treatment is shown in Table 2. Elements like C, S, Mn, and P are controlled from the base iron and are not typically adjusted during ladle treatment.
| Si | Cu | Cr | Sn | Mo |
|---|---|---|---|---|
| 1.70 – 2.00 | 0.30 – 0.50 | 0.20 – 0.40 | 0.03 – 0.05 | 0.10 – 0.20 |
1.4 Molding, Pouring, and Inoculation
Test bars and castings are produced using alkaline phenolic resin no-bake sand molds. During pouring, a stream inoculation (late inoculation) practice is employed using a zirconium-bearing ferrosilicon inoculant with a grain size of 0.4-0.8 mm. The addition rate is 0.08-0.12% of the metal weight, applied via a pneumatic dispensing system on the pouring unit to ensure uniform distribution and absorption. Pouring temperatures are maintained between 1360°C and 1400°C to ensure complete mold filling.
2. High Si/C Ratio Experimental Process Design
The core objective is to eliminate the use of ferromolybdenum while maintaining the same Carbon Equivalent (CE) and meeting the mechanical property specifications for HT280 grey iron castings. This involves switching from a Cu-Cr-Mo-Sn alloyed iron to a Cu-Cr-Sn alloyed iron with an elevated Si/C ratio. The expected reduction is approximately 0.15% Mo, leading to a projected cost saving of 600 RMB per ton of molten metal.
The Si/C ratio is increased from approximately 0.55 to 0.70. This is achieved by reducing the average carbon content by about 0.1% and increasing the final silicon content by about 0.4%. The compositional ranges for the original and modified processes are compared in Table 3.
| Material | Base Iron C | Base Iron Si | Final Si | Cu | Cr | Sn | Mo | Target Si/C |
|---|---|---|---|---|---|---|---|---|
| Cu-Cr-Mo-Sn Alloy | 3.20-3.30 | 1.50-1.65 | 1.70-2.00 | 0.30-0.50 | 0.20-0.40 | 0.03-0.05 | 0.10-0.20 | ~0.55 |
| Cu-Cr-Sn Alloy (High Si/C) | 3.10-3.20 | 1.50-1.65 | 2.10-2.20 | 0.30-0.50 | 0.20-0.40 | 0.03-0.05 | – | ~0.70 |
Maintaining a constant Carbon Equivalent (CE) while increasing the Si/C ratio induces several key microstructural and property changes in grey iron castings:
- Increased Primary Austenite: The volume fraction of primary austenite dendrites formed during solidification increases, providing a stronger metallic matrix framework.
- Reduced Graphite Content: The overall lower total carbon content results in a decreased volume of graphite flakes, thereby reducing the notch effect and stress-concentrating action of graphite on the matrix.
- Elevated Eutectoid Temperature: The eutectoid transformation occurs at a higher temperature, which can lead to coarser pearlite formation, potentially having a negative impact on strength.
- Solid Solution Strengthening: A greater amount of silicon dissolves in the ferrite phase (including the ferrite within pearlite), significantly strengthening it via solid solution hardening.
The Carbon Equivalent (CE) is calculated using the standard formula, which accounts for the graphitizing effect of silicon and phosphorus:
$$ CE = \%C + \frac{1}{3}(\%Si + \%P) $$
For our process control, phosphorus is low and stable, so the primary relationship is between C and Si. The change aims to keep CE constant while altering the Si/C ratio. We can express this as:
$$ CE_{target} = C_{orig} + \frac{1}{3}Si_{orig} \approx C_{new} + \frac{1}{3}Si_{new} $$
Where $C_{new} < C_{orig}$ and $Si_{new} > Si_{orig}$.
3. Experimental Procedure and Results
3.1 Experimental Methodology
Following the designed scheme, the base iron carbon content was adjusted to 3.10-3.20%. The ladle treatment was modified by increasing the amount of barium-bearing inoculant and completely eliminating the addition of ferromolybdenum. Other alloy additions (Cu, Cr, Sn) remained unchanged.
Using standard ladle practice, one-ton heats were tapped for pouring separately cast test bars (according to standard dimensions) and for producing actual castings. Pouring temperature was controlled between 1360°C and 1400°C. Four separate trials were conducted. For each trial, the chemical composition, metallographic microstructure, and mechanical properties (tensile strength and Brinell hardness) of the test bars were analyzed. Furthermore, critical sections of the actual castings were destructively sampled to evaluate the in-situ (bulk) properties and microstructure.
3.2 Experimental Results
3.2.1 Separately Cast Test Bar Properties
The results for the Cu-Cr-Sn alloyed grey iron castings with the high Si/C ratio (~0.7) are summarized in Table 4. All measured values for chemical composition, microstructure, and mechanical properties meet the requirements for the HT280 grade. The factory specification demands a minimum tensile strength of 280 MPa and a hardness range of 190-260 HBW.
| Grade | Si/C | C (%) | Si (%) | Cu (%) | Cr (%) | Sn (%) | Graphite Structure | Matrix | Tensile (MPa) | Hardness (HBW) |
|---|---|---|---|---|---|---|---|---|---|---|
| HT280 | 0.70 | 3.11 | 2.18 | 0.47 | 0.29 | 0.047 | Type A, Size 4 | 98% Pearlite | 295 | 209 |
| HT280 | 0.67 | 3.15 | 2.11 | 0.45 | 0.25 | 0.040 | Type A, Size 4 | 98% Pearlite | 290 | 221 |
| HT280 | 0.68 | 3.18 | 2.17 | 0.43 | 0.30 | 0.043 | Type A, Size 4 | 98% Pearlite | 300 | 211 |
| HT280 | 0.69 | 3.12 | 2.16 | 0.40 | 0.24 | 0.043 | Type A, Size 4 | 98% Pearlite | 310 | 220 |
| Average | 0.69 | 3.14 | 2.15 | 0.44 | 0.27 | 0.043 | Type A, Size 4 | >98% Pearlite | 299 | 215 |
3.2.2 Bulk (Casting) Properties
Samples were taken from a critical, relatively heavy section (bearing cap bolt boss, approximately 50 mm thick) of the actual castings. The results from the dissected samples are presented in Table 5. The bulk properties, while naturally lower than those of the separately cast test bars due to differences in cooling rate, satisfactorily meet the required performance levels for the casting in service, confirming the viability of the process.
| Sample | Grade | Graphite Structure | Matrix | Tensile (MPa) | Hardness (HBW) |
|---|---|---|---|---|---|
| 1# | HT280 | Type A, Size 4 | 98% Pearlite | 262 | 183 |
| 2# | HT280 | Type A, Size 4 | 98% Pearlite | 245 | 193 |
4. Comparative Analysis and Discussion
4.1 Composition and Mechanical Property Comparison
To establish a proper baseline, data from the original Cu-Cr-Mo-Sn alloyed process (Si/C ~0.55) is presented in Table 6. Furthermore, to isolate the effect of molybdenum, supplementary trials were conducted using the Cu-Cr-Sn alloy composition *at the original low Si/C ratio* (~0.55). The metal from these trials was poured into test bars and then returned to the furnace to prevent the production of off-specification castings. Data from these supplementary trials is shown in Table 7.
| Grade | Si/C | C (%) | Si (%) | Cu (%) | Cr (%) | Sn (%) | Mo (%) | Tensile (MPa) | Hardness (HBW) |
|---|---|---|---|---|---|---|---|---|---|
| HT280 | 0.58 | 3.25 | 1.89 | 0.46 | 0.25 | 0.046 | 0.15 | 335 | 246 |
| HT280 | 0.57 | 3.24 | 1.85 | 0.46 | 0.28 | 0.047 | 0.12 | 325 | 246 |
| HT280 | 0.55 | 3.26 | 1.79 | 0.47 | 0.29 | 0.045 | 0.12 | 285 | 263 |
| HT280 | 0.55 | 3.30 | 1.80 | 0.47 | 0.30 | 0.047 | 0.13 | 310 | 245 |
| Average | 0.56 | 3.26 | 1.83 | 0.47 | 0.28 | 0.046 | 0.13 | 314 | 250 |
| Grade | Si/C | C (%) | Si (%) | Cu (%) | Cr (%) | Sn (%) | Tensile (MPa) | Hardness (HBW) |
|---|---|---|---|---|---|---|---|---|
| HT280 | 0.57 | 3.25 | 1.85 | 0.48 | 0.26 | 0.045 | 275 | 200 |
| HT280 | 0.57 | 3.26 | 1.85 | 0.45 | 0.26 | 0.042 | 295 | 210 |
| HT280 | 0.54 | 3.30 | 1.79 | 0.45 | 0.25 | 0.041 | 280 | 208 |
| HT280 | 0.56 | 3.26 | 1.83 | 0.44 | 0.29 | 0.042 | 285 | 195 |
| Average | 0.56 | 3.27 | 1.83 | 0.46 | 0.27 | 0.043 | 284 | 203 |
The data reveals clear trends. At a constant low Si/C ratio (~0.55), the Cu-Cr-Mo-Sn alloyed iron exhibits superior properties compared to the Cu-Cr-Sn alloyed iron. The average tensile strength is approximately 10.6% higher (314 MPa vs. 284 MPa), and the hardness is about 23% higher (250 HBW vs. 203 HBW). This confirms that molybdenum plays a critical role in strengthening and hardening, and simply removing it from the low Si/C process carries a significant risk of failing to meet specifications for grey iron castings.
The key finding is the effect of increasing the Si/C ratio. Under a constant Carbon Equivalent and using the same Cu-Cr-Sn alloy base:
- The high Si/C ratio (0.7) process yields an average tensile strength of 299 MPa, which is 5.3% higher than the low Si/C ratio (0.55) process (284 MPa).
- The hardness increases by 5.9% (215 HBW vs. 203 HBW).
- Most importantly, the strength of the high Si/C ratio Cu-Cr-Sn iron (299 MPa) significantly exceeds the HT280 minimum requirement of 280 MPa.
This demonstrates that elevating the Si/C ratio effectively compensates for the removal of molybdenum, enabling the production of specification-compliant grey iron castings at a lower alloy cost.
The strengthening mechanism can be partly described by considering the contributions. The tensile strength ($\sigma_t$) of grey iron is a complex function of matrix strength ($\sigma_m$), graphite morphology (size, shape, distribution – factor $K_g$), and other defects. Simplistically:
$$ \sigma_t \propto \sigma_m \cdot K_g $$
Increasing the Si/C ratio influences both terms:
- Matrix Strength ($\sigma_m$): Silicon provides solid solution strengthening to ferrite. The increase in silicon content, $\Delta Si$, directly increases the yield strength of the ferrite phase. The relationship can be approximated for low alloy steels and iron as $\Delta \sigma_{ys} \approx k_{Si} \cdot (\Delta Si)^{n}$, where $k_{Si}$ is a strengthening coefficient and $n$ is often near 1. This stronger ferrite, present within the pearlite, enhances the overall matrix strength.
- Graphite Factor ($K_g$): The reduced carbon content leads to a lower volume fraction of graphite ($V_g$). Since graphite flakes act as internal stress raisers, reducing their volume generally improves strength. $K_g$ is inversely related to parameters like flake length and volume fraction. Therefore, $K_g$ increases as $V_g$ decreases.
While molybdenum contributes strongly to $\sigma_m$ by refining pearlite and promoting solid solution/carbide hardening, the combination of solid solution strengthening from high silicon and the improved $K_g$ from lower graphite content in the high Si/C ratio grey iron castings provides an alternative pathway to achieve the target $\sigma_t$.
4.2 Metallographic Structure Comparison
Microstructural analysis supports the mechanical property data. The high Si/C ratio grey iron castings exhibit a discernible refinement in graphite structure compared to the standard Mo-containing grade at low Si/C. The graphite flakes appear shorter and more uniformly distributed (Type A, size 4 in both cases, but with a perceptible trend towards shorter flakes at high Si/C). This reduces the effective stress concentration factor of the graphite, contributing to higher strength. The pearlite content remains consistently high (>98%) in both cases, maintained by the combined action of Cu, Cr, and Sn. However, the pearlite in the high Si/C material may appear slightly less refined than in the Mo-containing iron, which is consistent with the eutectoid transformation occurring at a higher temperature. Despite this, the net effect of matrix solid solution strengthening and improved graphite morphology is positive for tensile strength.
5. Conclusions
- The conventional production of high-grade HT280 grey iron castings using a Cu-Cr-Mo-Sn alloying approach, while effective, incurs high material costs primarily driven by ferromolybdenum. Direct reduction or elimination of alloy content under the original low Si/C ratio process poses a significant risk of failing to meet mechanical property specifications.
- The strategy of increasing the Silicon-to-Carbon (Si/C) ratio, while maintaining a constant Carbon Equivalent (CE), offers a scientifically sound and practical method to reduce alloy dependency. By switching to a Cu-Cr-Sn alloy system and elevating the Si/C ratio from approximately 0.55 to 0.70, the use of ferromolybdenum can be successfully eliminated.
- For the same Cu-Cr-Sn alloy base, increasing the Si/C ratio from ~0.55 to ~0.70 results in an average tensile strength improvement of about 5%. The achieved average strength of 299 MPa comfortably meets and exceeds the HT280 grade requirement of 280 MPa for grey iron castings. Although not as potent as direct molybdenum addition, this approach provides a crucial advantage in reducing raw material costs.
- Facing the persistent challenge of high production costs in the grey iron foundry sector, the strategic reduction of expensive alloying elements coupled with an intentional increase in the Si/C ratio represents a viable and effective pathway for cost optimization. This exploration confirms that a nuanced understanding and control of fundamental compositional ratios, like Si/C, are essential for developing more economical and sustainable production processes for high-quality grey iron castings.