1. Fracture morphology
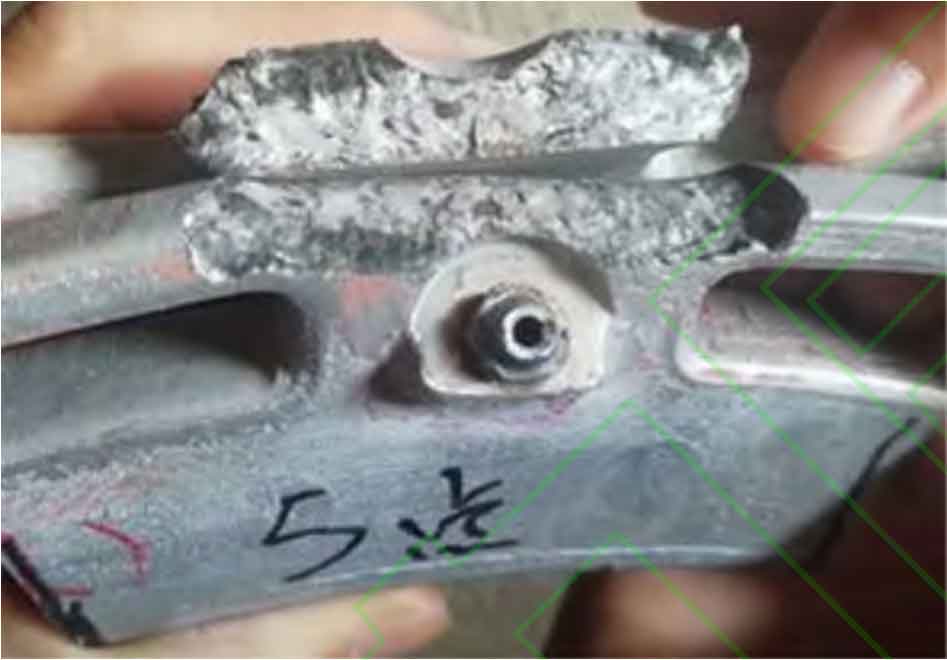
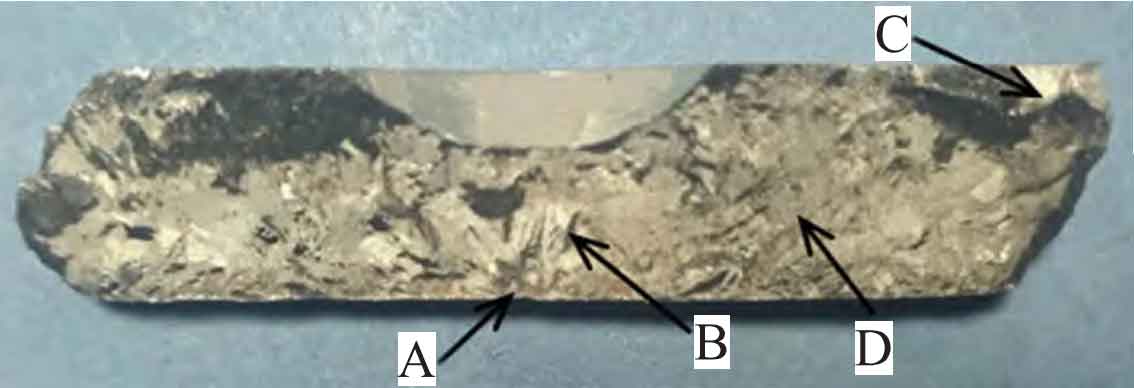
Figure 1 shows the fracture morphology of the end cover crack. The crack starts at the back of the end cover groove and extends along the slope to the right angle of the groove, forming a through crack. Clean the fracture surface with alcohol, and observe the macroscopic morphology of the fracture with naked eyes, as shown in Figure 2. The main characteristic areas include four areas A~D, of which area C is the artificial tear fracture surface during sample preparation. The original crack fracture surface (area B) shows obvious “bainite” morphology, which is a typical fatigue crack feature. Among them, there are many beach shaped strips with concentric arc divergent distribution, which are in the form of fatigue fracture. In the craze area, there is an obvious “river pattern” along the crack propagation direction, and the source of the “river” is the crack source (position A in Figure 2). In addition, there is an accelerated cracking fracture appearance at the end of the fracture (position D in Figure 2). The morphology of this area is similar to the brittle fracture surface, which is coarse grained, and the area of this area accounts for a small proportion.
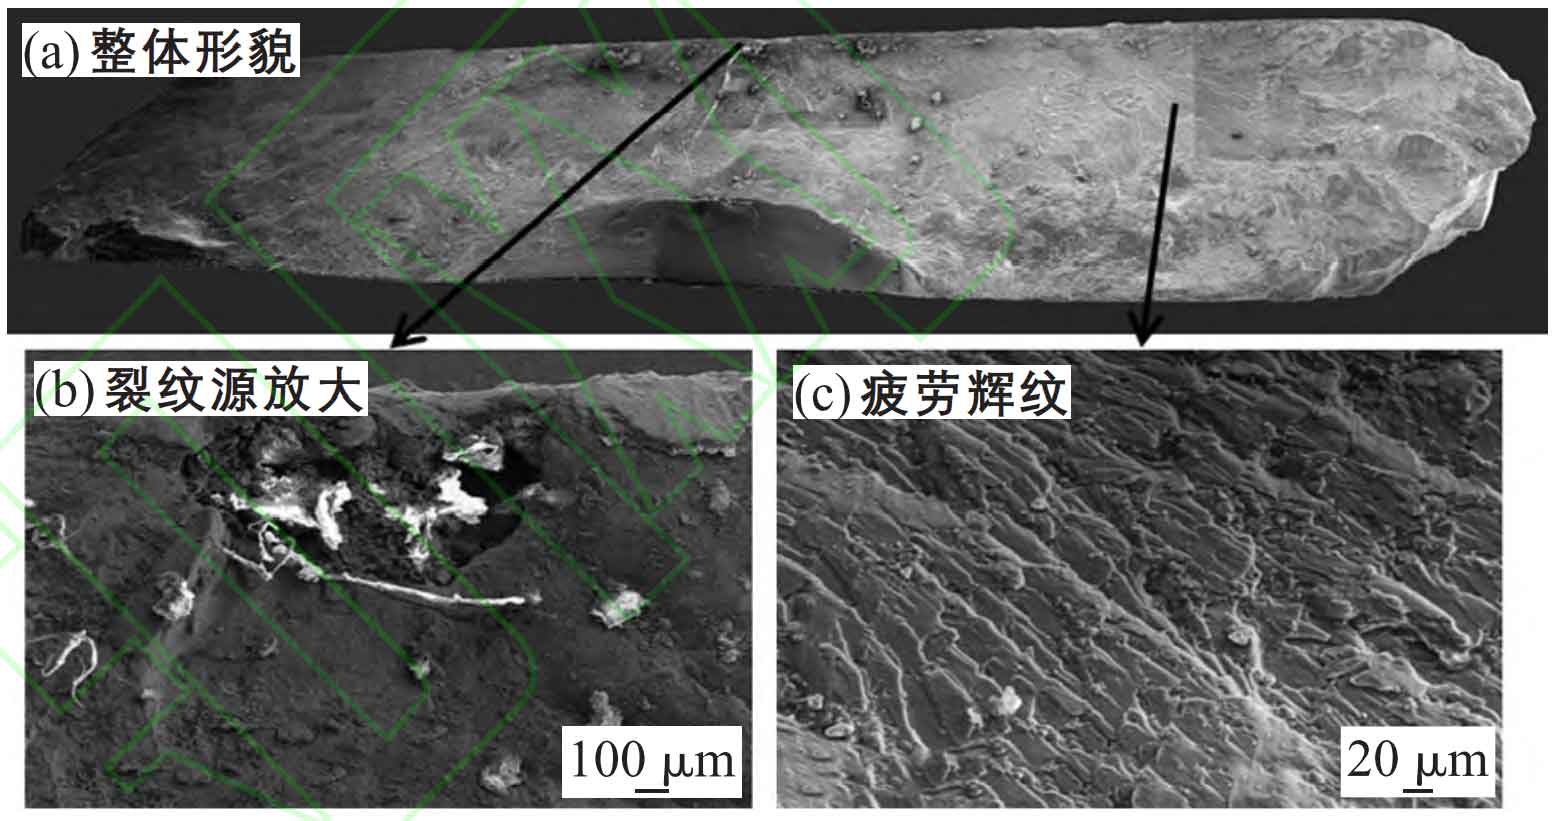
The crack fracture surface was observed by scanning electron microscope, as shown in Fig. 3. The overall morphology is shown in Fig. 3 (a). Fig. 4 (b) shows the enlarged morphology of the crack source, and obvious slag inclusion and porosity are observed at the crack source. Figure 3 (c) shows obvious fatigue striations and river patterns consistent with the crack growth direction, which belong to typical fatigue striations.
2. Fracture EDS detection and analysis
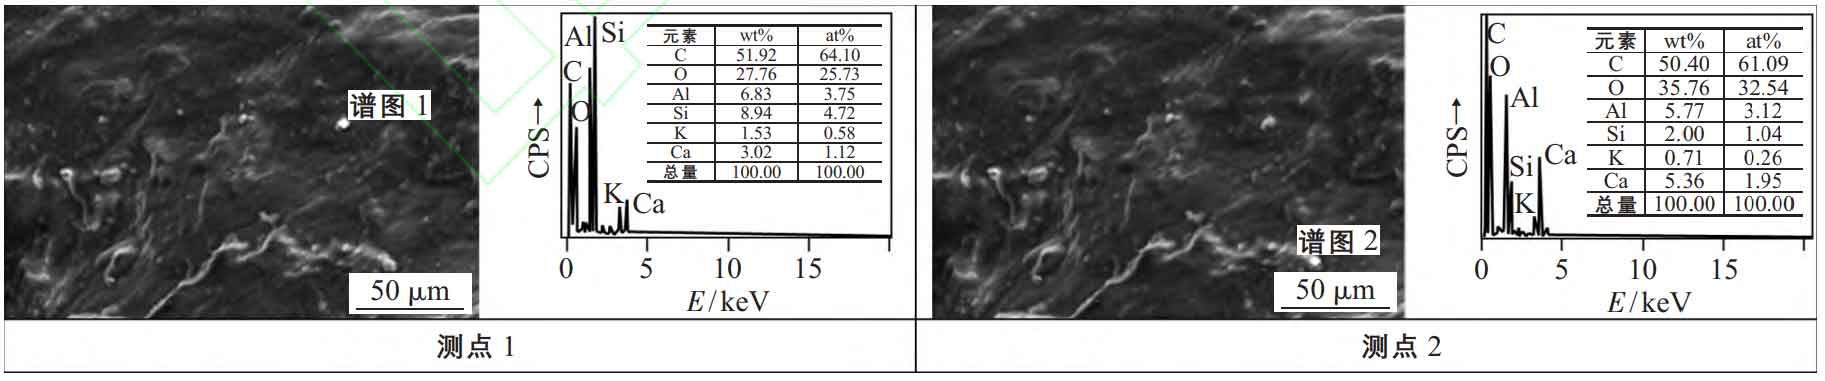
Figure 5 shows the EDS detection and analysis results near the crack source. The EDS composition analysis of typical inclusion points on the surface shows that the inclusions in the figure all contain alkali metal elements, including K and Ca. K is 0.71wt% ~ 1.53wt%, and Ca is 3.02wt% ~ 5.36wt%.
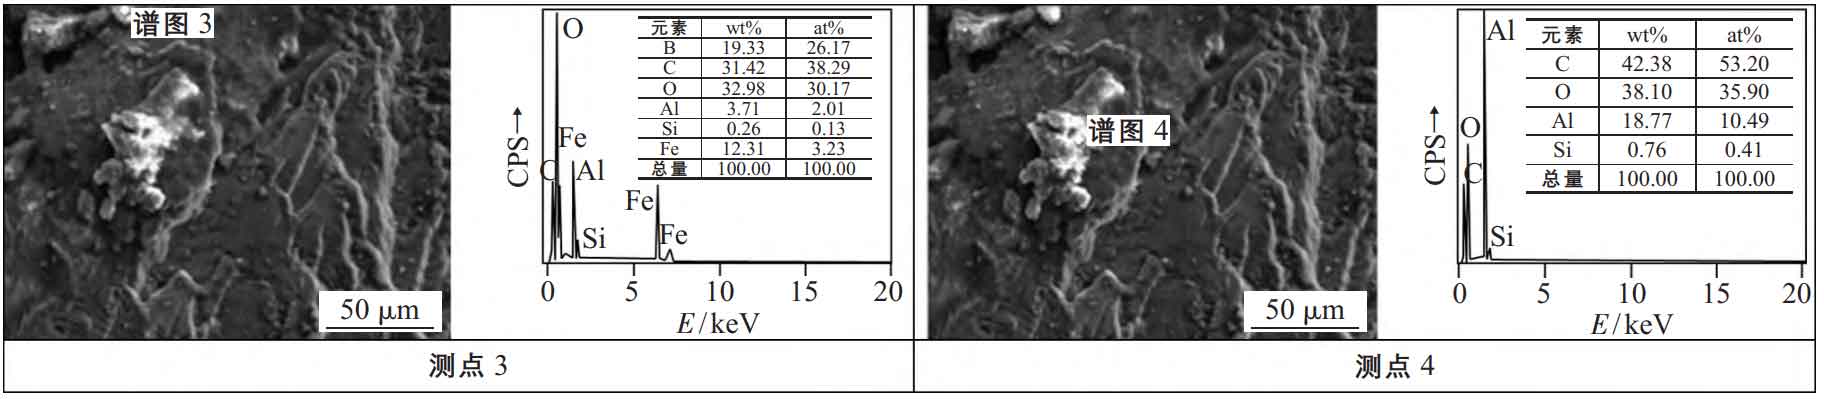
Figure 6 is the EDS analysis result of the crack growth zone. The surface inclusions contain more Si and Fe elements, as well as C and O elements after oxidation.
3. Chemical composition test
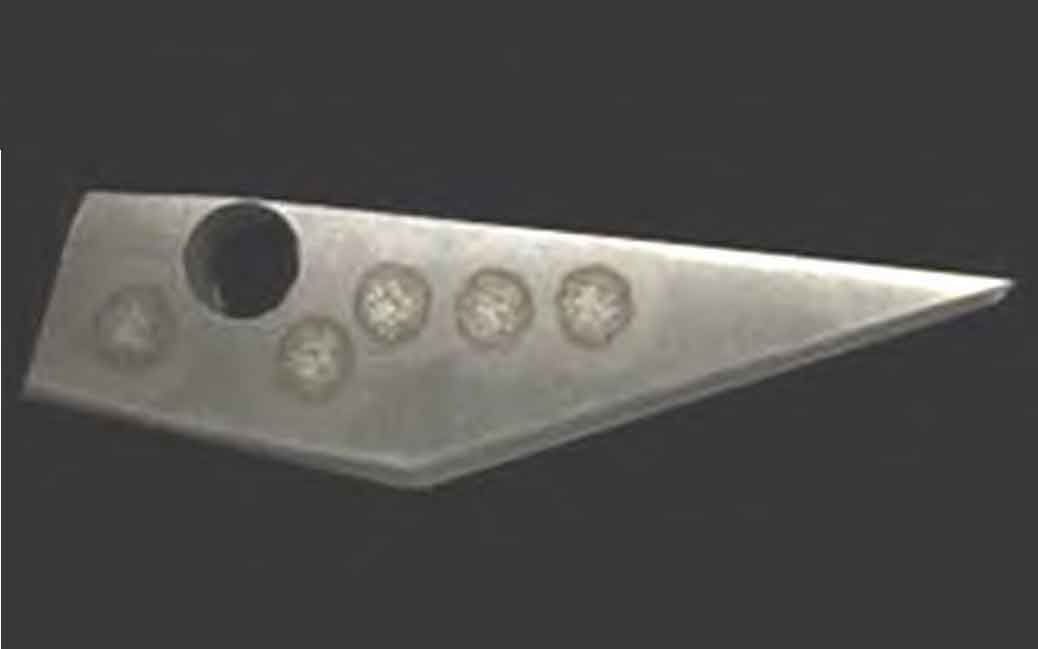
In order to study the difference rule of the chemical composition of the end cover, samples were taken near the crack location of the end cover for analysis. The samples are shown in Figure 6, and the chemical composition test results are shown in Table 1.
| Sampling location | Si | Fe | Cu | Mn | Mg | Zn | Ti |
| 1 | 7.42 | 0.18 | 0.013 | 0.012 | 0.35 | 0.003 | 0.089 |
| 2 | 7.45 | 0.18 | 0.010 | 0.011 | 0.35 | 0.002 | 0.091 |
| 3 | 7.50 | 0.18 | 0.010 | 0.012 | 0.35 | 0.002 | 0.091 |
| 4 | 7.46 | 0.18 | 0.009 | 0.012 | 0.35 | 0.002 | 0.091 |
| 5 | 7.48 | 0.18 | 0.008 | 0.010 | 0.35 | 0.002 | 0.091 |
| Average value | 7.462 | 0.18 | 0.01 | 0.011 | 0.35 | 0.002 | 0.091 |
| EN 1706(AlSi7Mg0.3) | 6.50~ 7.50 | ≤ 0.19 | ≤ 0.05 | ≤ 0.10 | 0.25~ 0.45 | ≤ 0.07 | 0.08~ 0.25 |
4. Hardness test and analysis
Take samples near the crack for Brinell hardness test and analyze the hardness characteristics. See Table 2 for the results.
| Sampling location | Point 1 | Point 2 | Point 3 | Point 4 | Point 5 | Average value |
| Position near crack | 108.8 | 112.2 | 109.5 | 108.5 | 108.6 | 109.5 |
| EN 1706(AlSi7Mg0.3) | ≥90 | ≥90 | ≥90 | ≥90 | ≥90 | ≥90 |
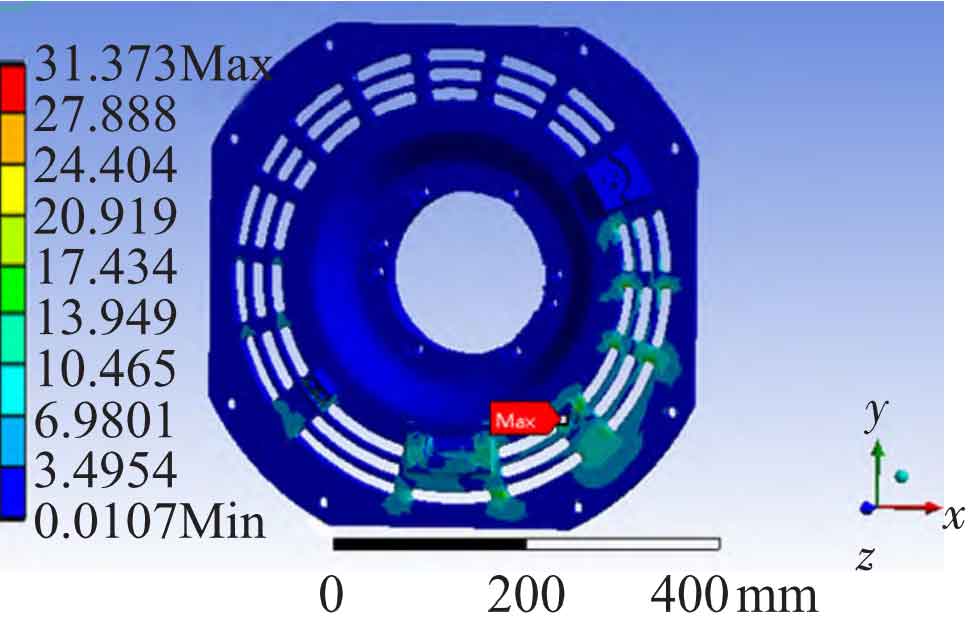
5. Strength simulation analysis
The strength of the structural member is calculated according to the structural member model and relevant technical parameters. See Table 3 for load combination conditions and stress and deformation results under stable operation conditions.
| Load Combination | Vertical load combination condition/(m · s-2) | Combined working condition of transverse load/(m · s-2) | Combined working condition of longitudinal load/(m · s-2) | Maximum stress/MPa | Total deformation/mm | Safety factor |
| 1 | 42.5 | 37 | 20 | 22.889 | 0.063 | 6.42 |
| 2 | 42.5 | 37 | -20 | 23.704 | 0.067 | 6.20 |
| 3 | 42.5 | -37 | 20 | 22.898 | 0.066 | 6.42 |
| 4 | 42.5 | -37 | -20 | 31.373 | 0.064 | 4.68 |
| 5 | -42.5 | 37 | 20 | 25.308 | 0.048 | 5.81 |
| 6 | -42.5 | 37 | -20 | 16.835 | 0.052 | 8.73 |
| 7 | -42.5 | -37 | 20 | 21.105 | 0.057 | 6.97 |
| 8 | -42.5 | -37 | -20 | 16.835 | 0.052 | 8.73 |
According to the strength simulation analysis of cast aluminum structural members under different load combinations, the stress of load combination 4 is the maximum, the stress concentration is at the groove of the structural member, the maximum stress is 31.373MPa, and the safety factor is only 4.68, as shown in Figure 7.