
Thin-walled superalloy components are increasingly demanded in aerospace engines because they reduce weight while maintaining high-temperature strength and oxidation resistance. However, manufacturing complex thin-walled parts such as swirlers remains difficult due to misruns, shrinkage porosity, and hot tearing. In this work, I studied the investment casting process of a K4648 nickel-based superalloy swirler with three thin rings and twelve blades, where the minimum wall thickness is only 1.25 mm. I combined thermodynamic calculations, numerical simulation, and experimental validation to optimize the gating system and casting parameters. I also investigated how secondary solution treatment affects the microstructure and mechanical properties. Although lost foam castings offer advantages for certain complex geometries, the high precision and surface finish required for this swirler made investment casting the preferred route. The simulation framework I developed can also be adapted to lost foam castings if the pattern degradation and gas evolution are properly modeled.
The K4648 alloy contains a high chromium content, which improves corrosion resistance but also promotes the formation of brittle α-Cr phases and M23C6 carbides. These microstructural features can reduce ductility and toughness. Therefore, I examined both the casting process and post-casting heat treatment to achieve a balance between strength and ductility. I used ProCAST 2016 for filling and solidification simulation, and I validated the predictions with trial production, dimensional inspection, fluorescent penetrant testing, X-ray radiography, and metallographic analysis. The results show that a well-designed gating system combined with optimized pouring parameters can eliminate major defects. Furthermore, a secondary solution treatment at 1200 °C followed by aging significantly increases tensile strength while only slightly reducing elongation.
In the following sections, I first describe the alloy composition and thermophysical properties. Then I present the mathematical models for fluid flow, heat transfer, shrinkage prediction, and hot tearing. Next, I discuss the initial gating system design, its simulated defects, and the optimized design. I then analyze the effects of pouring temperature and shell preheating temperature on shrinkage and hot tearing. After that, I report the trial production and quality inspection results. Finally, I evaluate the influence of secondary solution treatment on microstructure, hardness, tensile properties, and fracture behavior. The key process parameters and results are summarized in tables and equations throughout the text.
For example, lost foam castings are widely used for complex geometries, but they face challenges with thin walls and surface finish. A typical lost foam casting component is shown below. In contrast, investment casting provides superior dimensional accuracy and surface quality for thin-walled superalloy parts.
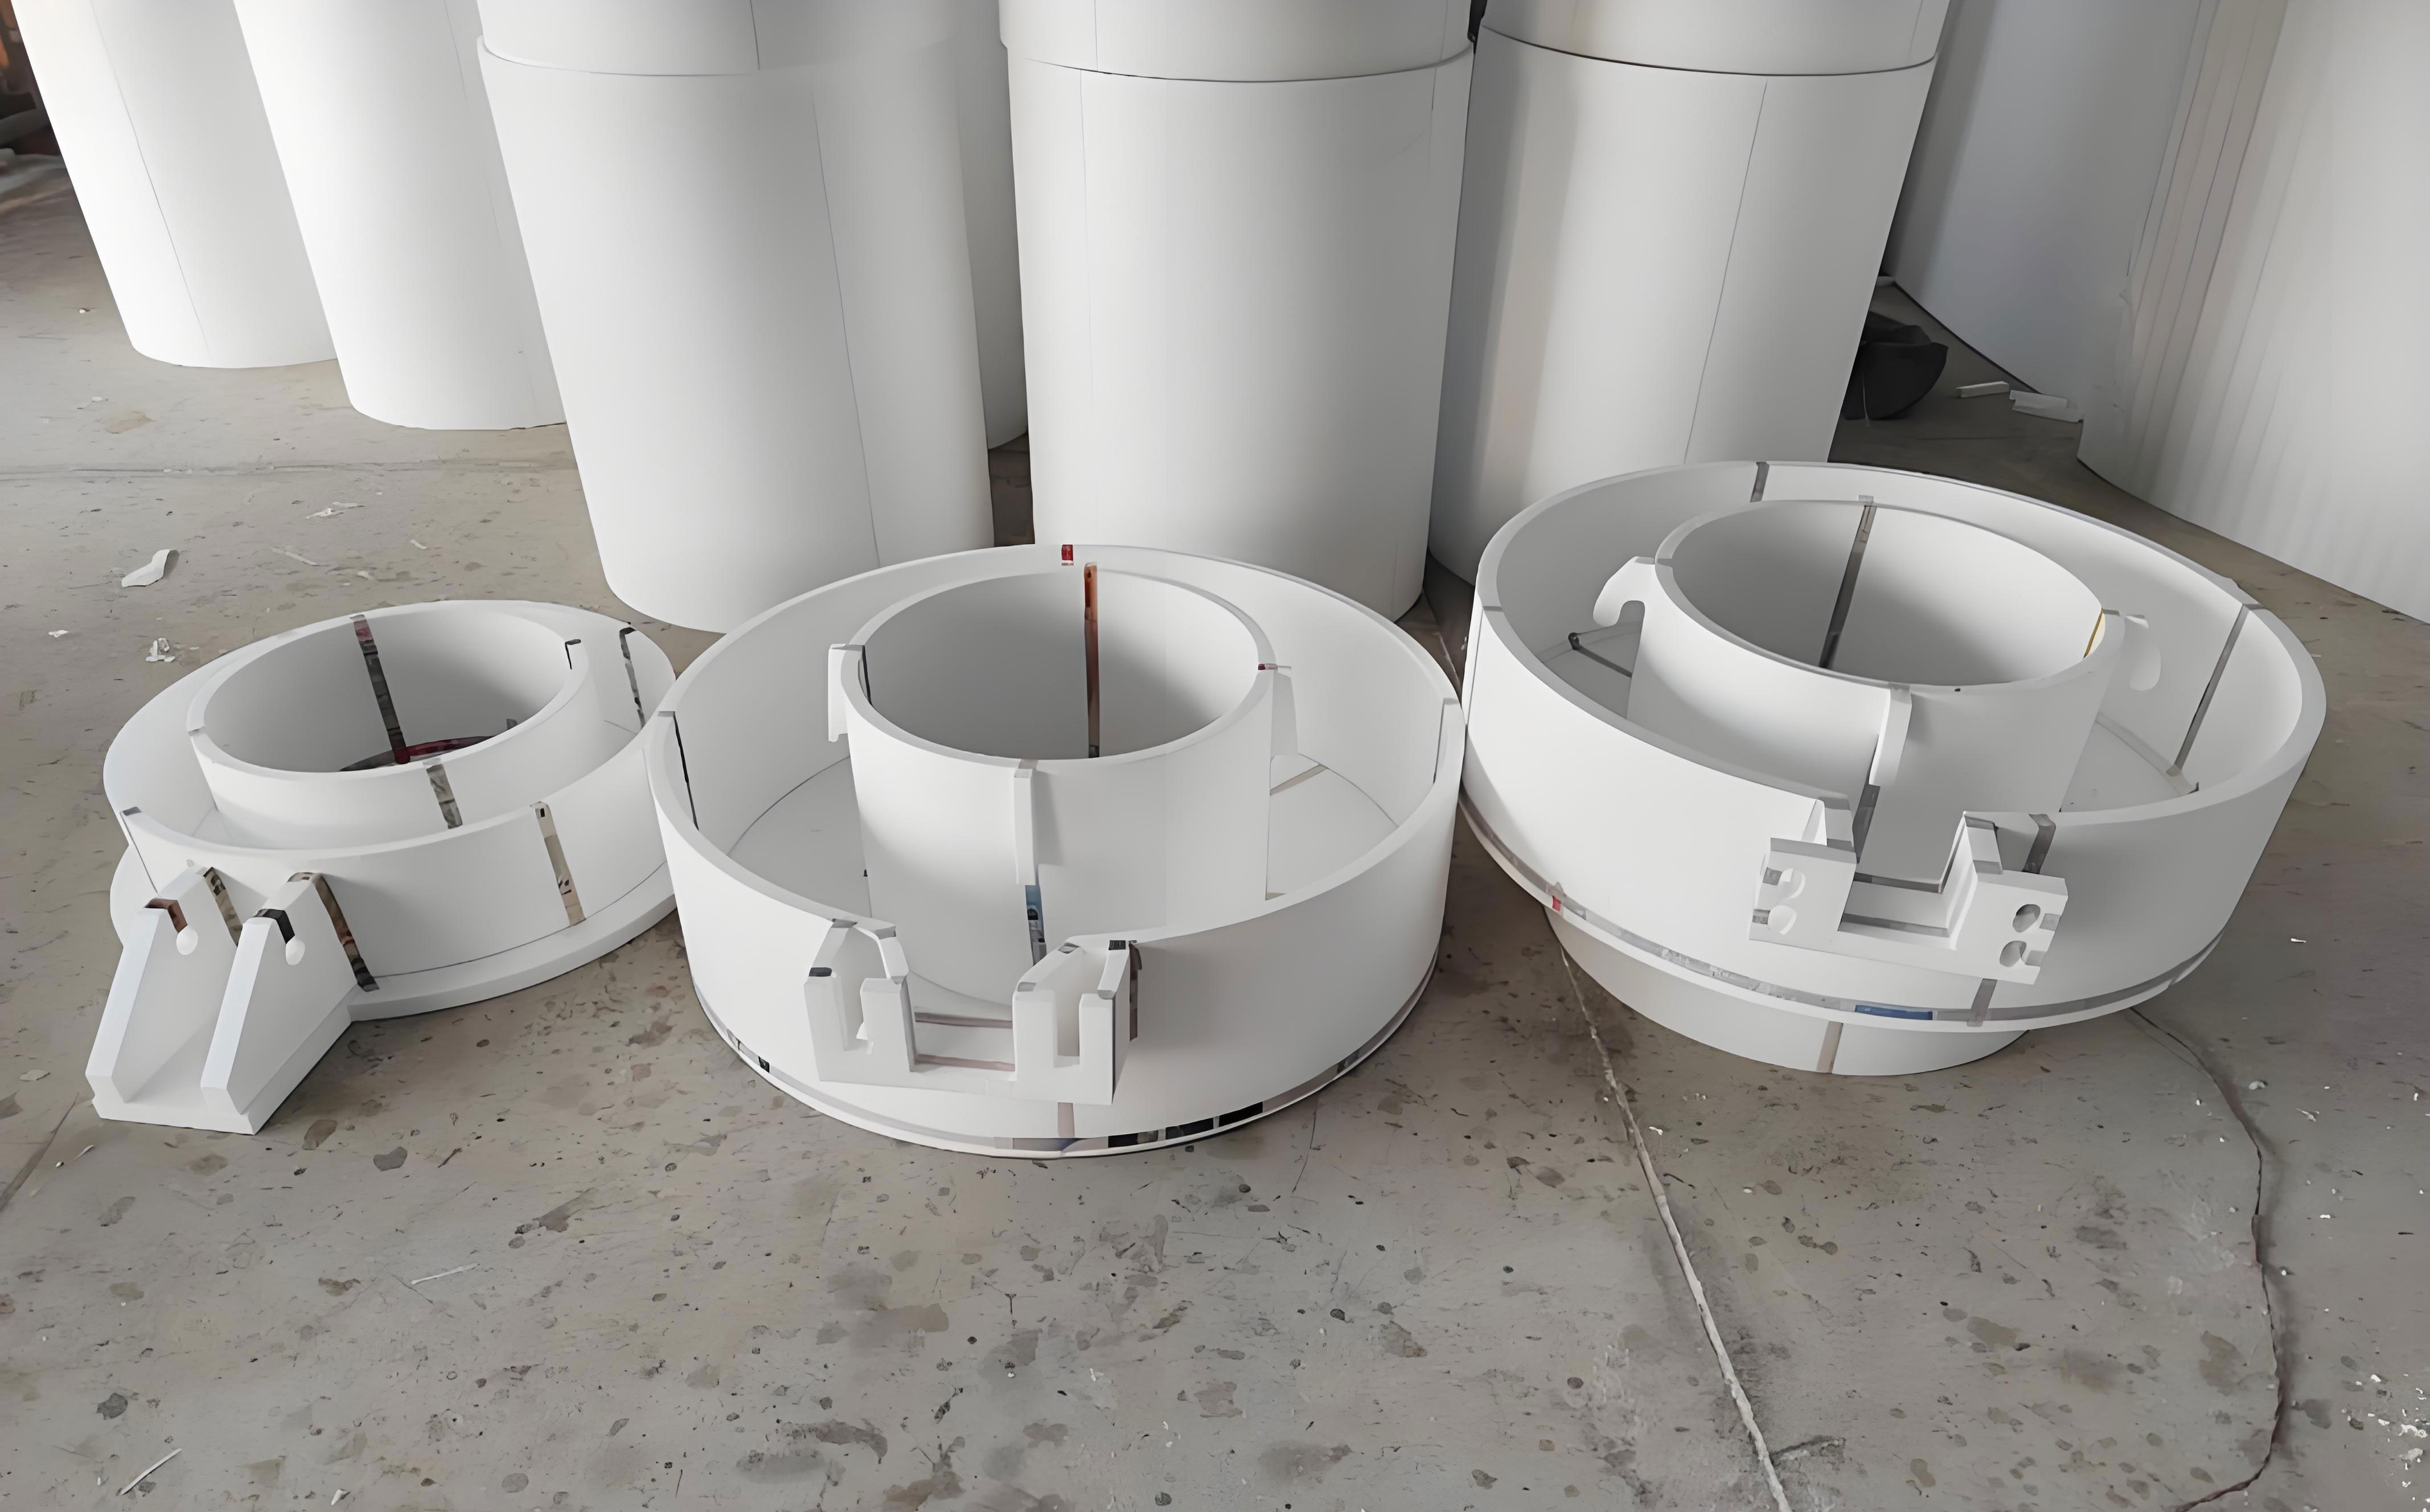
Despite the advantages of investment casting, the process involves many steps and is sensitive to parameter variations. Therefore, numerical simulation is essential to predict defects and reduce trial-and-error costs. I used a combination of thermodynamic calculation and finite element simulation to guide the process design.
Alloy Composition and Thermophysical Properties
I first established a material database for K4648 alloy. The chemical composition is given in Table 1. The alloy is a solid-solution-strengthened nickel-based superalloy with about 33.66 wt.% Cr, 4.86 wt.% W, 2.90 wt.% Mo, and small amounts of Al, Nb, Ti, C, B, Ce, S, and Y. The high Cr content promotes the formation of primary α-Cr phase and M23C6 carbides, which are hard and brittle. These phases can affect both castability and final mechanical properties.
| Ni | Cr | W | Mo | Al | Nb | Ti | C | B | Ce | S | Y |
|---|---|---|---|---|---|---|---|---|---|---|---|
| Bal. | 33.66 | 4.86 | 2.90 | 0.94 | 0.90 | 0.92 | 0.067 | ≤0.008 | ≤0.03 | ≤0.01 | ≤0.04 |
I used JMatPro to calculate the phase constitution as a function of temperature. The solidus temperature is about 1261 °C, and the liquidus temperature is about 1340 °C. The freezing range is therefore about 179 °C, which is relatively wide and increases the risk of shrinkage porosity. I also compared the calculated thermophysical properties with those from ProCAST and with handbook data. After iterative adjustment, I obtained a consistent set of properties for simulation. Table 2 lists the main simulation parameters.
| Parameter | Value |
|---|---|
| Alloy | K4648 |
| Pouring temperature | 1480 °C |
| Pouring time | 3 s |
| Shell preheating temperature | 1180 °C |
| Shell thickness | 7 mm |
| Interface heat transfer coefficient | 750 W/m²·K |
| Gravity direction | +Z |
| Mold material | Mullite |
Mathematical Models for Filling and Solidification
I modeled the filling and solidification processes using the finite element method. The governing equations include continuity, momentum, and energy conservation. The continuity equation for incompressible flow is:
$$ \frac{\partial u}{\partial x} + \frac{\partial v}{\partial y} + \frac{\partial w}{\partial z} = 0 $$
where u, v, and w are the velocity components in the x, y, and z directions, respectively. The momentum conservation equations in the three directions are:
$$ \rho \left( \frac{\partial u}{\partial t} + u \frac{\partial u}{\partial x} + v \frac{\partial u}{\partial y} + w \frac{\partial u}{\partial z} \right) = -\frac{\partial P}{\partial x} + \rho g_x + \mu \nabla^2 u $$
$$ \rho \left( \frac{\partial v}{\partial t} + u \frac{\partial v}{\partial x} + v \frac{\partial v}{\partial y} + w \frac{\partial v}{\partial z} \right) = -\frac{\partial P}{\partial y} + \rho g_y + \mu \nabla^2 v $$
$$ \rho \left( \frac{\partial w}{\partial t} + u \frac{\partial w}{\partial x} + v \frac{\partial w}{\partial y} + w \frac{\partial w}{\partial z} \right) = -\frac{\partial P}{\partial z} + \rho g_z + \mu \nabla^2 w $$
Here, ρ is density, P is pressure, g is gravitational acceleration, and μ is dynamic viscosity. The energy equation, which accounts for heat conduction, convection, and latent heat, is written as:
$$ \rho c_p \left( \frac{\partial T}{\partial t} + u \frac{\partial T}{\partial x} + v \frac{\partial T}{\partial y} + w \frac{\partial T}{\partial z} \right) = \lambda \left( \frac{\partial^2 T}{\partial x^2} + \frac{\partial^2 T}{\partial y^2} + \frac{\partial^2 T}{\partial z^2} \right) + Q $$
where cp is specific heat capacity, λ is thermal conductivity, and Q is the latent heat source term. For solidification, I used the Niyama criterion to predict shrinkage porosity. The criterion is:
$$ \frac{G}{\sqrt{R}} \le M $$
where G is the local temperature gradient, R is the cooling rate, and M is a critical value that depends on the alloy. The temperature gradient and cooling rate are calculated as:
$$ G = \sqrt{ \left( \frac{\partial T}{\partial x} \right)^2 + \left( \frac{\partial T}{\partial y} \right)^2 + \left( \frac{\partial T}{\partial z} \right)^2 } $$
$$ R = \left| \frac{T_{\text{upper}} – T_{\text{lower}}}{t_{\text{upper}} – t_{\text{lower}}} \right| $$
For hot tearing prediction, I used the hot tearing indicator (HTI) based on the stress-driven model in ProCAST. The HTI value increases with the likelihood of hot crack formation. I focused on a critical region A, which is the junction between the inner ring wall and the middle blades. This region has a complex geometry and is prone to stress concentration.
Initial Gating System Design and Simulation
I designed an initial top-pouring gating system with four straight runners, a ring-shaped cross runner, and four internal gates connected to the middle ring wall. The swirler has three thin rings, and the middle ring is the thinnest, so I placed the internal gates on the middle ring to promote rapid filling. The pouring temperature was set to 1480 °C, the pouring time to 3 s, and the shell preheating temperature to 1180 °C. The mesh was generated with a fine size of 1 mm on the casting and 1.5 mm on the gating system. The shell thickness was 7 mm.
The filling simulation showed that the metal flowed smoothly through the runners and gates, but the filling process was not perfectly balanced. Some turbulence occurred in the cross runner, although it did not directly affect the casting. The solidification simulation showed that the outer ring solidified first, followed by the middle and inner rings. The final solidification occurred at the junction between the casting and the internal gates. However, the shrinkage porosity volume was 0.278 cc, and the hot tearing indicator in region A reached 0.0056. These values indicated that the initial design was not sufficient to produce a defect-free casting.
I analyzed the temperature field at the shrinkage location. The outer ring was at about 1200 °C and in a mushy state, while the inner ring and blades were at about 1382 °C and still liquid. This large temperature difference created an isolated liquid region, which led to shrinkage porosity. The hot tearing tendency was also high in region A because of the thermal stress caused by uneven cooling.
| Defect type | Location | Magnitude |
|---|---|---|
| Shrinkage porosity | Middle ring wall | 0.278 cc |
| Hot tearing indicator (HTI) | Region A (inner ring/blade junction) | 0.0056 |
| Filling time | Full casting | 3 s |
| Total solidification time | Entire assembly | 2537 s |
Optimization of the Gating System
To reduce shrinkage and hot tearing, I modified the gating system. I removed the ring-shaped cross runner and replaced it with six straight runners. Each runner connected to two castings through symmetric internal gates. I added two additional internal gates on the outer ring wall to improve feeding. The new design allowed the molten alloy to enter the casting from both the middle and outer ring walls simultaneously. This reduced the temperature gradient and provided better feeding during solidification. The optimized gating system is shown schematically in the simulation results.
The filling simulation of the optimized system showed a stable and smooth flow. The metal filled the middle ring first, then the inner and outer rings. No significant turbulence or splashing was observed. At 0.76 s, the metal entered the cross runner; at 0.98 s, it rose smoothly in the casting; and at 1.14 s, the casting was almost completely filled. The total filling time was about 2.9 s. The solidification sequence was also improved. The outer ring solidified first, followed by the inner and middle rings. The junction between the casting and the internal gates solidified last, but because the gates provided sufficient feeding, the shrinkage porosity was greatly reduced.
The shrinkage porosity prediction for the optimized gating system showed only a few scattered defects, and the total volume decreased significantly compared with the initial design. The hot tearing indicator in region A also decreased. These improvements confirmed that the modified gating system was more effective in delivering molten metal and compensating for solidification shrinkage.
| Feature | Initial design | Optimized design |
|---|---|---|
| Number of straight runners | 4 | 6 |
| Cross runner | Ring-shaped | Removed |
| Internal gates | 4 on middle ring | 6 on middle ring + 2 on outer ring |
| Shrinkage volume (cc) | 0.278 | 0.004 (after parameter optimization) |
| HTI in region A | 0.0056 | 0.0041 (after parameter optimization) |
Effect of Pouring Temperature on Shrinkage and Hot Tearing
I investigated the effect of pouring temperature on shrinkage porosity and hot tearing while keeping the pouring time at 3 s and the shell preheating temperature at 1180 °C. I tested four pouring temperatures: 1480, 1510, 1540, and 1570 °C. The results are summarized in Table 5. As the pouring temperature increased from 1480 to 1540 °C, the shrinkage volume decreased dramatically from 0.0747 to 0.0043 cc, a reduction of about 94.2%. However, when the pouring temperature was further increased to 1570 °C, the shrinkage volume increased slightly to 0.0082 cc. This indicates that an excessively high pouring temperature can increase the risk of shrinkage due to increased liquid contraction and delayed solidification.
The hot tearing indicator in region A showed a different trend. The HTI value increased from 0.0048 at 1480 °C to 0.0055 at 1510 °C, then decreased to 0.0041 at 1540 °C, and finally increased to 0.0065 at 1570 °C. The lowest HTI was obtained at 1540 °C. Therefore, 1540 °C appears to be the optimal pouring temperature for minimizing both shrinkage and hot tearing.
| Pouring temperature (°C) | Shrinkage volume (cc) | HTI in region A |
|---|---|---|
| 1480 | 0.0747 | 0.0048 |
| 1510 | 0.0295 | 0.0055 |
| 1540 | 0.0043 | 0.0041 |
| 1570 | 0.0082 | 0.0065 |
Effect of Shell Preheating Temperature on Shrinkage and Hot Tearing
I also studied the effect of shell preheating temperature while keeping the pouring temperature at 1480 °C and the pouring time at 3 s. Four preheating temperatures were tested: 1150, 1180, 1210, and 1240 °C. The results are shown in Table 6. When the shell preheating temperature was 1150 °C, the shrinkage volume was 0.1300 cc. As the temperature increased to 1180 °C, the shrinkage volume decreased to 0.0747 cc. A dramatic reduction occurred when the shell preheating temperature reached 1210 °C: the shrinkage volume dropped to only 0.0002 cc, which is a 99.8% reduction compared with 1150 °C. When the temperature was further increased to 1240 °C, the shrinkage volume increased slightly to 0.0004 cc. This suggests that a high shell preheating temperature improves feeding by slowing the cooling rate, but an excessively high temperature may cause other issues such as grain coarsening.
The hot tearing indicator in region A remained relatively stable across the tested shell preheating temperatures. The HTI values were in the range of 0.0040 to 0.0046, indicating that shell preheating temperature has a minor effect on hot tearing compared with pouring temperature.
| Shell preheating temperature (°C) | Shrinkage volume (cc) | HTI in region A |
|---|---|---|
| 1150 | 0.1300 | 0.0045 |
| 1180 | 0.0747 | 0.0046 |
| 1210 | 0.0002 | 0.0040 |
| 1240 | 0.0004 | 0.0041 |
Combined Optimization of Process Parameters
Based on the single-factor experiments, I selected two pouring temperatures (1540 and 1570 °C) and two shell preheating temperatures (1210 and 1240 °C) for a combined optimization. The pouring time was fixed at 3 s. Four simulation runs were performed, and the results are shown in Table 7. The best combination was pouring temperature = 1540 °C and shell preheating temperature = 1210 °C. Under these conditions, the shrinkage volume was only 0.0002 cc, and the HTI in region A was 0.0047. The other combinations resulted in larger shrinkage volumes and slightly higher HTI values. Therefore, I selected pouring temperature 1540 °C, pouring time 3 s, and shell preheating temperature 1210 °C as the optimal process parameters for trial production.
| Pouring temperature (°C) | Shell preheating temperature (°C) | Shrinkage volume (cc) | HTI in region A |
|---|---|---|---|
| 1540 | 1210 | 0.0002 | 0.0047 |
| 1540 | 1240 | 0.0028 | 0.0048 |
| 1570 | 1210 | 0.0088 | 0.0047 |
| 1570 | 1240 | 0.0176 | 0.0049 |
Trial Production and Quality Inspection
Using the optimized gating system and process parameters, I produced a batch of swirler castings. I then performed a series of inspections to evaluate the casting quality. First, visual examination showed that the surface was smooth, with no signs of misrun, sand adhesion, or swelling. The casting contours were clear, and no burrs were present. Second, I measured the critical dimensions using a coordinate measuring machine and a vernier caliper. The results are shown in Table 8. All dimensions were within the required tolerances, confirming good dimensional stability.
| Dimension description | Required size (mm) | Max deviation measured | Inspected parts | Result |
|---|---|---|---|---|
| Outer ring outer diameter | ∅37 +0.5 | ∅37.1 | 5 | Qualified |
| Outer ring inner diameter | ∅34 +0.5 | ∅34.2 | 5 | Qualified |
| Inner ring outer diameter | ∅20 +0.5 | ∅20.0 | 5 | Qualified |
| Inner ring inner diameter | ∅17 +0.5 | ∅17.1 | 5 | Qualified |
| Tail casting draft angle | 70° ±30′ | 70°08′ | 5 | Qualified |
| Tail outlet diameter | ∅6.6 | ∅6.6 | 5 | Qualified |
| Tail outlet wall thickness | 2 | 2 | 5 | Qualified |
Third, I used fluorescent penetrant inspection to detect surface cracks. The casting surface was cleaned, coated with fluorescent penetrant, and then examined under ultraviolet light. No clustered defects or linear defects were found. The maximum allowable defect size for this component is 0.3 mm, and all observed indications were below this limit. Fourth, I sectioned several blades and examined them under an optical microscope. No micro-shrinkage was observed. Finally, I performed X-ray radiography on the entire casting. The inspection parameters are listed in Table 9. The X-ray images showed no shrinkage, inclusions, or cracks. These results were consistent with the simulation predictions, validating the accuracy of the ProCAST model and the effectiveness of the optimized process.
| Equipment | Film type | Exposure time | Focal distance | Voltage | Current |
|---|---|---|---|---|---|
| XYD3010 | N-Ⅲ | 3 min | 1000 mm | 80 kV | 5 mA |
The successful trial production confirmed that the optimized gating system and process parameters can produce high-quality thin-walled K4648 alloy swirlers. The combination of simulation and experimental validation reduced development time and cost. The same approach can be applied to other thin-walled superalloy components, including those produced by lost foam castings after appropriate adaptation of the pattern and coating systems.
Secondary Solution Treatment and Microstructure–Property Regulation
After casting, I investigated the effect of secondary solution treatment on the microstructure and mechanical properties of K4648 alloy. The as-cast microstructure contains primary α-Cr phase, MC carbides, and a γ matrix. The primary α phase is rich in Cr, Ni, W, and Mo, and it appears as blocky or chain-like particles along grain boundaries and interdendritic regions. These hard and brittle phases can reduce ductility. A primary solution treatment at 1180 °C for 4 h followed by aging at 900 °C for 16 h is commonly used. However, because the primary α phase and MC carbides are difficult to fully dissolve, I applied a secondary solution treatment at 1160, 1200, and 1220 °C for 4 h, followed by the same aging treatment. The heat treatment schedules are summarized in Table 10.
| Condition | Primary solution | Secondary solution | Aging |
|---|---|---|---|
| As-cast | — | — | — |
| Primary solution + aging | 1180 °C / 4 h, AC | — | 900 °C / 16 h, AC |
| Secondary solution + aging (1160 °C) | 1180 °C / 4 h, AC | 1160 °C / 4 h, AC | 900 °C / 16 h, AC |
| Secondary solution + aging (1200 °C) | 1180 °C / 4 h, AC | 1200 °C / 4 h, AC | 900 °C / 16 h, AC |
| Secondary solution + aging (1220 °C) | 1180 °C / 4 h, AC | 1220 °C / 4 h, AC | 900 °C / 16 h, AC |
I observed the microstructure using scanning electron microscopy. After primary solution and aging, the alloy contained fine granular γ′ precipitates, blocky M23C6 carbides, and some needle-like α phase. After secondary solution treatment, the needle-like α phase grew larger. At 1160 °C, the average length of the needle-like phase was about 3.5 μm; at 1200 °C, it was about 6 μm; and at 1220 °C, it reached about 18 μm, which is 3 to 6 times larger than at the lower temperatures. The M23C6 carbides became smaller and more numerous, and they were continuously distributed along grain boundaries. The γ′ precipitates were most abundant after the 1200 °C secondary solution treatment. Energy-dispersive X-ray spectroscopy mapping showed that the elements were more uniformly distributed after secondary solution treatment compared with the as-cast state.
The microhardness results are shown in Table 11. The as-cast alloy had an average hardness of 215.9 HV. After primary solution and aging, the hardness increased to 252.8 HV. After secondary solution at 1160 °C and aging, the hardness reached 305.6 HV, which is 41.5% higher than the as-cast condition and 20.9% higher than the primary solution condition. The increase in hardness is attributed to the finer and more numerous M23C6 carbides and the larger needle-like α phase, which provide precipitation strengthening and dispersion strengthening.
| Condition | Average hardness (HV) | Increase relative to as-cast (%) |
|---|---|---|
| As-cast | 215.9 | — |
| Primary solution + aging | 252.8 | 17.1 |
| Secondary solution + aging (1160 °C) | 305.6 | 41.5 |
I also performed room-temperature tensile tests. The stress–strain curves showed that secondary solution treatment significantly increased tensile strength but slightly reduced elongation. The primary solution and aging condition gave a tensile strength of 583 MPa and an elongation of 17.2%. After secondary solution at 1200 °C and aging, the tensile strength increased to 810 MPa, which is about 38% higher, while elongation decreased to 15.3%. The 1200 °C condition gave the best combination of strength and ductility. At 1160 °C, the strength was lower than at 1200 °C, and at 1220 °C, the strength decreased again, probably due to the formation of micropores and larger brittle phases. The tensile properties are summarized in Table 12.
| Condition | Tensile strength (MPa) | Elongation (%) |
|---|---|---|
| Primary solution + aging | 583 | 17.2 |
| Secondary solution + aging (1200 °C) | 810 | 15.3 |
Fracture analysis revealed that the primary solution and aging samples exhibited a mixed ductile–brittle fracture mode with fine dimples and some smooth facets. After secondary solution treatment, the fracture surfaces showed more secondary cracks and blocky M23C6 carbides along grain boundaries. The continuous distribution of M23C6 carbides can effectively hinder grain boundary sliding and increase strength, but it also weakens the grain boundaries, leading to reduced ductility. In addition, at the highest secondary solution temperature (1220 °C), numerous micropores formed inside the grains due to the Kirkendall effect. These micropores acted as initiation sites for microcracks, which propagated and linked together, causing final fracture and reducing tensile strength. Therefore, the optimal secondary solution temperature is 1200 °C, which provides the best balance between strength and ductility.
I also calculated the strengthening contribution from the carbides and the α phase using the following approximate relationship:
$$ \Delta \sigma = \Delta \sigma_{\text{precip}} + \Delta \sigma_{\text{disp}} + \Delta \sigma_{\text{gb}} $$
where Δσprecip is precipitation strengthening, Δσdisp is dispersion strengthening from the α phase, and Δσgb is grain boundary strengthening from the continuous carbides. The increase in tensile strength from 583 to 810 MPa corresponds to an increase of 227 MPa, which is consistent with the microstructural changes observed. The slight decrease in elongation from 17.2% to 15.3% is a result of the increased brittleness of the grain boundaries and the presence of micropores.
Summary of Key Findings
I summarize the main conclusions of this work as follows. First, the initial gating system produced significant shrinkage porosity (0.278 cc) and a high hot tearing indicator (0.0056) in the critical region A. By redesigning the gating system with six straight runners and symmetric internal gates on both middle and outer rings, I reduced the shrinkage volume to 0.004 cc and the HTI to 0.0041. Second, the pouring temperature and shell preheating temperature have strong effects on shrinkage and hot tearing. The optimal pouring temperature is 1540 °C, the optimal pouring time is 3 s, and the optimal shell preheating temperature is 1210 °C. Under these conditions, the shrinkage volume is only 0.0002 cc. Third, trial production and quality inspection confirmed that the optimized process produces defect-free castings with accurate dimensions, smooth surfaces, and no internal shrinkage or cracks. Fourth, secondary solution treatment at 1200 °C followed by aging increases the tensile strength from 583 to 810 MPa (a 38% increase) while only slightly reducing elongation from 17.2% to 15.3%. The optimal microstructure contains fine, continuous M23C6 carbides, a moderate amount of needle-like α phase, and a uniform distribution of γ′ precipitates. Higher secondary solution temperatures cause micropore formation and larger brittle phases, which degrade mechanical properties.
The methodology I developed integrates thermodynamic calculation, numerical simulation, and experimental validation. It can be applied to other thin-walled superalloy castings, including those produced by lost foam castings, although the pattern and coating systems would need to be adjusted. The results provide a practical guide for improving yield and performance in precision casting of complex thin-walled components.
In future work, I plan to extend the simulation to include stress evolution during solidification and to optimize the heat treatment schedule further. I also intend to explore the use of lost foam castings for similar components, where the absence of a wax pattern could reduce cost and lead time. However, the surface finish and dimensional accuracy of lost foam castings would need to be carefully controlled to meet aerospace requirements. The combination of advanced simulation and post-casting heat treatment offers a promising route for manufacturing high-performance superalloy components.