
In my work with thin-wall shell castings, I have found that lost foam casting provides a compact and highly integrated route from a foam pattern to a finished metal component. The oil pan I studied is the lower half of a crankcase, often called the lower crankcase. Its function is to store lubricating oil, collect oil that returns from the engine under gravity when the engine stops, and act as a sealed oil reservoir when the engine is running. During operation, the oil pump sends oil to the lubricated parts, while most of the oil remains in the oil pan. The oil pan must keep contaminants out, collect and store lubricant returning from friction surfaces, dissipate part of the heat, and reduce oil oxidation. Because the part is a thin-wall shell with a large open face, lost foam casting is attractive, but it also creates serious challenges in dimensional stability, sand penetration, dross, cold shut, shrinkage porosity, and metallographic control.
The material I used was HT250 gray cast iron. The wall thickness ranged from 6 mm to 30 mm, and the overall envelope size was approximately 601.5 mm × 32 mm × 163 mm. The machining allowance on the main mounting face was 3 mm, while the connecting plate mounting face and the boss face each required 2.5 mm. These requirements meant that the lost foam casting pattern had to include not only the casting geometry but also a carefully controlled allowance for machining, shrinkage, and distortion. In my first-person practice, I treated the oil pan as a system problem: pattern making, coating, sand filling, melting, pouring, and metallurgical control all had to be balanced together.
The basic allowance equation I used for pattern dimensions was:
$$L_p = L_c + A_m + A_s + A_d$$
where Lp is the pattern dimension, Lc is the finished casting dimension, Am is the machining allowance, As is the shrinkage allowance, and Ad is the distortion allowance. For a thin-wall oil pan produced by lost foam casting, Ad is not a constant. It depends on foam density, drying history, coating thickness, sand compaction, negative pressure, and pouring temperature. I therefore measured and corrected the pattern after each major step rather than relying only on a nominal shrinkage value.
| Item | Value or requirement |
|---|---|
| Material | HT250 gray cast iron |
| Wall thickness | 6-30 mm |
| Envelope size | 601.5 mm × 32 mm × 163 mm |
| Main mounting face allowance | 3 mm |
| Connecting plate mounting face allowance | 2.5 mm |
| Boss face allowance | 2.5 mm |
| Primary service function | Store oil, return oil, dissipate heat, prevent oxidation |
| Primary manufacturing route | Lost foam casting |
I selected lost foam casting because conventional sand casting had high tooling cost, significant environmental burden, and excessive cleaning work. Lost foam casting offered a smaller machining allowance, near-net shape, fewer process steps, shorter lead time, higher productivity, and lower labor intensity. However, the same process that simplified the route also made the oil pan sensitive to defects that accumulate across the entire chain. A small error in foam molding, gluing, coating, drying, vibration, or pouring can become a large defect in the final casting. In my trials, the main defects were deformation, metal penetration, dross, cold shut, shrinkage porosity, and substandard metallographic structure.
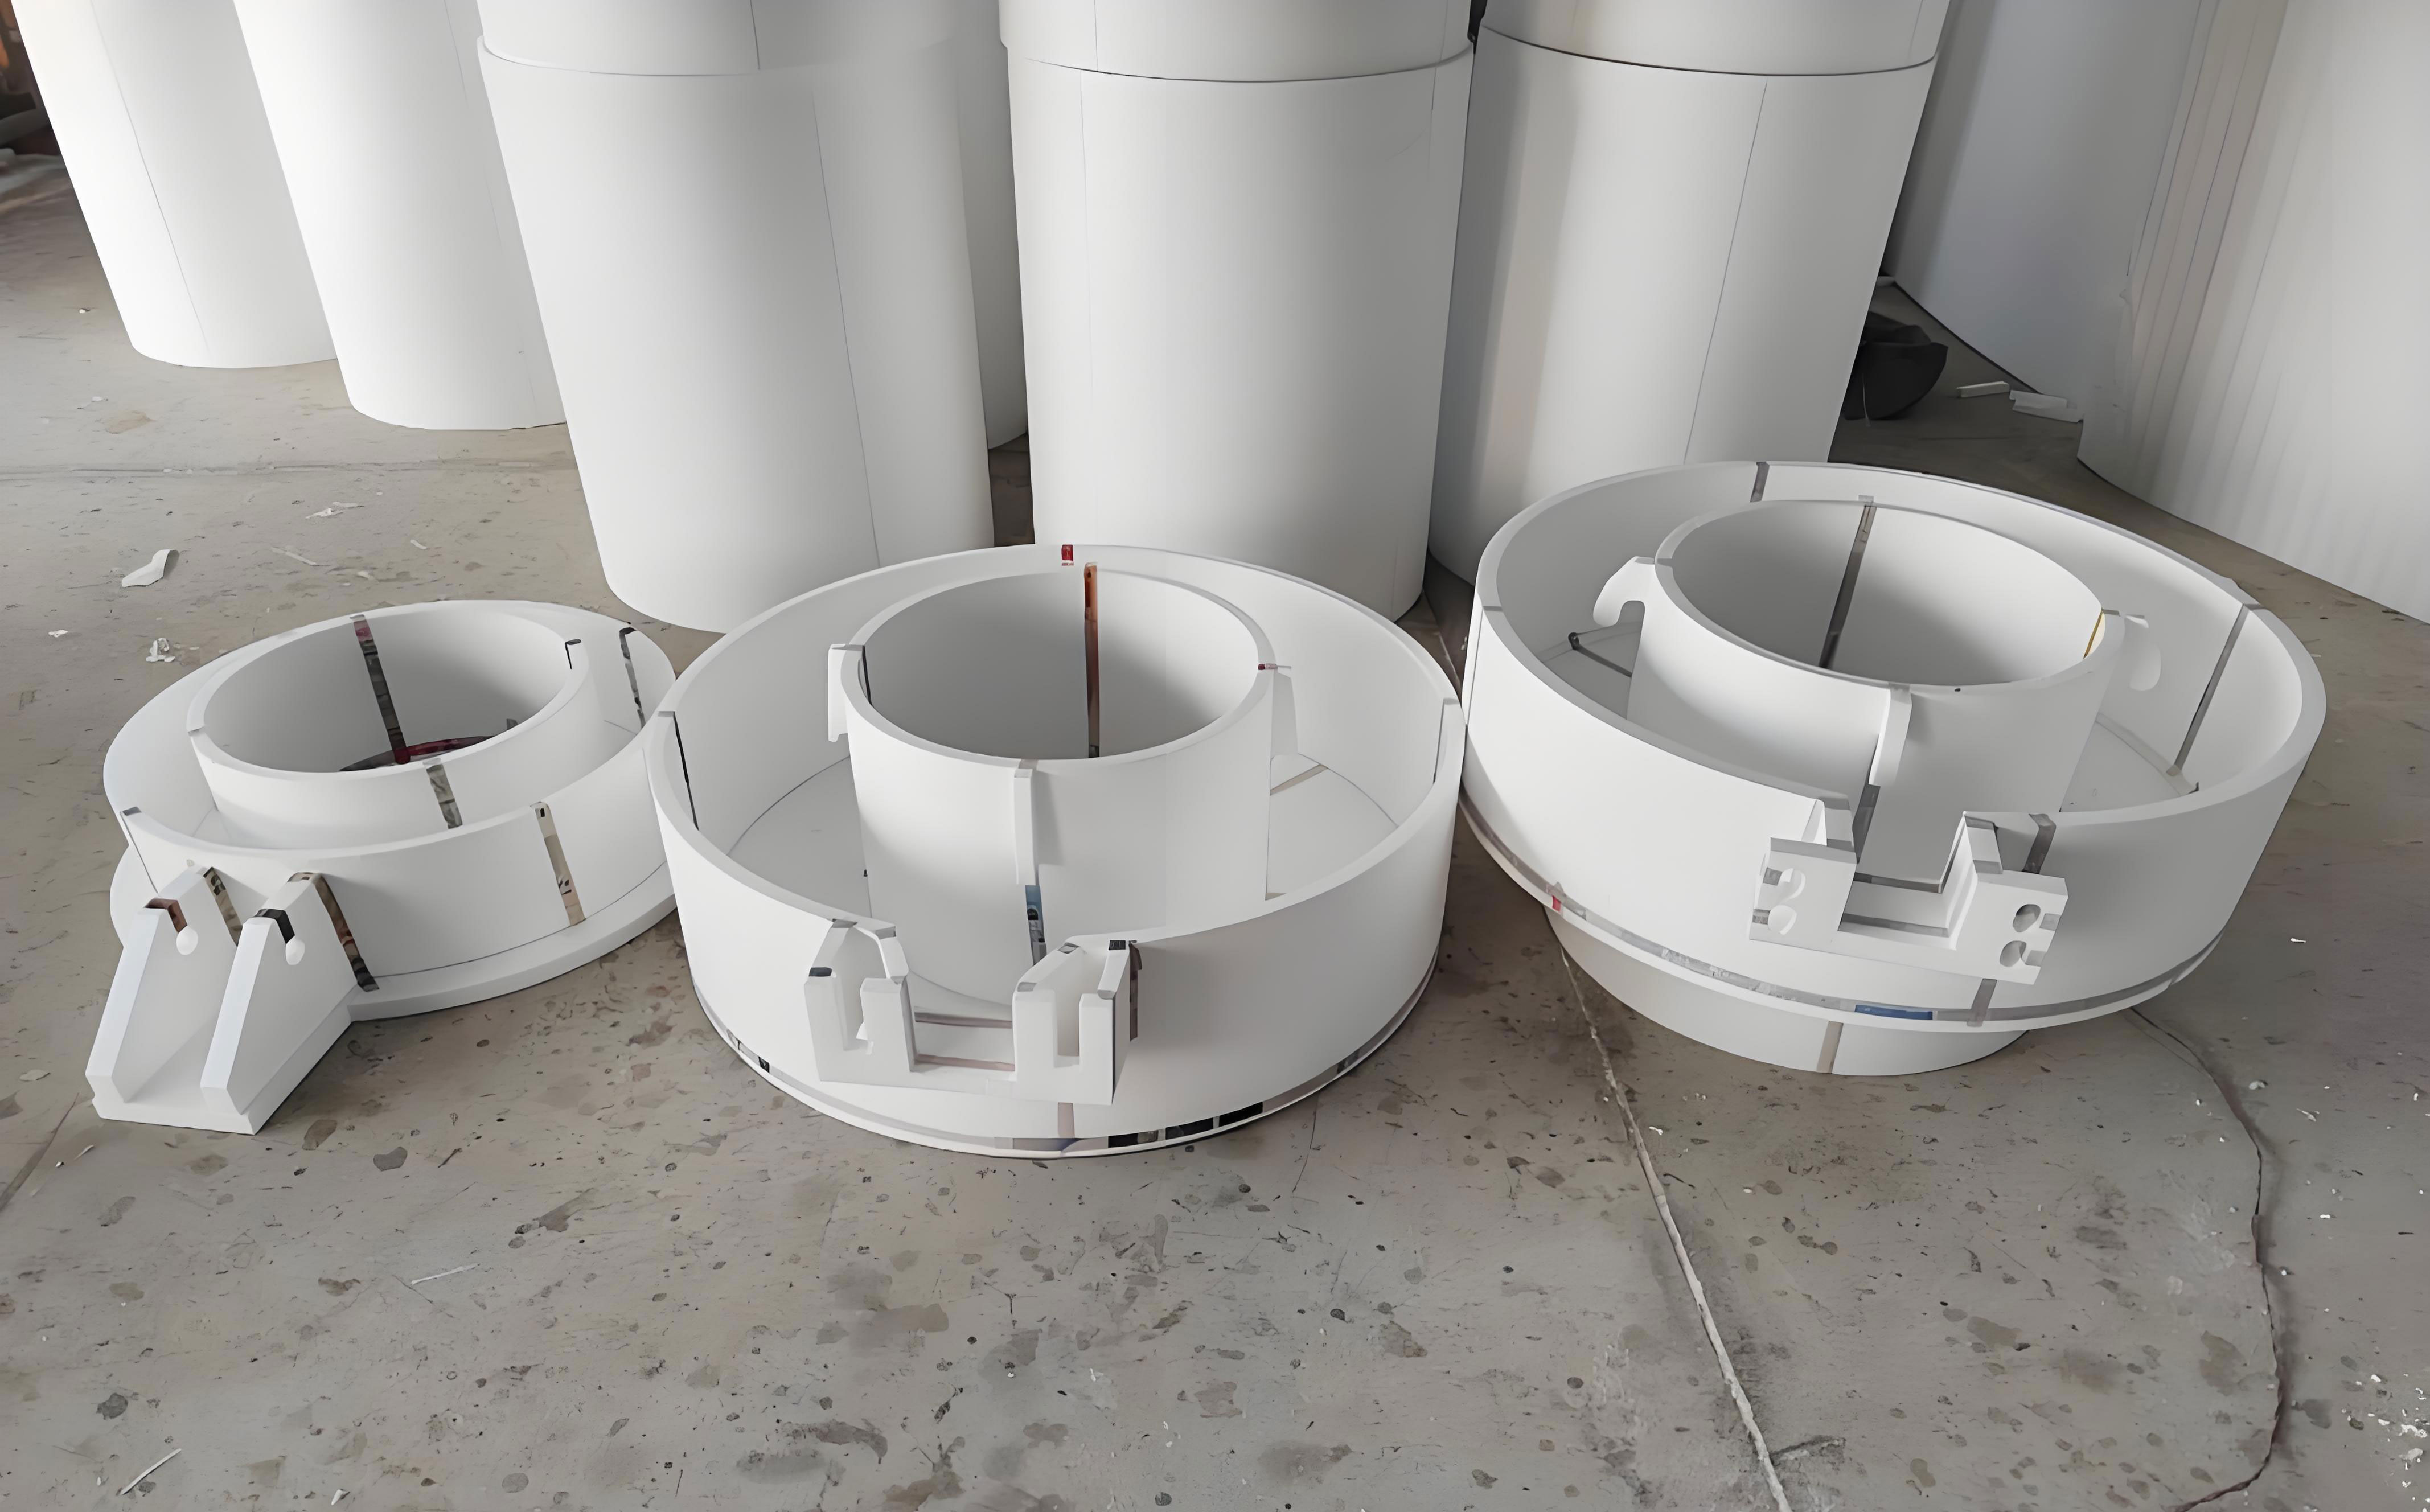
I began with a process design in which the foam pattern was made from H-S beads. The bead density was controlled between 22 g/L and 26 g/L. The pattern was heated in a molding machine at 40-50 °C for about 3 min to ensure sufficient fusion and maturation. Before drying, I corrected the white pattern to reduce warpage. Because the oil pan is a thin-wall part, it tends to deform during pouring and cooling. I used fiber rods and resin-coated sand spacers as supports, and I built a shaping fixture to hold the pattern during storage and coating. Cold glue and hot glue were used together so that the machining allowance remained uniform. The pattern was not treated as a simple replica of the casting; it was treated as a temporary tool that had to preserve its shape until the metal replaced it.
For the gating system, I used a closed pouring system. The foam board was cut from a large block, and the gating structure was arranged as a top-pouring system with a hollow cylindrical sprue and two ingates. The design intent was to fill the thin sections quickly, reduce heat loss, and provide enough feeding during solidification. The gating ratio I used in the first trial was:
$$A_s : A_r : A_g = 7 : 1 : 0.4$$
where As is the sprue cross-sectional area, Ar is the runner cross-sectional area, and Ag is the total ingate cross-sectional area. This ratio strongly favors the sprue and runner, which helps the metal fill the mold without premature freezing in the ingates. However, I learned that the ratio alone is not sufficient in lost foam casting. The foam decomposition products must escape, the coating must not be washed away, and the negative pressure must be high enough to hold the sand but not so high that metal penetration becomes severe.
The coating was a water-based coating specially formulated for lost foam casting. I applied it by dipping and brushing. Every part of the pattern, including the riser and gating system, was coated. The riser area was wrapped with fiber cloth and coated more thickly. After coating, the pattern was dried in a controlled position. I used a support fixture during drying to prevent sagging. The first, second, and third coats were dried at different positions to avoid localized overheating and uneven shrinkage. The coating layer had to be uniform, without gaps, runs, or accumulated lumps. A good coating in lost foam casting does more than resist metal penetration; it also controls gas permeability and surface finish.
| Parameter | Initial value |
|---|---|
| Foam bead type | H-S beads |
| Bead density | 22-26 g/L |
| Pattern molding temperature | 40-50 °C |
| Pattern molding time | 3 min |
| Sand size | 0.4-0.8 mm |
| Patterns per box | 6 |
| Vibration frequency | 40-45 Hz |
| Total vibration time | ≥ 360 s |
| Tapping temperature | 1520 ± 20 °C |
| Pouring temperature | 1380 ± 20 °C |
| Single casting pour time | ≤ 30 s |
| Single box pour time | ≤ 3 min |
| Holding time after pour | 3 min |
For sand filling, I used a silica sand with a grain size of 0.4-0.8 mm. The layout was designed for six castings per box. The bottom sand was first leveled, and the pattern was fixed in position. The flask was clamped on a vibration table. I applied bottom vibration first, then added sand in layers while continuing vibration. When the sand reached the three reinforcing ribs, I stopped adding sand, continued vibration to compact the sand in that region, and then resumed adding sand. When the sand covered the top of the oil pan by about 80 mm, I stopped adding sand. The total vibration time was not less than 360 s, and the vibration frequency was 40-45 Hz. This procedure was intended to avoid sand bridges, loose corners, and pattern movement.
For melting, I charged scrap steel first, then returned material, and finally ferrosilicon. Ferromanganese was added before tapping. A low-sulfur carburizer was added during melting. After all charge materials were melted, I added a covering flux to protect the molten iron from oxidation. When the iron reached the sampling temperature, I took a sample for chemical analysis. After the composition was qualified, I performed inoculation. The molten iron was tapped into a ladle, and a second inoculation was performed in the ladle. The target composition is summarized in Table 3.
| Element | Target range, wt.% |
|---|---|
| C | 2.9-3.1 |
| Si | 1.7-1.9 |
| Mn | 0.7-0.9 |
| P | ≤ 0.055 |
| S | ≤ 0.09 |
| Cr | 0.2-0.3 |
| Mg | 0.015-0.035 |
| Others | ≤ 0.12 |
The tapping temperature was 1520 ± 20 °C. After tapping, the iron was held for 2-3 min for static settling and inoculation, and then slag was removed again. The pouring temperature was controlled at 1380 ± 20 °C. The pour time for a single casting was kept below 30 s, and the pour time for a full box was kept below 3 min. After pouring, the box was held under negative pressure for 3 min. The castings were cut from the gating system with a diamond blade and then shot-blasted in a hook-type shot-blasting machine. Four castings were treated per cycle, and the surface was required to be clean and free of loose material.
Despite this initial process design, the production trial revealed significant defects. The most serious was deformation. Because the oil pan is a thin-wall shell with a large inner cavity, it deformed along the two wide side edges. In the first trials, deformation-related scrap reached about 50%. The measured dimensions also showed negative deviations on several critical features. Table 4 shows the initial dimensional results. Although some deviations were only 1-2 mm, they were enough to cause insufficient machining allowance and assembly problems.
| Feature | Drawing finished size, mm | Required casting size, mm | Blank inspection, mm | Deviation, mm |
|---|---|---|---|---|
| Internal cavity total length | 551 | 551 | 549 | -2 |
| Flywheel housing total length | 601.5 | 604 | 603 | -1 |
| Connecting boss opening | 304 | 308 | 307 | -1 |
| Height from joint face to bottom boss | 163 | 168 | 167 | -1 |
| Body joint face side width | 287 | 287 | 286 | -1 |
The deformation mechanism in lost foam casting is complex. The foam pattern can deform during molding, ejection, storage, gluing, coating, drying, and sand compaction. The sand exerts different pressures in different directions during vibration. When the pattern is not supported uniformly, it can bend before the metal is poured. I used the following strain relationship to quantify the problem:
$$\epsilon = \frac{\Delta L}{L_0}$$
where ε is the strain, ΔL is the change in length, and L0 is the original length. In my trials, a small strain in the foam pattern could become a large dimensional error after coating, drying, and pouring. The corrective action had to begin at the pattern stage, not at the casting stage.
The second major defect was metal penetration, also called sand burn-on or penetration. The oil pan has uneven reinforcing ribs. In some regions, the sand did not flow easily into corners and fillets. When the sand contained a wide particle-size distribution or excessive ash, the permeability and compactness decreased. If the coating was too thin or lacked strength, the high-temperature iron could break through the coating and penetrate the sand. The result was a rough, strongly bonded surface that required excessive cleaning and sometimes caused scrap. In lost foam casting, metal penetration is not only a surface issue; it can also indicate that the local sand compactness and negative pressure are poorly balanced.
I described the local sand compactness using a simple stress relation:
$$\sigma = \frac{F}{A}$$
where σ is the compaction stress, F is the applied force from vibration, and A is the local area. When the vibration force did not reach a corner, σ remained low, and the sand remained loose. The loose sand allowed the metal to push grains aside and penetrate. The corrective measures therefore included better sand flow, manual corner filling, optimized vibration, and a stronger coating.
The third defect was dross and slag inclusion. In lost foam casting, the foam pattern decomposes into solid, liquid, and gaseous products when the metal enters. If these products are not evacuated through the coating and sand, they can remain in the casting. In addition, the flowing metal can erode the coating or sand and carry fragments into the mold cavity. Poor slag removal, poor skimming, and inadequate holding time also contributed to dross. I found that dross was more common near the last-filled regions and near the top surfaces of the casting.
The fourth defect was cold shut. The oil pan is a thin-wall shell. The molten iron loses heat rapidly as it flows through the thin sections. If the pouring temperature is too low, if the pouring speed is too slow, or if the gating system does not deliver enough metal quickly, the leading edges of the metal can freeze before they merge. The result is a cold shut: a line or crack-like discontinuity where two streams of metal failed to fuse. Cold shut is especially dangerous because it can appear as a surface line but also reduce pressure tightness and mechanical strength.
I used the heat-loss expression to explain the sensitivity:
$$Q_{\text{loss}} = h A (T_m – T_s)$$
where Qloss is the heat lost from the molten metal, h is the heat-transfer coefficient, A is the surface area, Tm is the metal temperature, and Ts is the surrounding sand temperature. For a thin-wall oil pan, the surface-area-to-volume ratio is high, so Qloss is large. This is why lost foam casting of thin-wall parts requires a higher pouring temperature, a faster pour, and a gating system that minimizes heat loss.
The fifth defect was shrinkage porosity and shrinkage cavity. The oil pan has local thick sections, bosses, and connecting regions that require feeding. If the gating system does not provide enough liquid metal during solidification, internal voids form. The problem is worse when the pouring temperature is low or when the thermal gradient is unfavorable. I used the Chvorinov relationship to estimate solidification behavior:
$$t_s = B \left(\frac{V}{A}\right)^n$$
where ts is the solidification time, V is the volume, A is the surface area, B is a mold constant, and n is an exponent usually close to 2. Thick sections solidify more slowly than thin sections. If the thick section is not fed by a riser or by a hot gating path, a shrinkage cavity will form. In lost foam casting, the foam decomposition also changes the local pressure and gas evolution, which can further complicate feeding.
The sixth defect was substandard metallographic structure. The target structure required a stable pearlite content. When the raw material ratio was not strictly weighed, the chemical composition fluctuated. When inoculation was insufficient, the carbon equivalent was low, and the Si/C ratio was outside the desired range, the pearlite content became unstable. The preferred Si/C range was 0.6-0.7. I used the carbon equivalent formula:
$$CE = C + \frac{Si}{3} + \frac{P}{2}$$
and the Si/C ratio:
$$r_{Si/C} = \frac{Si}{C}$$
In my first trials, the carbon equivalent and Si/C ratio were not controlled tightly enough. As a result, the metallographic structure had less than 10% dark areas in some fields, and the pearlite content did not meet the specification. This was not just a laboratory problem; it affected hardness, machinability, wear resistance, and fatigue behavior.
| Defect | Main location or feature | Consequence |
|---|---|---|
| Deformation | Wide side edges, open face | Insufficient machining allowance, dimensional scrap |
| Metal penetration | Corners, ribs, fillets | Rough surface, cleaning difficulty, scrap |
| Dross and slag inclusion | Last-filled regions, top surfaces | Surface and internal inclusions |
| Cold shut | Thin sections, remote ends | Incomplete fusion, leakage risk |
| Shrinkage porosity | Bosses, thick sections | Internal voids, reduced strength |
| Metallographic deficiency | Matrix structure | Low pearlite, unstable properties |
After analyzing these defects, I concluded that the oil pan could not be improved by changing only one parameter. The lost foam casting process had to be controlled as a chain. I therefore introduced a series of corrective actions for each defect family. The first group of actions addressed deformation. I required that every white pattern be inspected on a surface plate before further processing. The allowable pattern deviation was -1 mm to +3 mm. I measured the main control dimensions and compared them with the mold dimensions. Table 6 shows the model size check I used.
| Item | Drawing finished size, mm | Casting size, mm | Mold size, mm | White pattern inspection, mm |
|---|---|---|---|---|
| Internal cavity total length | 551 | 551 | 556 | 556 |
| Flywheel housing total length | 601.5 | 604 | 611 | 611-611.5 |
| Connecting boss opening | 304 | 308 | 312 | 312 |
| Height from joint face to bottom boss | 163 | 168 | 171 | 171 |
| Body joint face side width | 287 | 287 | 291 | 291 |
I dried the white pattern in a flat position with multiple support points. After drying, I measured humidity with a moisture meter. Only after the humidity met the requirement did I proceed to the next step. I used a shaping fixture to hold the dimensions, and then I bonded fiber rods to the pattern. The fiber rods acted as stiffeners during coating, drying, and sand compaction. After bonding, I measured the dimensions again. If the pattern was within tolerance, I applied coating. I also controlled the Baume degree and coating thickness. The drying schedule was adjusted so that the initial temperature was lower and the drying time was longer. This allowed the pattern to shrink uniformly and reduced internal stress. The drying schedule is shown in Table 7.
| Stage | Temperature, °C | Time, h | Notes |
|---|---|---|---|
| First coat | 40 | 8 | Flat placement, multiple supports |
| Second coat | 45 | 10 | Change position to avoid local overheating |
| Touch-up | 45-50 | — | Corners, fillets, and junctions |
| Total drying | ≤ 50 | 12-14 | Humidity checked before sand filling |
During sand filling, I leveled the bottom sand manually and then added sand uniformly. I built a locating device for the flask to ensure the correct filling angle. I used staggered placement, layered sand addition, and layered vibration. In corners, I packed sand manually. These actions reduced the deformation scrap rate from about 50% to less than 3%. The key lesson was that deformation control in lost foam casting must be proactive. Once the pattern is placed in the flask, it is too late to correct a bent foam pattern.
The second group of actions addressed metal penetration. I modified the coating to increase strength and flowability. The coating formulation included 3% bentonite, 15% graphite powder, and 15% quartz powder. The bentonite increased green strength and suspension. The graphite powder improved refractoriness and lubricity. The quartz powder increased filler content and thermal stability. The coating thickness was kept at no less than 1.6 mm. The coating had to adhere firmly to the foam pattern, remain dense, and resist cracking during vibration. If the coating was too thin, the metal could penetrate the sand. If the coating was too thick or too brittle, it could crack and spall, also causing penetration or inclusions.
| Component | Addition | Function |
|---|---|---|
| Bentonite | 3% | Strength and suspension |
| Graphite powder | 15% | Refractoriness and surface finish |
| Quartz powder | 15% | Filler and thermal stability |
| Water-based binder | Balance | Adhesion and coating uniformity |
| Coating thickness | ≥ 1.6 mm | Prevent metal penetration |
I also optimized the sand. I used a rounded or near-rounded silica sand with a grain size of 0.4-0.8 mm. I sieved used sand to remove oversize particles, fines, and dust, and I replaced part of the sand with new sand. The vibration parameters were adjusted. Under 40 Hz, the total vibration time was not less than 360 s. Under 50 Hz, the total vibration time was 280 s. I avoided excessive vibration because it could damage the coating and cause cracks. In corners and dead zones, I added sand manually and compacted it with a hand tool. The negative pressure was controlled between 0.04 MPa and 0.05 MPa. If the negative pressure was too high, metal penetration became severe. If it was too low, the mold could collapse or the casting could distort. The pouring temperature was controlled between 1420 °C and 1460 °C. I poured one box with one ladle, and I did not pour multiple boxes from the same ladle. These measures significantly reduced metal penetration.
| Parameter | Optimized value |
|---|---|
| Sand size | 0.4-0.8 mm |
| Sand shape | Rounded or near-rounded |
| Vibration frequency | 40-45 Hz |
| Total vibration time | ≥ 360 s at 40 Hz; 280 s at 50 Hz |
| Corner treatment | Manual sand addition and compaction |
| Negative pressure | 0.04-0.05 MPa |
| Pouring temperature | 1420-1460 °C |
| Ladle practice | One ladle for one box |
The third group of actions addressed dross and slag inclusion. I established a strict cleaning and slagging procedure. The furnace platform, furnace surface, and surrounding area were blown clean at regular intervals. The furnace nozzle was repaired promptly. Slag was removed in four steps: two steps under high power inside the furnace and two steps at the furnace mouth after settling. The furnace nozzle and ladle nozzle were repaired and coated with repair material. The ladle was cleaned before tapping. After tapping, the iron was held in the ladle and slagged in three stages: first, immediately after the iron was poured into the ladle; second, after a slagging agent was added and the ladle was transported to the pouring area; and third, during pouring, with a slagging agent covering the surface and only a small flow opening left. I used a fiber blanket to block slag at the flow opening. I also added a vent and slag outlet at the upper machining face. These actions reduced surface dross and internal inclusions.
The fourth group of actions addressed cold shut, shrinkage porosity, and shrinkage cavity. I increased the tapping temperature to 1540 °C, and for a cold ladle I increased it to 1560 °C. I increased the pouring temperature to 1420-1460 °C. I adopted a fast pouring practice. The gating system was redesigned. I used a cylindrical sprue instead of a rectangular or irregular sprue. The cylindrical sprue has a lower surface-area-to-volume ratio, so it loses less heat. I used a closed, top-pouring, inclined gating system. The area ratio was controlled as sprue:runner:ingate = 7:1:0.4. I used a middle gating system with two ingates. This arrangement helped skim slag and provided sufficient feeding. The pouring sequence followed the principle of slow-fast-slow. First, I opened the channel slowly for about 2 s. Then I poured rapidly for about 20 s. Finally, I slowed down as the metal reached the runner, and I finished filling in about 3 s. The total single-casting pour time was kept below 25 s. I also placed a blind riser at the location where cold shut was concentrated. The blind riser provided additional hot metal for feeding and helped eliminate cold shut and shrinkage defects.
| Parameter | Optimized value |
|---|---|
| Sprue shape | Cylindrical |
| Gating type | Closed, top-pouring, inclined |
| Ingate arrangement | Middle gating, two points |
| Area ratio | Sprue:runner:ingate = 7:1:0.4 |
| Pouring sequence | Slow 2 s, fast 20 s, slow 3 s |
| Total single-casting time | ≤ 25 s |
| Feeding | Blind riser at cold-shut location |
I used the Bernoulli relationship to understand the pressure and velocity changes in the gating system:
$$P_1 + \frac{1}{2}\rho v_1^2 + \rho g h_1 = P_2 + \frac{1}{2}\rho v_2^2 + \rho g h_2$$
where P is pressure, ρ is density, v is velocity, g is gravitational acceleration, and h is height. In lost foam casting, the foam pattern introduces an additional resistance and gas pressure that are not present in conventional sand casting. The effective pressure is reduced by the gas film and by the vacuum system. I therefore used the net pressure concept:
$$P_{\text{net}} = P_{\text{atm}} – P_{\text{vac}} – P_{\text{gas}}$$
where Patm is atmospheric pressure, Pvac is the vacuum pressure, and Pgas is the gas pressure from foam decomposition. When Pnet is too low, the metal may not fill thin sections before freezing. When Pnet is too high, metal penetration can occur. This balance is central to successful lost foam casting of thin-wall oil pans.
I also considered the flow regime in the gating system. The Reynolds number is:
$$Re = \frac{\rho v D}{\mu}$$
where D is the hydraulic diameter and μ is the dynamic viscosity. In the early part of the pour, the flow is relatively slow and the metal may lose heat quickly. In the fast part, the flow becomes more turbulent, which helps fill thin sections but can also erode the coating. The slow-fast-slow sequence was chosen to balance these effects. The slow start avoids a sudden pressure surge and allows the foam to decompose gradually. The fast middle stage fills the thin walls before they freeze. The slow final stage reduces turbulence and slag entrapment near the end of filling.
The fifth group of actions addressed the metallographic structure. I optimized the chemical composition so that the carbon equivalent was controlled between 3.8% and 4.1%. I targeted a Si/C ratio of about 0.65, with an allowable range of 0.6-0.7. I controlled the sand moisture between 3.2% and 3.5%. I weighed all raw and auxiliary materials strictly according to the charge plan. I increased the frequency of furnace-front chemical analysis and adjusted the composition in real time. I ensured that the composition was qualified before tapping. I optimized the addition sequence and temperature. The carburizer was added at 1/4, 1/2, and 3/4 of the melt, and each addition was limited to no more than 40 kg. Ferromanganese was added at 3/4 of the melt. Ferrosilicon was added 10 min before tapping. I changed the in-furnace inoculation to surface inoculation by using a feeding device, which improved the inoculation effect. I used an insulation board to improve ladle insulation and ensured that the inoculation time was not less than 5 min. The inoculant was added in the required proportion, and the melt was allowed to stand for full reaction.
| Addition or parameter | Timing or target | Control limit |
|---|---|---|
| Carburizer | At 1/4, 1/2, 3/4 of melt | ≤ 40 kg per addition |
| Ferromanganese | At 3/4 of melt | According to analysis |
| Ferrosilicon | 10 min before tapping | According to analysis |
| Inoculation | Surface and ladle | ≥ 5 min reaction time |
| Carbon equivalent | 3.8-4.1% | Furnace analysis |
| Si/C ratio | 0.6-0.7 | Target 0.65 |
| Sand moisture | 3.2-3.5% | Regular check |
| Pearlite content | Stable and specification-compliant | Metallographic verification |
After implementing these measures, I standardized the process and conducted six trial batches. Each batch contained 32 oil pans. The trials demonstrated that the support rods and shaping fixture controlled pattern deformation. The cylindrical sprue and closed gating system reduced dross and cold shut. The adjusted vibration parameters and manual corner sand filling reduced metal penetration. The higher tapping temperature, higher pouring temperature, and fast pouring method controlled cold shut. The redesigned gating system and composition adjustment improved internal soundness and microstructure. The final casting yield reached 96%. Table 12 summarizes the final optimized process window, and Table 13 summarizes the defect reduction.
| Parameter | Optimized value |
|---|---|
| Foam bead density | 22-26 g/L |
| Pattern molding | 40-50 °C, 3 min |
| Pattern reinforcement | Fiber rods and shaping fixture |
| Coating thickness | ≥ 1.6 mm |
| Drying | 40-50 °C, 8-14 h |
| Sand size | 0.4-0.8 mm |
| Vibration | ≥ 40 Hz, ≥ 360 s |
| Negative pressure | ≥ 0.04 MPa |
| Tapping temperature | 1540 °C, or 1560 °C for cold ladle |
| Pouring temperature | 1420-1460 °C |
| Single casting pour time | ≤ 25 s |
| Single box pour time | ≤ 3 min |
| Holding time | 3 min |
| Si/C ratio | 0.6-0.7 |
| Carbon equivalent | 3.8-4.1% |
| Casting yield | 96% |
| Defect | Initial condition | Improved condition | Key action |
|---|---|---|---|
| Deformation | About 50% scrap | Less than 3% | Shaping fixture, fiber rods, controlled drying |
| Metal penetration | Severe in corners and ribs | Significantly reduced | Stronger coating, better sand, controlled vacuum |
| Dross and slag | Frequent surface inclusions | Reduced | Staged slagging, large-particle flux, fiber blanket |
| Cold shut | Present in thin sections | Controlled | Higher temperature, fast pour, cylindrical sprue |
| Shrinkage porosity | Internal voids near bosses | Reduced | Blind riser, optimized gating ratio |
| Metallographic structure | Pearlite below target | Specification met | Si/C control, carbon equivalent control, inoculation |
In my final assessment, the most important lesson from this lost foam casting project was that the process must be understood as a coupled thermo-fluid-mechanical system. The foam pattern is not simply a shape; it is a gas-generating, heat-absorbing, and dimensionally sensitive component. The coating is not simply a refractory layer; it is a gas-permeability membrane and a mechanical barrier. The sand is not simply a support; it is a pressure-transmitting and heat-absorbing medium. The vacuum is not simply a clamping force; it is a process variable that controls gas removal, sand stability, and metal penetration. The gating system is not simply a set of channels; it is the thermal and hydraulic path that determines whether thin walls fill and whether thick sections feed.
I also found that mathematical summaries helped my team make decisions faster. For example, when we discussed deformation, we used the strain relation ε = ΔL/L0. When we discussed metal penetration, we used the compaction stress σ = F/A. When we discussed cold shut, we used the heat-loss relation Qloss = hA(Tm – Ts). When we discussed feeding, we used the Chvorinov relation ts = B(V/A)n. When we discussed chemistry, we used the carbon equivalent and Si/C ratio. These formulas did not replace experience, but they gave us a common language for troubleshooting. In lost foam casting, troubleshooting without a common language often leads to random changes. Random changes may solve one defect while creating another. The formulas and tables helped us change one variable at a time and verify the result.
The final production results showed that lost foam casting can be a reliable route for thin-wall oil pans when the process is controlled tightly. The casting yield reached 96%, deformation scrap fell to less than 3%, and the metallographic structure met the specification. The improved process also reduced cleaning labor, because metal penetration and dross were minimized. The surface quality was better, the machining allowance was more uniform, and the dimensional consistency was improved. From my perspective, the greatest value of the project was not a single new parameter but the creation of a disciplined lost foam casting system: pattern dimensions checked at every stage, coating formulation and thickness controlled, sand and vibration standardized, gating and pouring optimized, and chemistry and inoculation verified before tapping.
If I were to summarize the optimized lost foam casting route for this oil pan in one sentence, I would say that it is a sequence of controlled allowances, controlled gas evolution, controlled filling, and controlled solidification. The pattern allowance must include machining, shrinkage, and distortion. The gas evolution must be managed by coating and vacuum. The filling must be fast enough to avoid cold shut but smooth enough to avoid sand erosion. The solidification must be fed by a well-designed gating system and blind riser. The chemistry must be stable enough to produce the required pearlite. When these conditions are met, lost foam casting produces an oil pan that is dimensionally accurate, pressure-tight, machinable, and metallurgically sound.
I continue to use the following general mass balance for the pouring operation:
$$m_{\text{poured}} = m_{\text{casting}} + m_{\text{gating}} + m_{\text{riser}} + m_{\text{loss}}$$
where mpoured is the total mass poured, mcasting is the mass of the oil pan, mgating is the mass of the gating system, mriser is the mass of the riser, and mloss is the loss due to spillage, slag, and sampling. This balance helps determine the required charge weight and the ladle size. In lost foam casting, the gating and riser mass can be a significant fraction of the total poured mass, so accurate mass balance is important for temperature control and feeding.
I also use the following relation for the filling time:
$$t_f = \frac{V_{\text{cavity}}}{Q_{\text{avg}}}$$
where tf is the filling time, Vcavity is the cavity volume, and Qavg is the average volumetric flow rate. For a thin-wall oil pan, Vcavity is fixed by the design, so the only way to reduce tf is to increase Qavg. Increasing Qavg requires a larger effective gate area, a higher metallostatic head, or a lower resistance in the gating system. However, increasing Qavg too much can cause turbulence, coating erosion, and dross entrapment. The slow-fast-slow sequence was my practical solution to this trade-off.
For sand compaction, I also considered the relationship between vibration energy and local density. A simplified expression is:
$$\rho_s = \rho_{s0} + k E_v$$
where ρs is the local sand density, ρs0 is the initial loose density, Ev is the vibration energy delivered to the region, and k is an empirical coefficient. In corners and narrow ribs, Ev is often lower because the sand does not transmit vibration efficiently. This is why manual sand filling and local compaction were necessary. The formula also explains why increasing the overall vibration time alone did not solve metal penetration. The energy had to reach the critical regions.
For coating performance, I used the following qualitative criterion:
$$\tau_{\text{coating}} > \tau_{\text{metal}}$$
where τcoating is the shear strength of the coating and τmetal is the shear stress applied by the flowing metal. If the coating strength is lower than the metal shear stress, the coating will erode. The shear stress depends on metal velocity, density, and viscosity. This is why I increased the coating thickness and added bentonite, graphite, and quartz. The coating had to withstand the erosion of the fast-pouring stage without cracking during the vibration stage.
For inoculation, I used the following practical relation:
$$N_{\text{nuclei}} = f(C_{\text{inoc}}, t_{\text{hold}}, T_{\text{inoc}})$$
where Nnuclei is the number of active nuclei, Cinoc is the inoculant concentration, thold is the holding time, and Tinoc is the inoculation temperature. The function is not linear. Too little inoculant produces a coarse or cementite-containing structure. Too much inoculant can cause graphite flotation or excessive ferrite. The holding time must be long enough for dissolution but not so long that the inoculant fades. My target was an inoculation time of at least 5 min, with surface inoculation and ladle inoculation working together.
I also monitored the pearlite content because it controls hardness and machinability. A simplified relationship is:
$$P\% = f(CE, r_{Si/C}, R_c)$$
where P% is the pearlite fraction, Rc is the cooling rate, and the other symbols are as defined above. When the carbon equivalent is too low, the alloy tends to form more ferrite or carbides, depending on the cooling rate. When the Si/C ratio is outside the optimum range, the graphite morphology and matrix balance change. By keeping the carbon equivalent at 3.8-4.1% and the Si/C ratio at 0.6-0.7, I obtained a more stable pearlite content and met the metallographic requirement.
In terms of quality control, I established a checklist that covered every shift. The checklist included foam bead density, pattern dimensions, glue joints, fiber rod placement, coating Baume degree, coating thickness, drying temperature, drying time, sand grain size, sand moisture, vibration frequency, vibration time, vacuum level, tapping temperature, pouring temperature, pouring time, holding time, chemical composition, inoculation time, and metallographic sampling. The checklist was not a bureaucratic document; it was a practical tool that prevented the process from drifting. In lost foam casting, process drift is often invisible until the castings are cleaned or machined. By then, the scrap has already been produced. The checklist moved the detection point upstream.
The final result was a stable lost foam casting process for the oil pan. The casting met the dimensional requirements, the machining allowances were sufficient, the surface was clean, the internal defects were reduced, and the metallographic structure was acceptable. The production yield reached 96%. I consider this result to be a strong validation of the systematic approach. The approach can be summarized in four principles. First, control the pattern as a precision component. Second, control the gas and vacuum as a coupled system. Third, control the filling and feeding as a thermal-hydraulic system. Fourth, control the chemistry and inoculation as a metallurgical system. When these four principles are followed, lost foam casting is not only a cost-effective alternative to conventional sand casting but also a high-quality manufacturing method for thin-wall oil pans.
For future work, I would further study the local pressure distribution during pouring, the real-time gas evolution from the foam pattern, and the effect of sand grain shape on coating support. I would also use more sensors to measure vacuum, temperature, and vibration in different regions of the flask. The goal would be to move from experience-based control to data-based control. Even so, the current process already demonstrates that lost foam casting can produce a reliable oil pan with a high yield. The key is to respect the complexity of the process and to control every step with measurements, tables, and clear formulas.