
1. Base metal structure of different graphite types
Figure 1 shows the graphite type of no.a-no.e, and its chemical composition is shown in Table 1. It can be seen from the table that samples No. a, No. B and No. C are composed of graphite and pearlite, and there is almost no ferrite; No. D is composed of ferrite dendrites and fine dense graphite; No. e is composed of pearlite, a small amount of ferrite (about 20%) and small flake graphite.
| Specimen | C | Si | Mn | P | S | Fe |
| No.A | 3.17 | 1.64 | 0.91 | 0.02 | 0.01 | Bal. |
| No.B | 3.41 | 1.61 | 0.88 | 0.02 | 0.01 | Bal. |
| No.C | 3.55 | 2.09 | 0.02 | 0.01 | 0.01 | Bal. |
| No.D | 3.25 | 2.45 | 0.5 | 0.04 | 0.01 | Bal. |
| No.E | 2.67 | 1.66 | 0.88 | 0.02 | 0.01 | Bal. |
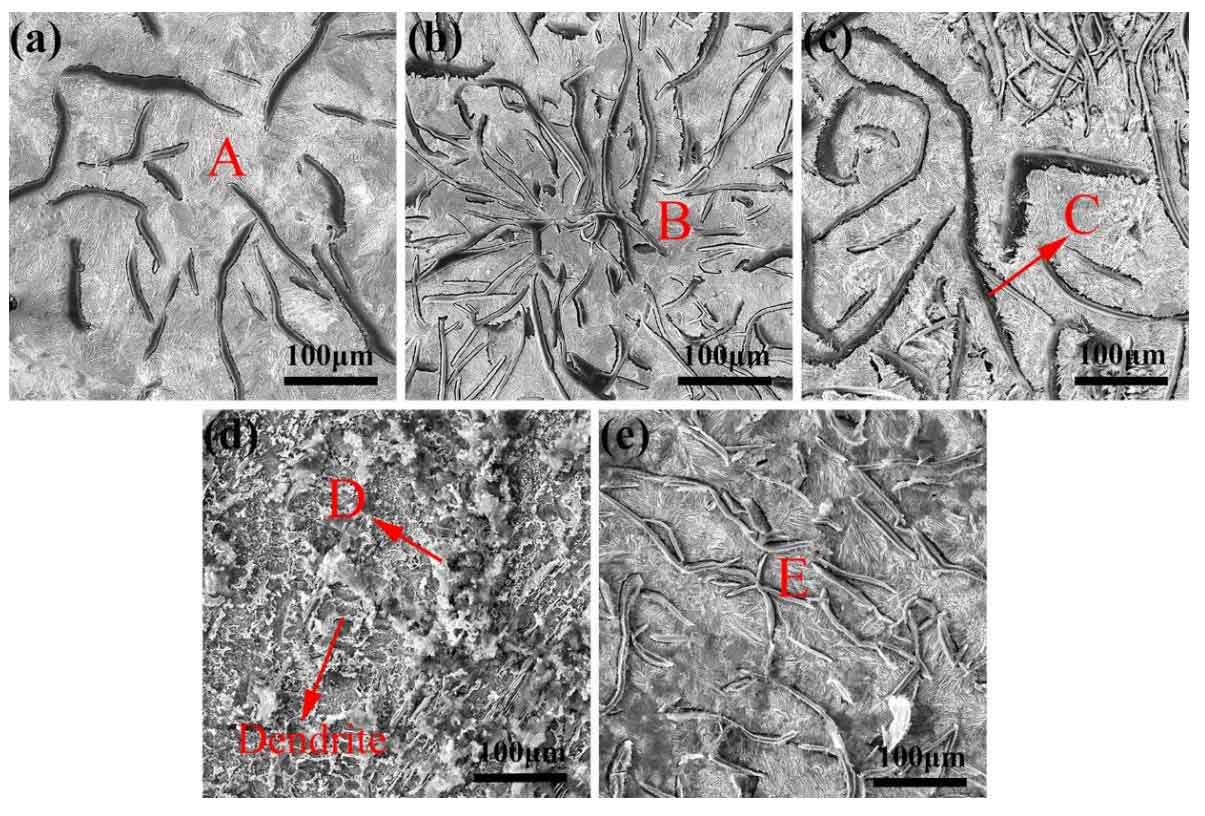
According to the metallographic standard of domestic gray cast iron, flake graphite is divided into five types A to e, with a length of 1-8 grades. The graphite length grade of the sample is shown in Table 1. Due to wet sand casting and different carbon equivalent, No. A and No. C form type a graphite and type C graphite respectively, and the length grade is grade 3 and grade 2 respectively; No. B forms B-type graphite with a length of grade 3; No. E forms E-type graphite due to low carbon content, with a length of grade 4; No. D belongs to metal casting, and the cooling rate is very fast, so it forms D-type graphite and is distributed in the dendrite gap, with a length of Grade 8. After deep corrosion, it is found that D-type graphite is a cluster composed of many fibrous graphite.
| Samples | No. A | No. B | No. C | No. D | No. E |
| Distance (μm) | Type-A≤43.2 | Type-B≤17.2 Type-A≤26.4 | Type-C≤47.5 Type-A≤26.6 | Type-D≤1 | Type-E≤12.6 |
| Length grade | Type-A: 3 | Type-B: 3 | Type-C: 2 | Type-D: 8 | Type-E: 4 |
2. Microstructure analysis of Laser Biomimetic unit
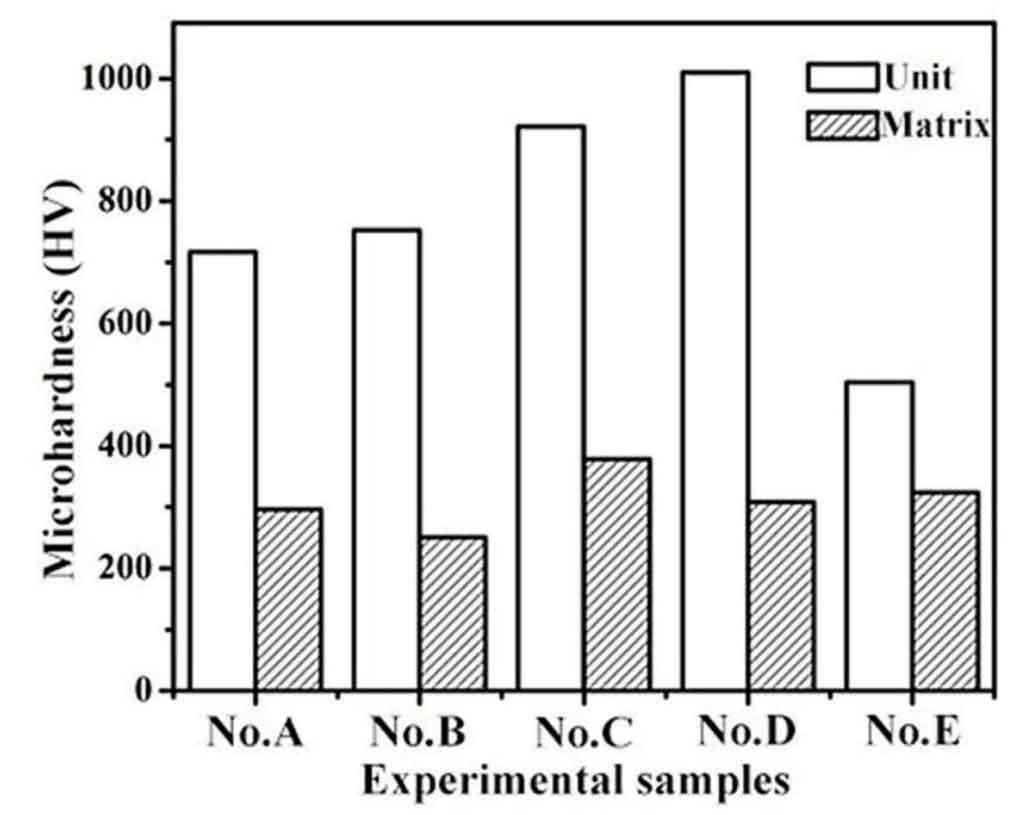
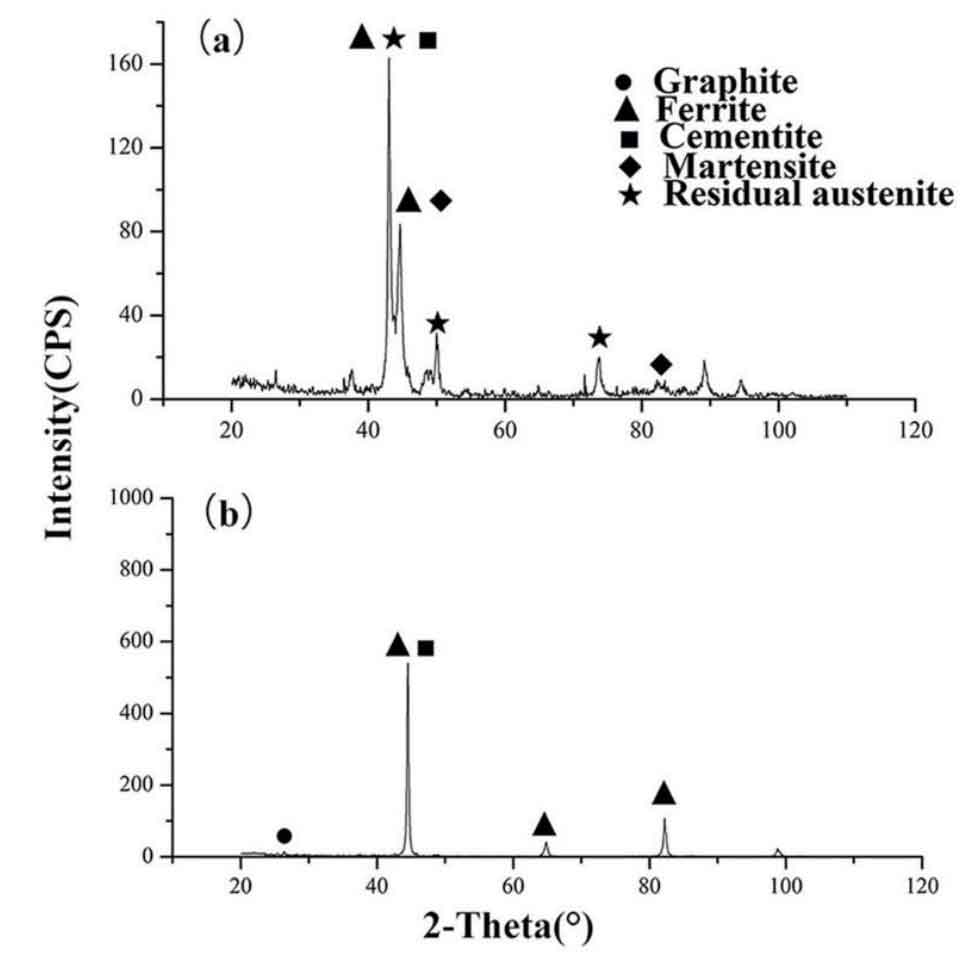
Because the Laser Biomimetic unit is remelted and cooled in the laser processing process, all the graphite in gray cast iron is dissolved and dissolved in the unit body, resulting in solid solution strengthening of the unit body. As shown in Figure 2, the hardness of the bionic unit is much higher than that of the base metal, which is generally increased to 1.6-3.3 times; Among them, the hardness of bionic unit of No. D is the highest, which is 3.3 times that of No. D matrix. The hardness and strength of materials are closely related to their microstructure. In gray cast iron, the base metal structure is basically composed of pearlite, graphite and a small amount of ferrite. However, according to the XRD comparison of gray cast iron matrix and unit body (Fig. 3), in addition to the original ferrite and cementite phase, martensite and retained austenite phase also appear in the unit body, while the graphite phase completely dissolves and disappears. The formation of new phase has a strengthening effect on the material. In addition, according to the half peak width of X-ray diffraction peak, the matrix is 0.298 ° and the unit body is 0.441 °. The broadening of X-ray diffraction peak means the refinement of grain size or sub grain size. Moreover, the effect of grain size on the yield strength of materials can be expressed by hall patch formula:
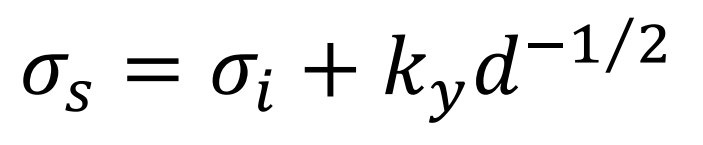
Where 𝜎i represents the total resistance of dislocation movement, ky is a constant, which is related to the properties of the material and the grain size, and d represents the average grain diameter. This formula shows that after laser processing, due to grain refinement and solid solution strengthening, the comprehensive properties of the unit body are improved and become a tough phase in the laser bionic structure. The carbon content and graphite type in gray cast iron determine the content and distribution of carbides in the unit body, and affect the thermal conductivity of the material.
By combining the XRD results and SEM images, we can more intuitively understand the unit microstructure of different graphite base metals. As shown in Figure 4, the graphite in gray cast iron is completely dissolved and forms dendrite structure. The unit bodies of No. A and No. D samples are grid dendrites, and the dendrites of No. D are finer; No. B and No. C show acicular dendrites due to high carbon content and uneven distribution of graphite; In addition, due to the low carbon content of No. e, the dendrites are in fishbone shape.