
With the rapid development of China’s economy, especially the infrastructure industryThe rise of the Internet of Things has led to an increasing demand for steel, which in turn has a significant impact on the quality andProducts have more stringent requirements. China is a country with very rich resources of chromium and nickel.Lack of countries, based on China’s national conditions, began to increase their demand for duplex stainless steelResearch and application of duplex steel [2]. Duplex steel is composed of austenite and ferriteThe approximate 1:1 tissue composition has both the goodtoughness and plasticity, and good oxidation resistance of ferritic stainless steelConsider comprehensively the mechanical properties, oxidation resistance andThe problems of the lack of nickel resources in China, and the proposed Fe-Cr-Ni-Al duplex stainless steelThe solution [4]. It can be formed at high temperatures above 600℃.Al2O3 and Cr2O3 films can be tightly combined, making them have goodGood antioxidant performance and excellent solderability.
At present, the casting process and numerical simulation of alloys have beenA series of studies have been conducted to investigate the selective laserMelting process parameters, and preparation of moreThe temperature of dense Ti6Al4V parts was simulated for the first time based on 3D models.Distributed computing. Three different process designs for military vehiclesThe steering arm of the vehicle was numerically simulated, and the defects shown in the simulation resultsImprove the design plan with the location of shrinkage cavity, thereby reducing defects andThe occurrence of shrinkage cavity improves the economy of production. In order to predict the casting process,The porosity defects and secondary dendrite arm spacing in the cylinder head were simulated using aluminumDuring the low pressure casting process of alloy cylinder heads, it was found that porosity defects mainly existed in the area where the cooling water inlet and outlet were located.At the junction of thick and thin walls, it is consistent with the experimental results. However,For small castings, traditional casting processes have certain limitationsAnd it is also difficult to reflect the temperature gradient distribution of the solidification process through experiments.cloth and filling solidification process. This article is based on Procast software researchThe filling and solidification process of iron-chromium-nickel-aluminum alloy was studied, and the different positions of its solidification stage were analyzed.The temperature field and cooling rate were explored, and the relationship between cooling rate and casting quality was obtained.The relationship between the primary dendrite spacing of the Fe-Ni-Cr-Si alloy and the cooling rateThe influence on microstructure and hardness provides certain theoretical basis for production process.On the foundation and data support.
1 Test materials and methods
Using commercially available bulk materials such as Fe, Cr, Ni, Al, etc., according to Table 1Weigh 40g of the materials in the proportion shown and place them in a copper crucible. Use a trueReheating the empty arc smelting furnace for 4 times, and then smelting the componentsThe relatively uniform metal continues to be smelted and cast, and is disassembled after coolingGrind the abrasive tool to obtain a stepped sample.
The solidification process of Fe-Cr-Ni-Al alloy was simulated using Procast software.Simulate the temperature field and cooling rate. Place the stepped specimen in the longitudinal directionCut the sample into different thicknesses and embed it in the XQ-2 embedding machineInsert, grind with sandpaper, polish with a polisher, and use aqua regia as the corrosive liquidThe organization was observed under a metallurgical microscope.The plus6.0 software performs statistics and calculations on the primary dendrite spacing and phase ratioYes, the microhardness of different phases in the alloy was measured using a microhardness tester.Quantity and statistics.
2 Test results and analysis
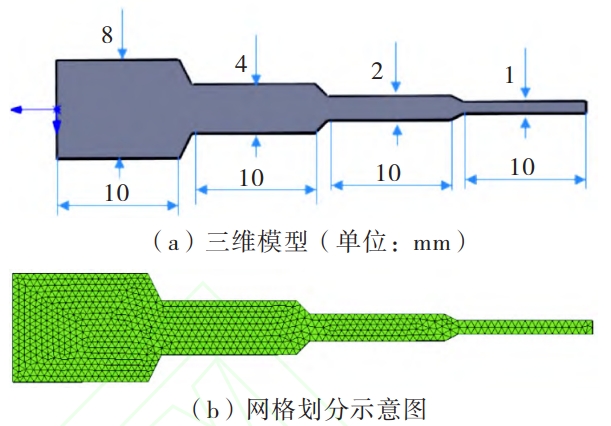
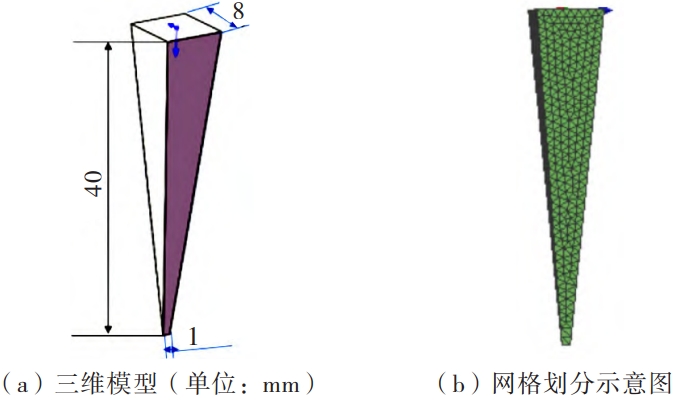
The influence of thickness on the cooling rate of the middle part during solidificationThree-dimensional modeling of the sample and mold is carried out in Solidworks software.The dimension modeling is shown in Figure (a). The model is divided into non-uniform shapes.In the Mesh module, perform mesh division and set the sample gridThe grid size is set to 0.5mm, and the mold grid is set to 5mm. After the division is completed, the gridThe surface grid and volume network model obtained after quality inspection are shown in Figure 1.(b) The number of generated surface grids is 8982, and the number of body grids is185270.
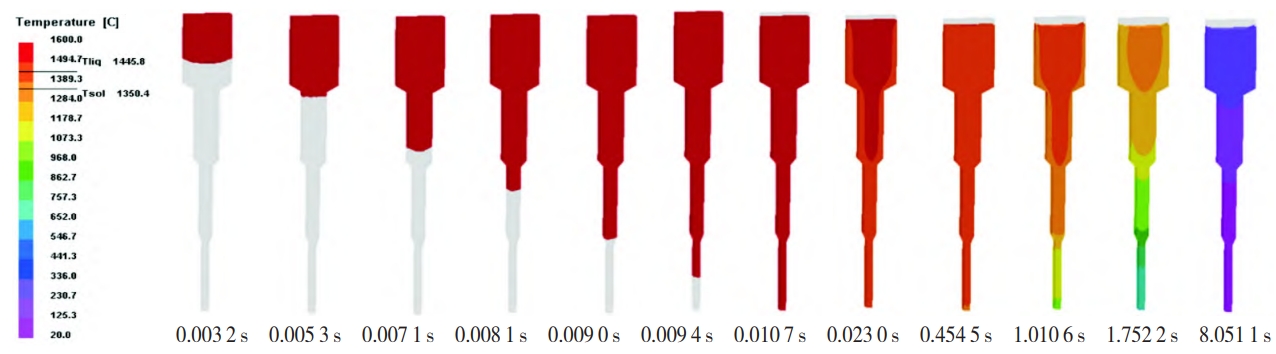
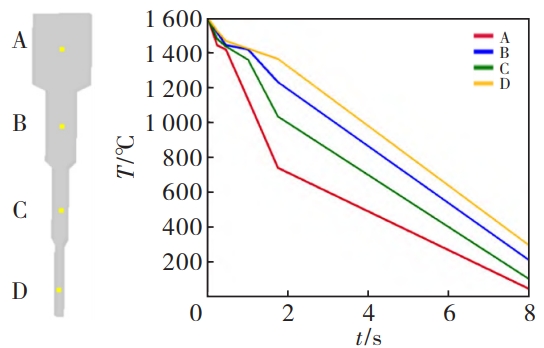
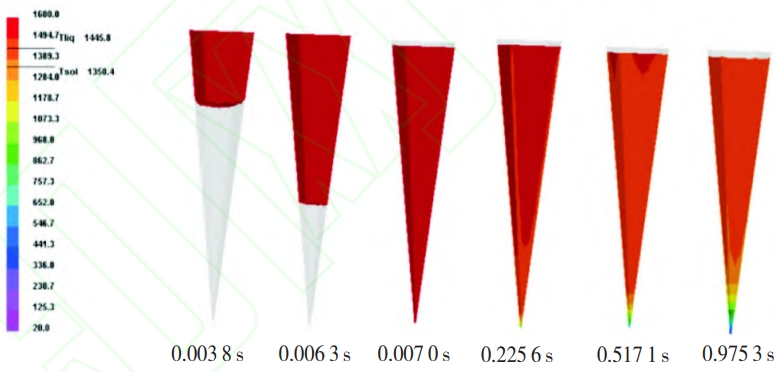
The condition setting in Procast software is implemented in the Cast module.Sure. This simulation uses a gravity pouring model, and the direction of gravity should beConsistent with the pouring direction, due to different choices of modeling planes, XYZThe axis may vary, and the gravity direction of this model is selected as the -Y axis.Because the filling speed is fast, set the filling and condensation in the body managerThe solidification process is carried out simultaneously, with the initial pouring temperature set at 1600℃.The initial temperature of the mold is set to 25°C;the heat transfer coefficient is managed at the interfaceThe heat exchange interface in the device is set as the boundary between the sample and the mold. Due to theDue to the different materials, there will be a temperature drop during the solidification process, and the selection of materials is very important.Using CONIC dual nodes, the heat transfer coefficient h=1000W/(m2·K).Set the boundary conditions in the process condition manager, andThe contact surface is the curved side of the mold, which is set to air cool during pouring.Select the center of the upper surface of the model with a diameter of 4.5mm.Note: The speed is set to 2000mm/s. The simulation parameters use gravity casting moldsThe data that comes with the software in the model is calculated. After the parameter settings are completed,Check the model and confirm it is correct before performing simulation calculations.Figure 2 shows the different shrinkage rates of iron-chromium-nickel-aluminum alloy during the filling and solidification process.The temperature field distribution cloud image of the alloy liquid entering from the high temperature of 1600℃In the mold, due to the small size of the sample, the filling time is very short. As shown in Figure 2It can be seen that the filling process has been completed in less than 0.011s.The temperature of the alloy liquid during the filling process is always higher than the liquidus temperature.Select the center of the longitudinal section of the casting with a thickness of 8, 4, 2, and 1mm, respectivelyPoints A, B, C, and D were selected to obtain the temperature variation of the center point with time for different thicknesses.As shown in Figure 3, the alloy liquid is pouredTemperature of 1600℃ cooling to liquidus temperature of 1445℃, A, B, C, DThe four nodes took 0.945, 0.848, 0.463, and 0.345 seconds, respectively.The temperature drops very quickly. After reaching the liquidus temperature,The golden liquid begins to solidify and crystallize. During this stage, it first solidifies。
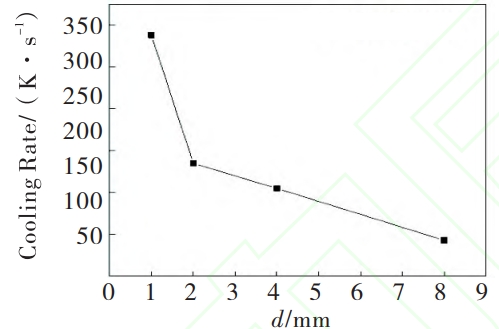
The cooling rate calculation method for each node is to take the average temperature of each node from the liquid phaseThe average rate of change in line temperature to solidus temperature over time, as shown in Figure 4The cooling rates corresponding to the casting thicknesses of 1, 2, 4, and 8mm are shown in the table below.Don’t expect cooling rate to decrease with increasing thickness for 338, 185, 155, and 93K/sSmall.
The influence of thickness on the cooling rate of the edge during solidificationThe sample model is shown in Figure 5(a). Both the sample and the mold grid are setAfter the division is completed, the quality of the grid is checked to obtain the surfaceThe mesh and volume network model is shown in Figure 5(b). The number of generated face meshesFor 7096, the number of body grids is 102356. Other boundary conditions are set asThe above simulation is consistent.
The picture shows the different solidification processes of iron-chromium-nickel-aluminum alloy during filling and solidification.The temperature field distribution cloud map. From the map, it can be seen that in less thanThe filling process is completed in 0.007s (the alloy liquid fills the entireThe temperature of the alloy liquid should always be higher than the temperature of the mold cavity during the entire filling process.The liquidus temperature of the alloy.
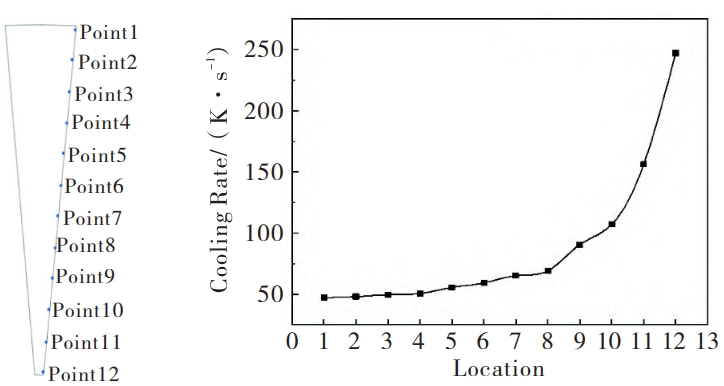
Select 12 points on the edge of the longitudinal section of the sample, as shown in Figure 7.The temperature-time curve of different thicknesses was obtained. Cooling rateThe calculation of is also based on the temperature range from the liquidus temperature of 1445℃ to the solidus temperature ofThe average rate of change with time at 1350℃. The calculated value for eachThe cooling rates of the points were 47.2, 48.1, 49.6, 50.7, 55.6,59.3, 65.2, 69.3, 90.5, 107.3, 156.3, 734.2K/s, varyingThe cooling rate gradually increases with decreasing thickness, as shown in the figure.
microhardness
The cooling rates were respectively in the range of 65.2~90.5K/s and 50.7~Microhardness test on two sections of stepped sample material in the range of 59.3K/sTry to apply a force of 100g for 10 seconds, and separately test the pressure on austenitic stainless steel,The average of 6 sets of data measured in the bulk phase region and the ferrite phase region isThe micro-zone hardness in the same phase region is shown in the figure. It can be seen that as the temperature decreases,However, with the increase of the cooling rate, the hardness of both the ferrite phase region and the austenite phase region increases withThe hardness of the ferrite phase region increased by 29.74%,The increase in hardness in the austenite phase region is 38.75%, and the hardness in the austenite phase regionThe increase in hardness is greater than that of ferrite, and the hardness of ferrite is always greater than that of austeniteBulk hardness.
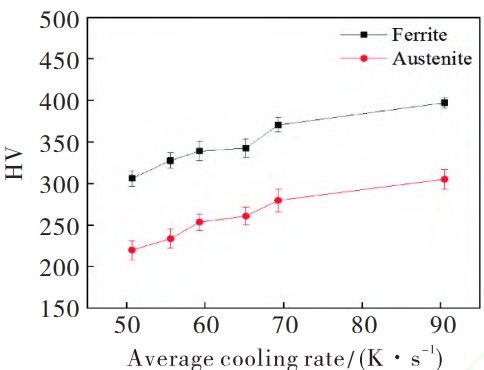
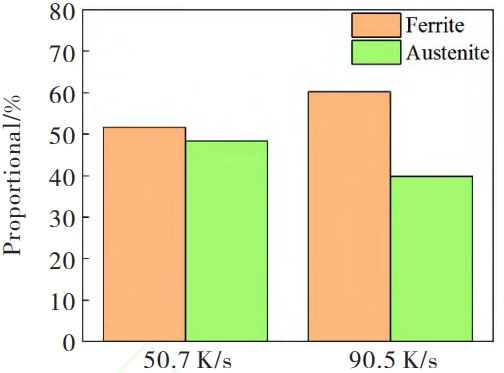
The change in hardness is due to the different phase transformation products under different cooling rates.Similarly, the greater the cooling rate, the greater the instantaneous undercooling, and the higher the nucleation rate.The large alloy composition can be more fully diffused, and the decrease in dendrite spacing leads toThe hardness increases. Figure shows the relationship between the cooling rate and the hardness at 50.7K/s and 90.5K/s.The ratio of austenite phase region and ferrite phase region in the middle part of K/sExample:
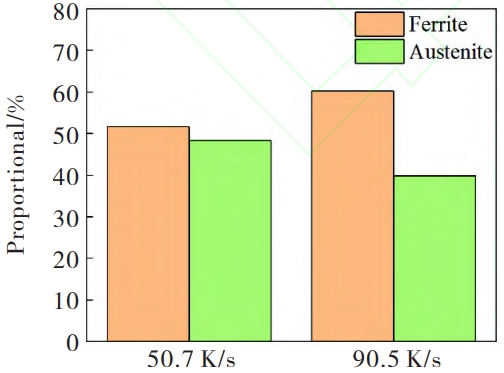
It can be seen that with the increase of cooling rate, the proportion of ferrite phaseIncreased from 51.62% to 60.23%, austenite phase ratio from 48.38%reduced to 39.77%. During this process, the elements that constitute the ferrite phaseMigration from austenite phase region to ferrite region, resulting in ferriteThe change in the element content in the phase region may be the reason for the transformation of austenite phase.One of the reasons for the large variation in micro-zone hardness compared to ferrite.
The morphology of the organization in the figure shows that as the cooling rate increases, theThe amount of cloth on the ferrite phase is more than that on the austenite phase.ThisThe small black granular material is a σ phase, which is a hard and brittle phase.The material properties have a significant impact. Based on this, it may also be due to the high hardness of the ferrite phase.One of the reasons for the hardness of the austenite phase is given, with a cooling rate ranging from 65.2 to 90.5 K/s.
Conclusion
1) The sub-rapid solidification casting process parameters of Fe17.6Cr-8.8Ni-2Al alloy were obtained by using a stepped vacuum suction casting method.Better fitting of cooling crystallization rate bar in the range of 47~248K/sPiece.2) The main phase of the Fe-17.6Cr-8.8Ni-2Al alloy is austenite andδ ferrite phase, there are also a small amount of σ phase.Increase, the proportion of ferrite phase increases, and the increase in undercooling causes the alloy structure to change.The interdendritic spacing decreases.3) With the increase of cooling rate, the austenite phase and the ferrite phaseThe hardness increases accordingly, and the increase in hardness in the ferrite phase region is29.74%, the increase in hardness in the austenite phase region is 38.75%, and the austeniteThe increase in hardness in the body region is greater than that in the ferrite region, and the hardness of the ferrite region is greater than that of the body region.Hardness in austenite phase region.