
1. Introduction
The manufacturing industry serves as the foundation of national development, with casting technology playing an indispensable role in modern production systems. Traditional casting processes consume significant quantities of molding sand to form dense sand molds, but the thermal dissipation difficulties during pouring lead to high energy consumption, low efficiency, and substantial carbon emissions. The emergence of additive manufacturing, particularly 3D sand printing technology, has brought revolutionary changes to the foundry industry. This technology combines the high geometric freedom of 3D printing with the practical requirements of sand casting, enabling the efficient production of complex castings through digital design and precision layer-by-layer construction.
3D sand printing works on the principle of discrete stacking. Among various additive manufacturing techniques, Binder Jetting technology has shown exceptional applicability in the casting industry. The process involves spreading a layer of sand material across the build platform, followed by the selective deposition of binder onto the sand layer to bond particles together at designated positions. Unbonded sand material remains as dry powder, providing natural support during printing and being easily removed after the printing process. This cycle of spreading and binding repeats layer by layer until the complete sand mold is formed, after which it undergoes curing and finishing processes.
The entire 3D sand printing production workflow comprises six distinct stages: design, printing material preparation, printing, sand mold post-processing, pouring and casting, and casting post-processing. Among these, the printing stage, sand mold post-processing stage, and pouring stage constitute the core of forming efficiency, as the time consumed by the design stage, material preparation, and casting post-processing largely depends on manual efficiency. The combined efficiency of these three stages defines the overall forming efficiency of the 3D sand molding process.
Despite rapid advances in 3D sand printing technology, the enhancement of forming efficiency remains constrained by the coupled effects of multiple process parameters. Key printing parameters including layer thickness, sand spreader speed, X-resolution, and print head working speed directly influence printing time and mold quality, yet their systematic optimization has not been thoroughly investigated. Furthermore, the structural design of sand molds manufactured via 3D sand printing presents unique opportunities for efficiency improvement through reduced sand consumption, enhanced cooling performance, and simplified post-processing. This study addresses these challenges through a comprehensive investigation of process parameter impacts, the development of a forming efficiency prediction model, and the application of multi-objective optimization algorithms to identify optimal parameter combinations and structural configurations.
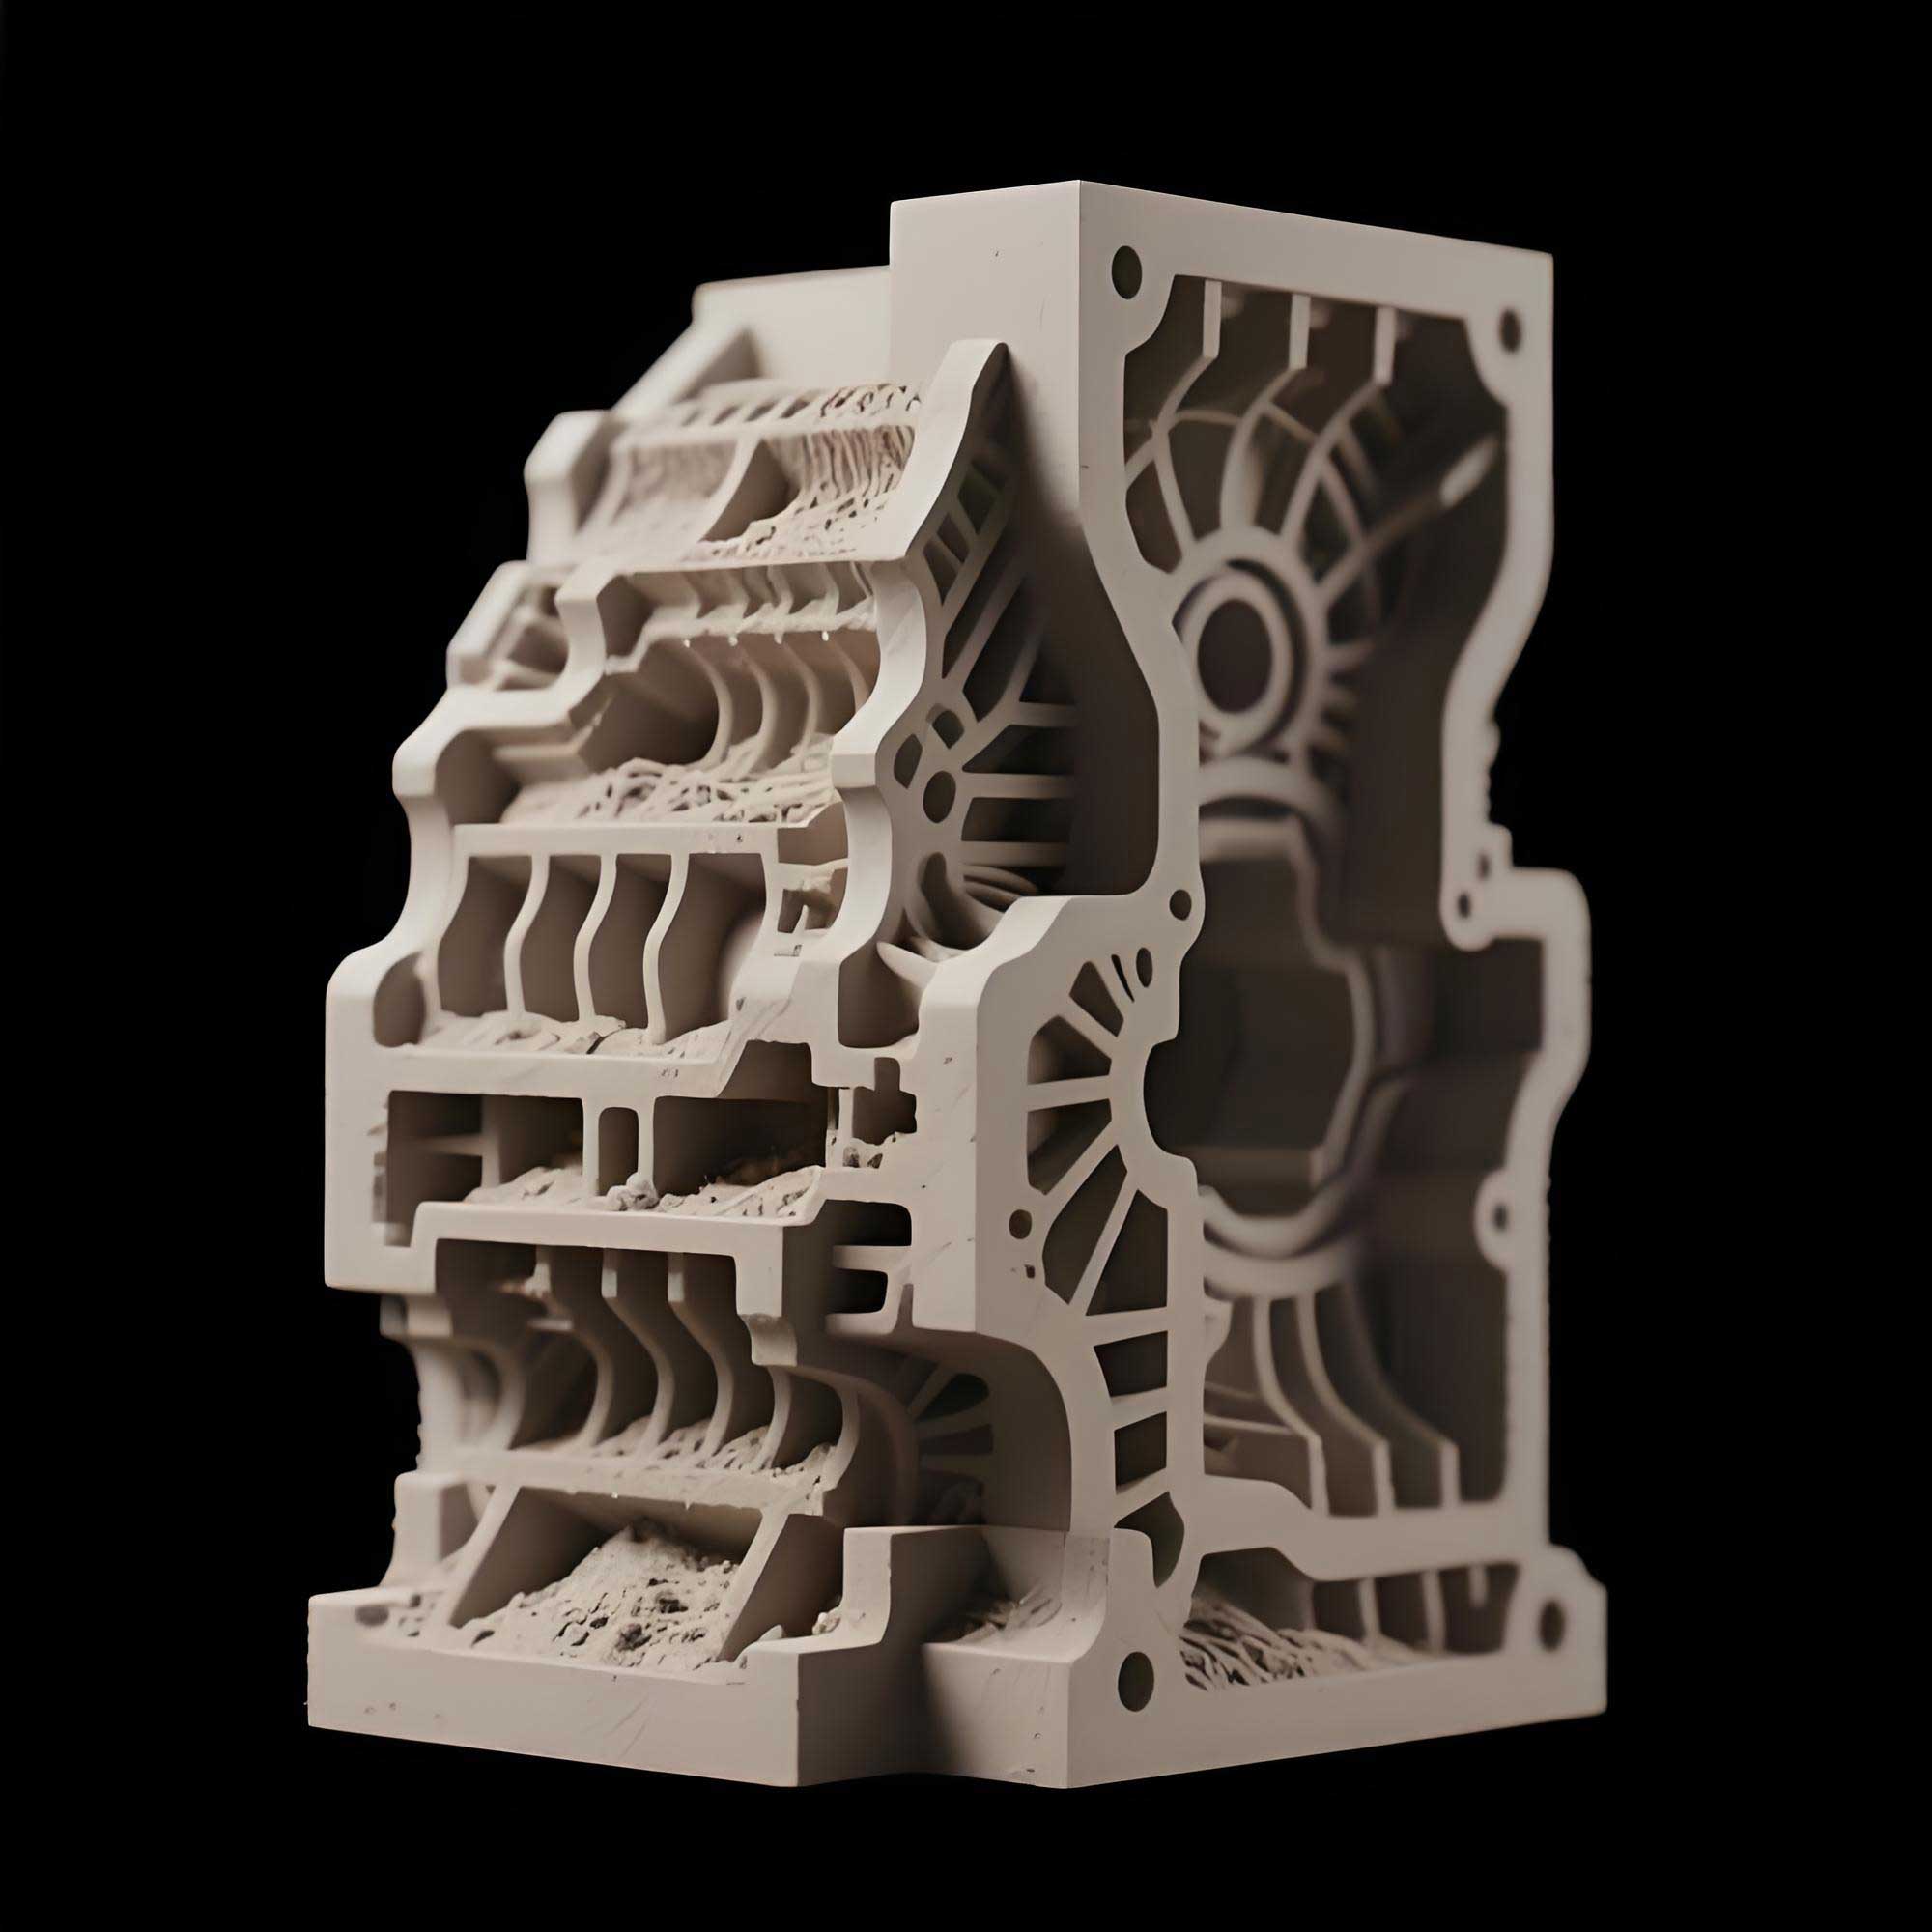
2. Experimental Investigation of Process Parameters on Forming Efficiency
2.1 Orthogonal Experimental Design
To systematically evaluate how different process parameters affect the forming efficiency of 3D sand printing, an orthogonal experimental design was implemented. Through comprehensive analysis of the 3D sand printing working principles, four primary parameters were identified as having direct impacts on both forming efficiency and mold quality: layer thickness, sand spreader speed, X-resolution, and print head working speed.
Layer thickness determines the number of print layers required, directly governing the overall printing time and final surface quality. The sand spreader speed controls the quality and uniformity of each sand layer, while X-resolution defines the lateral precision of binder jetting, influencing both printing details and binder consumption. The print head working speed determines the binder jetting rate and is a core parameter affecting printing time while simultaneously influencing the uniformity of binder distribution and the structural integrity of the final mold.
An \(L_{16}(4^4)\) orthogonal array was constructed with the four factors at four levels each, as summarized in Table 1. The experiments were conducted using an AFS-J1600Plus industrial-grade sand mold 3D printer, which provides high precision and stability suitable for complex sand mold structures. This equipment specification ensures that observed effects in the experiments can be attributed to parameter variations rather than machine inconsistencies.
Table 1: Orthogonal test parameters and levels
| Parameter | Level 1 | Level 2 | Level 3 | Level 4 |
|---|---|---|---|---|
| Layer thickness \(L_t\) (mm) | 0.20 | 0.25 | 0.30 | 0.35 |
| Sand spreader speed \(v_{sg}\) (mm/s) | 510 | 660 | 710 | 860 |
| X-resolution \(X_R\) (mm) | 0.063 | 0.102 | 0.145 | 0.188 |
| Print head speed \(v_{hs}\) (mm/s) | 567 | 582 | 601 | 620 |
2.2 Experimental Results and Range Analysis
The orthogonal experiments were performed following the design matrix, and the resulting printing times are presented in Table 2. The range analysis (R) was calculated for each factor, with results showing distinctly different magnitudes of influence among the four parameters. The range value for layer thickness was R = 5913.50, which was substantially higher than the range value for sand spreader speed at R = 1728.75. The print head working speed exhibited a range of R = 848.50, while X-resolution showed the smallest range of R = 454.50.
Table 2: Orthogonal experiment results and range analysis
| No. | \(L_t\) (mm) | \(v_{sg}\) (mm/s) | \(X_R\) (mm) | \(v_{hs}\) (mm/s) | Printing time (s) |
|---|---|---|---|---|---|
| 1 | 0.20 | 510 | 0.063 | 567 | 15659 |
| 2 | 0.20 | 660 | 0.102 | 582 | 13456 |
| 3 | 0.20 | 710 | 0.145 | 601 | 12703 |
| 4 | 0.20 | 860 | 0.188 | 620 | 12485 |
| 5 | 0.25 | 510 | 0.102 | 582 | 11324 |
| 6 | 0.25 | 660 | 0.063 | 567 | 10456 |
| 7 | 0.25 | 710 | 0.188 | 620 | 11034 |
| 8 | 0.25 | 860 | 0.145 | 601 | 9840 |
| 9 | 0.30 | 510 | 0.145 | 601 | 9513 |
| 10 | 0.30 | 660 | 0.188 | 620 | 8945 |
| 11 | 0.30 | 710 | 0.063 | 567 | 8638 |
| 12 | 0.30 | 860 | 0.102 | 582 | 8677 |
| 13 | 0.35 | 510 | 0.188 | 620 | 8408 |
| 14 | 0.35 | 660 | 0.145 | 601 | 7866 |
| 15 | 0.35 | 710 | 0.102 | 582 | 7388 |
| 16 | 0.35 | 860 | 0.063 | 567 | 6987 |
| K1 mean | Average per level group | 13575.75 / 11226.00 / 10435.00 / 10809.00 | |||
| K2 mean | Average per level group | 10663.50 / 10180.75 / 10211.25 / 10085.50 | |||
| K3 mean | Average per level group | 8943.25 / 9940.75 / 9980.50 / 9989.75 | |||
| K4 mean | Average per level group | 7662.25 / 9497.25 / 10218.00 / 9960.50 | |||
| R | Range (max-min of K means) | 5913.50 / 1728.75 / 454.50 / 848.50 | |||
Based on the range values, the influence ranking of the four parameters on printing time is: layer thickness > sand spreader speed > print head working speed > X-resolution. This ranking indicates that layer thickness and sand spreader speed are the dominant factors controlling forming efficiency in 3D sand printing, whereas X-resolution and print head speed serve as secondary parameters that primarily influence mold quality aspects.
2.3 Analysis of Variance and Interaction Effects
To rigorously verify the statistical significance of the parameter effects, analysis of variance was conducted with a significance level of \(\alpha = 0.05\). The results confirmed that layer thickness (F-ratio = 191.576) and sand spreader speed (F-ratio = 15.748) both exceeded the critical F value of 9.280, establishing their statistical significance. In contrast, X-resolution (F-ratio = 1.009) and print head working speed (F-ratio = 4.734) did not reach significance at this level.
Table 3: Analysis of variance results
| Factor | Sum of Squares | df | F-ratio | F critical | Significance |
|---|---|---|---|---|---|
| \(L_t\) (mm) | 78,518,461.188 | 3 | 191.576 | 9.280 | * |
| \(v_{sg}\) (mm/s) | 6,454,456.188 | 3 | 15.748 | 9.280 | * |
| \(X_R\) (mm) | 413,420.688 | 3 | 1.009 | 9.280 | Not significant |
| \(v_{hs}\) (mm/s) | 1,940,223.688 | 3 | 4.734 | 9.280 | Not significant |
To further verify the interactions between parameters, an interaction effect analysis was conducted. The interaction between layer thickness and sand spreader speed demonstrated statistical significance (P = 0.021), indicating a synergistic time-saving effect when thicker layers are combined with higher spreading speeds. The interaction between X-resolution and print head speed did not reach significance (P = 0.340), consistent with their independent roles in the printing process.
Table 4: Interaction effect analysis
| Interaction | Sum of Squares | F-value | P-value | Significance |
|---|---|---|---|---|
| \(L_t \times v_{sg}\) | 356.421 | 4.82 | 0.021 | * |
| \(X_R \times v_{hs}\) | 78.329 | 1.06 | 0.340 | Not significant |
These findings form the foundation for establishing the forming efficiency prediction model and for identifying the parameter ranges where process optimization can yield the greatest benefits. The dominant roles of layer thickness and sand spreader speed suggest that optimization efforts should prioritize these two parameters while ensuring that mold quality constraints are satisfied.
3. Forming Efficiency Prediction Model for 3D Sand Printing
The forming efficiency of 3D sand printing is quantified by the number of finished castings that can be produced per unit time. Considering the three core stages, the total forming efficiency \(\eta_{total}\) can be expressed as:
$$\eta_{total} = \frac{t_{total}}{t_{print}^{total} + t_{pp} + t_c}$$
where \(t_{print}^{total}\) is the total printing time, \(t_{pp}\) is the sand mold post-processing time (curing and cleaning), and \(t_c\) is the pouring stage time.
3.1 Printing Stage Efficiency Model
The printing time in 3D sand printing is primarily composed of the sand spreading time and the print head jetting time for each layer, multiplied by the total number of layers. The total number of layers \(T_i\) depends on the sand mold height and the layer thickness as:
$$T_i = \frac{H_{sd}}{L_t}$$
where \(H_{sd}\) is the sand mold height and \(L_t\) is the layer thickness. This relationship directly reflects why layer thickness has such a dominant effect on printing efficiency: doubling the layer thickness halves the number of print layers and thus nearly halves the printing time.
The time consumed by the sand spreader to complete one layer of sand spreading, \(t_{sg}\), incorporates the buffer distance, acceleration, and waiting time required during the spreading process:
$$t_{sg} = \frac{w – 2d_{sgb}}{v_{sg}} + \alpha_{sg}\frac{v_{sg}}{a_{sgb}} + t_{wait}$$
where \(w\) represents the working platform width, \(d_{sgb}\) is the printing buffer distance, \(\alpha_{sg}\) is the buffer count, \(a_{sgb}\) is the buffer acceleration, and \(t_{wait}\) is the stabilization waiting time after spreading each layer. The sand spreader operates in a reciprocating manner: it travels from its starting position to spread sand across the platform, pauses briefly for the sand layer to stabilize, then returns while the print head begins its printing operation.
For the print head operation, the time required per layer \(t_{ph}\) can be expressed as:
$$t_{ph} = \beta\frac{l_{section} – d_{pb}}{v_{hs}} + \frac{w_{section} – d_{pb}}{v_{hs}} + \alpha_{ph}\frac{v_{hs}}{a_{pb}}$$
where \(\beta\) is the number of one-way traversals of the print head along the X-axis, \(l_{section}\) and \(w_{section}\) are the maximum working length and width of the print head, \(d_{pb}\) is the print head buffer distance, \(\alpha_{ph}\) is the buffer count, and \(a_{pb}\) is the buffer acceleration.
The total printing time for the entire sand mold, \(T_{total}^{print}\), is then obtained by combining these component times:
$$T_{total}^{print} = \left(\frac{w – 2d_{sgb}}{v_{sg}} + \alpha_{sg}\frac{v_{sg}}{a_{sgb}} + t_{wait} + \beta\frac{l_{section} – d_{pb}}{v_{hs}} + \frac{w_{section} – d_{pb}}{v_{hs}} + \alpha_{ph}\frac{v_{hs}}{a_{pb}}\right) \times \frac{H_{sd}}{L_t}$$
This comprehensive model captures the coupled effects of all four key printing parameters on the total printing time.
3.2 Relationship Between X-Resolution and Print Head Speed
An important observation from the experimental data is the functional relationship between X-resolution and print head working speed. Through polynomial fitting of data obtained from the AFS-J1600Plus printer, a quartic polynomial relationship was established:
$$X_R = p_1 + p_2 \cdot v_{hs} + p_3 \cdot v_{hs}^2 + p_4 \cdot v_{hs}^3 + p_5 \cdot v_{hs}^4$$
For the equipment used in this investigation, the polynomial coefficients are \(p_1 = 559.6\), \(p_2 = -7826\), \(p_3 = 151200\), \(p_4 = -956200\), and \(p_5 = 2020000\). The fitting accuracy was confirmed with R² = 0.98728 and RMSE = 0.00002663, indicating excellent agreement between the empirical data and the model. This relationship enables the optimization algorithm to treat X-resolution and print head speed as dependent variables, reducing the dimensionality of the optimization problem while maintaining physical realism.
3.3 Sand Mold Post-Processing Time Model
After printing, the sand mold requires curing to develop sufficient mechanical strength. The curing time \(t_{sc}\) depends on the sand mold thickness and the curing conditions:
$$t_{sc} = L_{sd} \cdot t_s$$
where \(L_{sd}\) represents the minimum distance from the outer surface to the geometric center of the mold, and \(t_s\) is the curing time per unit thickness. The curing process can occur naturally in ambient conditions or be accelerated with heating, with larger molds requiring longer curing times due to less effective internal heat transfer.
The sand cleaning time \(t_{cs}\) accounts for the removal of unbonded sand from the mold cavities and surfaces. This is calculated based on the volume of remaining sand, the mold surface area, and the cleaning equipment capacity as:
$$t_{cs} = \frac{(w_{ssd} – w_{sd}) / \rho_{ps} + S_{sd} \cdot V_{as}}{V_{cs}}$$
where \(w_{ssd}\) is the weight of the sand mold before cleaning, \(w_{sd}\) is the weight after cleaning, \(\rho_{ps}\) is the density of the premixed sand, \(S_{sd}\) is the mold surface area after closing the pouring system, \(V_{as}\) is the volume of attached sand per unit area of the resin-bonded sand surface, and \(V_{cs}\) is the volume of sand removable per unit time by the cleaning tool.
The total post-processing time \(t_{pp}\) is therefore:
$$t_{pp} = t_{cs} + t_{sc}$$
3.4 Pouring and Solidification Stage Time Model
The pouring stage involves two major time components: the filling time during which liquid metal is introduced into the mold cavity, and the cooling time during which solidification occurs. The filling time \(t_{placing}\) is calculated based on the mold cavity volume and the pouring rate as:
$$t_{placing} = \frac{V_{sd}}{Q_{molten}}$$
where \(V_{sd}\) is the volume to be filled and \(Q_{molten}\) is the metal pouring rate per unit time. The cooling time \(t_{cooling}\) is determined through numerical simulation using the ProCAST casting simulation software, which models the temperature field evolution \(T = f(x,y,z,t)\) across the entire sand mold system. The total pouring stage time \(t_c\) is:
$$t_c = t_{cooling} + t_{placing}$$
The established prediction model integrates all three stages, enabling accurate estimation of overall forming efficiency before actual production. The model accuracy was verified through 16 sets of experiments, achieving an average accuracy of 94.16% for the printing stage, 96.14% for the post-processing stage, and 94.35% for the pouring stage, with a total accuracy of 94.88%.
4. Multi-Objective Optimization of Printing Process Parameters
4.1 NSGA-II Algorithm Implementation
The optimization objectives in this study are inherently conflicting: maximizing printing efficiency while maintaining satisfactory mold mechanical properties. The Non-dominated Sorting Genetic Algorithm II (NSGA-II) was employed to solve this multi-objective optimization problem. NSGA-II is among the most widely used evolutionary algorithms for multi-objective optimization, offering efficient non-dominated sorting, maintain diversity through crowding distance, and produces a well-distributed Pareto front spanning the trade-off surface between competing objectives.
The optimization model is formulated as:
$$Z(\mu_1, \mu_2, \cdots, \mu_n) = \begin{bmatrix} \max E_{op} \\ \max \sigma_{op} \end{bmatrix}$$
subject to the parameter constraints:
$$C_1(X_i) = Q(X_i) \geq Q_{min}$$
$$C_2(X_i) = Max(X_i) \geq P_N(X_i) \geq Min(X_i)$$
where \(E_{op}\) represents the printing efficiency (inverse of printing time), \(\sigma_{op}\) represents the sand mold mechanical property characterized by three-point bending stress, \(Q(X_i)\) denotes the actual three-point bending property of the printed sand mold, and \(Q_{min}\) signifies the acceptable minimum bending stress determined by the foundry application requirements.
The three-point bending stress is calculated from standard testing as:
$$\sigma_{op} = F \cdot \frac{3l}{2bd^3}$$
where \(F\) is the applied load at the center, \(l\) is the span between lower support points, \(b\) is the test specimen width, and \(d\) is the specimen thickness.
The sand mold bending stress as a function of printing parameters was established through empirical relationships quantified by experimental studies. The relationship incorporates the sand spreader speed and X-resolution as:
$$Q_{sand} = 0.203 + 0.003X_R + 0.021V_{sg} + 0.021(X_R – V_{sg})$$
The NSGA-II optimization procedure involves population initialization, non-dominated sorting to establish fitness levels, crowding distance calculation to maintain diversity, selection based on rank and crowding distance, crossover and mutation to generate offspring, and iterative evolution until convergence.
4.2 Optimization Results and Parameter Selection
After applying the NSGA-II algorithm, a Pareto-optimal solution set was generated, representing the trade-off curve between printing time and sand mold bending stress. To select the most suitable solution from this set, the TOPSIS (Technique for Order Preference by Similarity to Ideal Solution) method with entropy-based weighting was implemented.
The TOPSIS procedure begins by constructing the evaluation matrix:
$$S = \left(S_{ij}\right)_{t \times 3}$$
followed by dimensionless normalization and entropy-based weight calculation:
$$X_{ij}^{*} = \frac{S_{ij} – \min\{S_{ij}\}}{\max\{S_{ij}\} – \min\{S_{ij}\}}$$
$$e_j = -k \sum_{i=1}^{m} P_{ij} \ln P_{ij}, \quad g_j = 1 – e_j, \quad w_j = \frac{g_j}{\sum_{j=1}^{n} g_j}$$
The final closeness index determines the optimal compromise solution among the Pareto set:
$$R_j = \frac{Z_j^{-}}{Z_j^{+} + Z_j^{-}}$$
Table 5: Top 10 solutions from the Pareto-optimal set
| Rank | \(v_{sg}\) (mm/s) | \(v_{hs}\) (mm/s) | \(L_t\) (mm) | \(X_R\) (mm) | Print time (s) | Bending stress (MPa) | Closeness index |
|---|---|---|---|---|---|---|---|
| 1 | 713 | 595 | 0.332 | 0.132 | 8102 | 1.697 | 0.703 |
| 2 | 702 | 593.3 | 0.328 | 0.128 | 8326 | 1.705 | 0.685 |
| 3 | 724 | 596.8 | 0.336 | 0.136 | 8069 | 1.688 | 0.664 |
| 4 | 691 | 591.5 | 0.324 | 0.124 | 8460 | 1.746 | 0.651 |
| 5 | 735 | 598.5 | 0.340 | 0.140 | 7947 | 1.635 | 0.632 |
| 6 | 680 | 589.8 | 0.320 | 0.120 | 8598 | 1.763 | 0.626 |
| 7 | 746 | 600.3 | 0.344 | 0.144 | 7828 | 1.632 | 0.613 |
| 8 | 669 | 588 | 0.316 | 0.116 | 8741 | 1.776 | 0.602 |
| 9 | 757 | 602 | 0.348 | 0.148 | 7712 | 1.632 | 0.599 |
| 10 | 658 | 586.3 | 0.312 | 0.112 | 8888 | 1.798 | 0.587 |
The optimal parameter combination ranking first according to the TOPSIS closeness index was selected for further application: layer thickness \(L_t = 0.332\) mm, sand spreader speed \(v_{sg} = 713\) mm/s, X-resolution \(X_R = 0.132\) mm, and print head working speed \(v_{hs} = 595\) mm/s. This combination achieved a printing time of 8102 seconds while maintaining a bending stress of 1.697 MPa.
The comparison of printing time across different parameter configurations showed significant improvements: the NSGA-II optimized parameters reduced printing time by 28.45% compared to the printer default settings and further improved efficiency by 6.21% over the best-performing orthogonal experiment configuration.
Table 6: Printing time comparison under different parameter configurations
| Configuration | Printing time (s) | Improvement vs. default |
|---|---|---|
| Printer default settings | 11325 | — |
| Best orthogonal experiment (No. 16) | 6987 | 38.30% |
| NSGA-II optimized parameters | 8102 | 28.45% |
5. Sand Mold Structure Optimization for Enhanced Forming Efficiency
5.1 Parting Surface Design for 3D Sand Printing
Unlike traditional casting where the parting surface primarily serves for pattern extraction, the parting surface in 3D sand printing mainly functions to facilitate sand removal during post-processing. The design of the parting surface significantly impacts the ease and efficiency of cleaning unbonded sand from mold cavities and internal channels, particularly for complex casting geometries.
Several principles were established for determining optimal parting surfaces in 3D sand printing:
- Place the main portions of the casting in the same sand mold section to minimize dimensional deviations from mold shifting.
- Locate machining reference surfaces and primary machining surfaces in the same mold section.
- Minimize the number of parting surfaces, generally selecting a single parting surface.
- Choose surfaces with larger blank areas or higher hole densities in the cross-section, which facilitate easier sand removal.
- For molds with multiple runners or complex bottom structures, position the parting surface in the lower portion of the mold to enable direct tool access.
- Ensure that the parting surface does not compromise the structural strength of the casting, particularly in critical load-bearing regions.
In this study, an engine block casting served as the application case study. The traditional sand mold design with multiple runners and complex internal passages required careful parting surface selection to ensure complete sand removal from narrow runner channels at the mold bottom.
5.2 Cooling Enhancement Through Structural Design
3D sand printing offers exceptional design freedom that enables innovative mold structures to optimize cooling performance and reduce material consumption. This study evaluated two distinct sand mold structural configurations: a fully truss-supported shell structure (Type b) and a hybrid design combining truss reinforcement with honeycomb lattice structures (Type c), compared against a solid/dense baseline design (Type a).
For the truss structure, the cross-sectional dimension was calculated using the structural mechanics relationship:
$$r_t > \sqrt{\frac{S_t}{b}}$$
where \(r_t\) is the edge length of the truss element cross-section, \(S_t\) is the total cross-sectional area requiring support, and \(b\) is the number of truss support members. This design ensures sufficient load-bearing capacity to maintain the casting accuracy during pouring while minimizing material usage.
For the honeycomb structure, the relative density determines the mechanical stiffness and material reduction:
$$\frac{\rho^*}{\rho_s} = C_1 \frac{D_{hc}}{l_{hc}}$$
where \(\rho^*\) and \(\rho_s\) represent the density of the honeycomb structure and the solid material, respectively, \(C_1 = 2/\sqrt{3}\) is the geometric constant for regular hexagonal cells, \(D_{hc}\) is the wall thickness of the honeycomb cells, and \(l_{hc}\) is twice the honeycomb cell edge length.
The sand mold functional modules were categorized into four groups: the forming functional module that directly shapes the metal, the cooling functional module designed to accelerate heat dissipation, the support functional module ensuring structural stability, and the pouring functional module containing the gating system. Each module was optimized according to its specific functional requirements while considering its interaction with adjacent structural elements.
Table 7: Comparison of the three sand mold structural designs
| Parameter | Type a (Solid) | Type b (Truss) | Type c (Honeycomb+Truss) |
|---|---|---|---|
| Flask dimensions (mm) | 530×442×342 | 530×420×340 | 530×417×342 |
| Sand volume (dm³) | 74.97 | 35.24 | 31.96 |
| Sand reduction vs. Type a | — | 53.0% | 57.4% |
| Minimum wall thickness (mm) | Solid | 20 | 30 |
| Truss size (mm) | — | 30×30×30 | 25×25×25 |
6. Experimental Verification Using Engine Block Production
6.1 Experimental Setup
To validate the optimization strategies derived in this research, production experiments were conducted using an engine block casting manufactured through 3D sand printing. The casting material was AlSI7Mg0.3 aluminum alloy, with overall dimensions of 392 mm × 257 mm × 202 mm. The casting featured a bottom-pour closed gating system with one sprue, six runners, and five risers, requiring precise control over metal flow to prevent defects.
Three sand mold types (a, b, and c) were manufactured using the AFS-J1600Plus 3D sand printer. The printing process parameters for the validation experiments included the 16 orthogonal combinations and the NSGA-II optimized parameters.
The pouring experiments were conducted using an RF-zp-110kw medium-frequency induction melting furnace with a maximum power of 70 kW. Pouring temperature was maintained at 750°C with air cooling, and the target demolding temperature was set to 300°C, in accordance with industrial practice for A356 aluminum alloy to balance sufficient ductility against complete solidification.
6.2 Post-Processing and Cleaning Performance
The post-processing experiments measured the curing and cleaning times for all sand mold configurations. The cleaning was performed with a 1500 W air pump connected to industrial-grade cleaning tools, with internal inspection using an industrial borescope to verify complete sand removal from all internal cavities and runner channels.
Table 8: Post-processing time and model prediction for sand mold types
| Mold type | Actual post-processing time (s) | Model prediction (s) | Accuracy |
|---|---|---|---|
| a | 14631 | 13744 | 93.94% |
| b | 11673 | 10982 | 94.08% |
| c | 13146 | 13356 | 98.40% |
The structural optimization effectively reduced post-processing time due to improved accessibility to internal cavities and more efficient paths for unbonded sand removal.
6.3 Mechanical Property Verification
Mechanical testing was performed using an XQY-II intelligent sand mold strength tester. Tensile strength specimens followed the standard design, while bending strength specimens were fabricated with dimensions of 20 mm × 20 mm × 95 mm to simulate the truss structure commonly used in optimized sand mold designs. Tests were conducted by progressively increasing the load until specimen failure.
Table 9: Mechanical properties of printed sand molds under different parameters
| No. | Tensile strength (MPa) | Bending strength (MPa) |
|---|---|---|
| 1 | 5.739 | 2.336 |
| 2 | 5.264 | 2.107 |
| 3 | 4.531 | 1.812 |
| 4 | 4.368 | 1.653 |
| 5 | 4.613 | 1.874 |
| 6 | 4.981 | 2.013 |
| 7 | 4.253 | 1.553 |
| 8 | 4.465 | 1.686 |
| 9 | 4.297 | 1.611 |
| 10 | 4.105 | 1.507 |
| 11 | 4.798 | 1.956 |
| 12 | 4.571 | 1.744 |
| 13 | 3.787 | 1.235 |
| 14 | 3.934 | 1.374 |
| 15 | 4.076 | 1.414 |
| 16 | 4.216 | 1.439 |
| 17 (NSGA-II) | 4.409 | 1.688 |
The NSGA-II optimized parameter combination produced sand molds with tensile strength of 4.409 MPa and bending stress of 1.688 MPa, both within acceptable ranges for industrial application of 3D sand printing technology. These results confirmed that the optimization process successfully maintained mechanical quality while significantly improving forming efficiency.
6.4 Pouring and Cooling Performance
The pouring experiments were conducted with the three sand mold types (a, b, c) using the NSGA-II optimized parameters for printing. All molds were poured under identical conditions of 750°C pouring temperature with the target demolding temperature of 300°C.
Table 10: Pouring results for the three sand mold types
| Parameter | Type a | Type b | Type c |
|---|---|---|---|
| Pouring time (s) | 20 | 20 | 20 |
| Cooling temperature target (°C) | 300 | 300 | 300 |
| Cooling time (s) | 3132 | 2914 | 2688 |
| Cooling improvement vs. Type a | — | 6.96% | 14.18% |
Pre-simulation analysis using ProCAST software confirmed that the casting defect contraction rates were approximately 1.25% for all three mold designs, all within acceptable foundry tolerance limits. This validation ensured that the structural optimization did not compromise the casting quality while achieving significant efficiency gains.
6.5 Comprehensive Efficiency Analysis
Combining the experimental data across all stages, the comprehensive forming efficiency of each sand mold configuration was calculated. The results are summarized in Table 11.
Table 11: Efficiency improvement comparison across all stages
| Parameter | Type a | Type b | Type c |
|---|---|---|---|
| Printing stage efficiency improvement | — | 14.9% | 27.4% |
| Post-processing efficiency improvement | — | 20.2% | 8.9% |
| Pouring stage efficiency improvement | — | 6.96% | 14.18% |
| Overall forming efficiency (pieces/24h) | 2.91 | 3.49 | 3.54 |
| Total efficiency improvement | — | 16.68% | 16.84% |
| Sand consumption reduction | — | 53.0% | 57.4% |
The Type c sand mold design achieved the highest overall forming efficiency, improving by 16.84% compared with the solid baseline design, while simultaneously reducing sand consumption by 57.4%. The combination of honeycomb lattice structures for weight reduction and truss reinforcement for structural integrity proved to be the most effective strategy for optimizing 3D sand printing mold structures.
In terms of the optimized printing parameters, the NSGA-II algorithm delivered a parameter combination that achieved a printing time of 8102 seconds for the engine block sand mold, with mechanical properties well within acceptable ranges. This parameter set balances the conflicting requirements of high forming efficiency and adequate sand mold quality, providing practical guidance for industrial application of 3D sand printing in high-volume casting production.
7. Conclusion and Future Perspectives
This research comprehensively investigated the effects of process parameters and structural design on the forming efficiency of 3D sand printing technology. The key contributions and findings include:
First, orthogonal experiments established that layer thickness and sand spreader speed are the dominant process parameters governing forming efficiency in 3D sand printing, while X-resolution and print head working speed serve as secondary parameters primarily affecting mold quality. The significant interactions between layer thickness and sand spreader speed highlight the need for coordinated optimization rather than individual parameter adjustment.
Second, a comprehensive forming efficiency prediction model was developed, covering the printing, post-processing, and pouring stages. The model demonstrated high prediction accuracy of 94.88% across 16 validation experiments, providing a reliable tool for production planning and process optimization in 3D sand printing applications.
Third, application of the NSGA-II multi-objective optimization algorithm successfully identified the optimal parameter combination: layer thickness of 0.332 mm, sand spreader speed of 713 mm/s, X-resolution of 0.132 mm, and print head working speed of 595 mm/s. This optimized configuration achieved a 28.45% reduction in printing time compared with the default settings while maintaining sand mold bending stress of 1.688 MPa and tensile strength of 4.409 MPa.
Fourth, structural optimization through functional module design, including truss-based and honeycomb lattice-supported sand mold configurations, achieved efficiency improvements of 16.84% in overall forming efficiency, with sand consumption reductions of 57.4% while maintaining casting quality with defect contraction rates below 1.25%.
Future research directions for 3D sand printing technology include expanding the parameter space to investigate additional process variables, developing advanced structural optimization algorithms specifically tailored to 3D sand printing mold design, exploring environmentally friendly binder systems to reduce the carbon footprint of the process, and further integrating machine learning approaches for real-time process monitoring and adaptive parameter control in industrial-scale production.
The advancement of 3D sand printing technology continues to promise significant benefits for the casting industry, including reduced lead times, enhanced design freedom, material efficiency, and improved casting quality. Through systematic process parameter optimization and innovative mold design methods, 3D sand printing will become increasingly competitive with traditional sand casting processes for a broader range of applications, contributing to the sustainable development of the manufacturing sector.